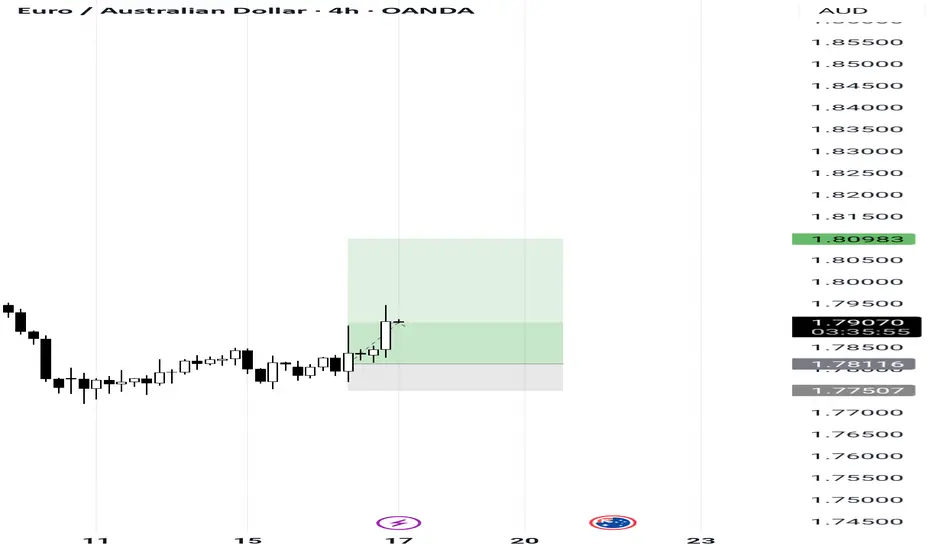
EURAUD buy ideaAs expected now price moving in our favoured direction
Took some partials and move stops to breakeven 🤝
Fundamental Analysis
Neutral zone structureThe daily chart in the S&P 500 has created a neutral zone structure. This implies a sideways move, which is what I'm looking for but with a positive close.

GBP USD LONG RESULT Price broken down the support of the falling bearish wedge it was in and then formed a minor falling wedge pattern indicating signs for upward movement, but I knew price would still move to the demand zone before further upsides, which is why I setup the entry at the order block to the Rising channel Support (Schematics) and price moved just as Predicted to Profit.
_THE_KLASSIC_TRADER_.🔥🤲🙏

EURUAD Buy!!EURAUD buy opportunity ... bounce from a strong support area and now it is time to buy the pair . risk 1:2.5 rewards and do not risk more than 1% per the trade.

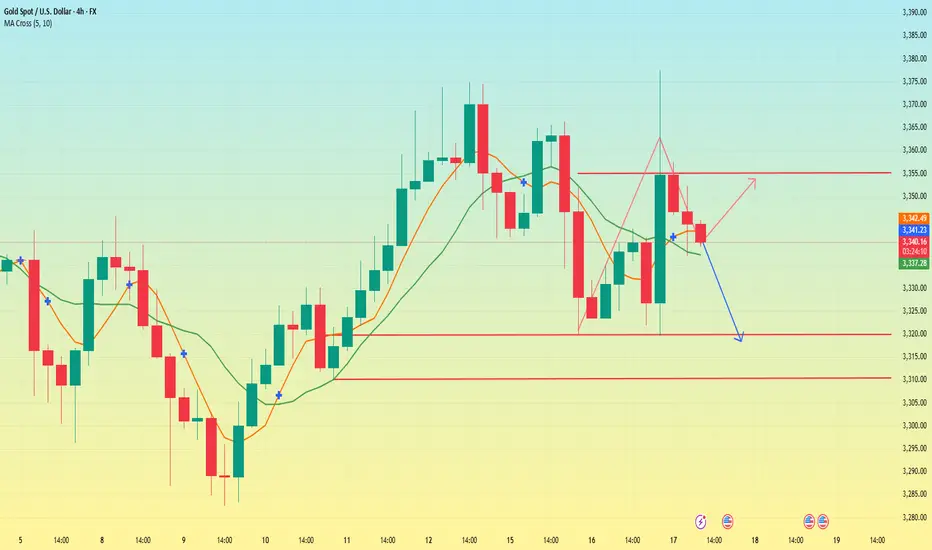
TACO trading reappears. Gold is down.The news that Trump intends to fire Powell caused a decline in US stocks and bonds, and gold prices soared in response. But then Trump denied the news, and the market subsequently fell back to stabilize.
On Wednesday, the Asian market began to fluctuate and rise in the early trading. It rose to a high of 3343 in the European market and then fell to 3319 in the US market. Then it rose sharply due to the news. It rose to a high of 3377 and then fell to 3336. It fluctuated around 3350 in the late trading. The daily line closed with a positive line with an upper shadow line.
The recent market trend fluctuated violently. Since last Wednesday, there have been three consecutive positive rises. This week, there have been two consecutive negative declines on Monday and Tuesday. On Wednesday, it closed positive after washing up and down. At present, the MA5 and 10-day moving averages have formed a golden cross, but the direction is unclear. The Asian market opened above the moving average on Thursday. The overall pattern needs to pay attention to the breakthrough of the key points of long and short positions.
Today, the focus below is on the support near the low point of 3320, followed by the support near 3315 and 3310. This position is the trend line support formed by the previous low point connection. If it breaks down, we need to pay attention to the position of 3280. The upper resistance level is mainly concerned with the resistance near 3355, which is the rebound high point after the US market hit 3377.
Today, the operation needs to adjust the strategy according to the breakthrough of key points. In the volatile market, we need to be vigilant about the sudden fluctuations caused by the news. After breaking the key support or resistance, the trend direction may be further clarified.
PG Approaching Oversold Discount Zone Ahead of Q4 Earnings BTFD?📝 Procter & Gamble (NYSE: PG) is trading at $153.73 (-10.8% YTD), lagging the S&P 500’s +6.5% YTD gain. Despite recent weakness, a confluence of technical support, dividend resilience, and a looming catalyst could signal a tactical entry. Let’s break it down:
🔍 Fundamentals & Catalysts
Q4 Earnings Webcast (July 29):
P&G will webcast Q4 results at 8:30 AM ET, with focus on organic sales growth (guided at +2% FY25) and margin trajectory 14.
EPS Expectations: Q4 consensus at $1.43 (+2.1% YoY); FY25 core EPS guided at $6.72–6.82 (2–4% growth) 410.
Dividend Fortress:
Quarterly payout raised to $1.0568/share (ex-div: July 18), marking 69 consecutive years of increases and a 2.75% yield 612.
Payout ratio at 67% of earnings – sustainable for a consumer staple 6.
Cost Pressures & Mitigation:
Tariff Headwinds: $1B–$1.5B annual cost hit from U.S.-China tariffs 410.
Offsets: $2.4B dividend payouts + $1.4B buybacks in Q3; 280bps gross productivity savings 10.
🌍 Macro & Risk Factors
Consumer Softness: Q3 net sales fell -2% YoY; volume declines in Baby Care (-2%) and Fabric & Home Care (-1%) segments 10.
Pricing Power: Average +1% pricing in Q3 (led by Grooming/Health Care), though mix/elasticity risks persist 104.
Structural Shifts: Portfolio pruning (minor brand exits) and job cuts to offset tariff impacts 4.
📉 Technical Setup: Oversold with Base-Building Potential
RSI 31.5 (Neutral but nearing oversold) 511.
Price vs. MAs: Below all key MAs (20-day: $159.17, 50-day: $161.59, 200-day: $165.56) – signaling bearish momentum but extreme discounts 5811.
Support Zone: $152–153 aligns with 52-week lows ($151.90) and the 2025 dividend-capture floor 212.
MACD -1.57: Suggests potential reversal if momentum shifts 5.
Technical Indicators Summary:
Indicator Value Signal
RSI (14) 31.45 Neutral
MACD (12,26) -1.57 Buy
Price vs. 200D SMA -7.1% Sell
Bollinger Bands (25) $157–161.94 Sell
🎯 Probabilistic Price Targets
Scenario Target Probability Rationale
Bounce to 20D MA $158–160 60% Mean reversion + dividend ex-date support
Reversion to 50D MA $162–164 45% Technical confluence + tariff resolution hopes
Rally to 200D MA + ATH $174 25% Bull case: Macro stabilization + guidance upgrade
📌 Trade Strategy
Entry: $152–154 (aligns with structural support) 28.
Stop Loss: $149.50 (1–2% below July 16 low of $152.27) 2.
Targets: Scale out at $160 → $164 → $174.
Catalysts: Q4 earnings (July 29) + clarity on tariff mitigation 14.
Position Size: Allocate 3–5% of portfolio; pair with long-volatility hedge.
⚠️ Key Risks
Guidance Miss: Sluggish volumes or tariff escalation could pressure FY26 EPS projections.
Technical Breakdown: Close below $151.90 invalidates support, inviting a slide to $145.
Macro Sensitivity: Consumer staples underperformance if inflation rebounds.
💎 Final Take
PG offers a rare combo: defensive yield (2.75%) + oversold technicals + imminent catalyst. While tariffs and consumer weakness justify caution, the $152–154 zone is a high-probability dip-buying opportunity. Earnings day vol could amplify moves – enter pre-event with tight stops.
#PG #ConsumerStaples #DividendKing #EarningsPlay #Tariffs
Disclaimer: This is not financial advice. Conduct your own due diligence.

Daily Analysis- XAUUSD (Thursday, 17th July 2024)Bias: Buliish
USD News(Red Folder):
-Core Retail Sales m/m
-Retail Sales m/m
-Unemployment Claims
Notes:
- Take note on the war news
- Looking for price to retest 0.382 fib levl
- Potential BUY if there's
confirmation on lower timeframe
- Pivot point: 3300
Disclaimer:
This analysis is from a personal point of view, always conduct on your own research before making any trading decisions as the analysis do not guarantee complete accuracy.

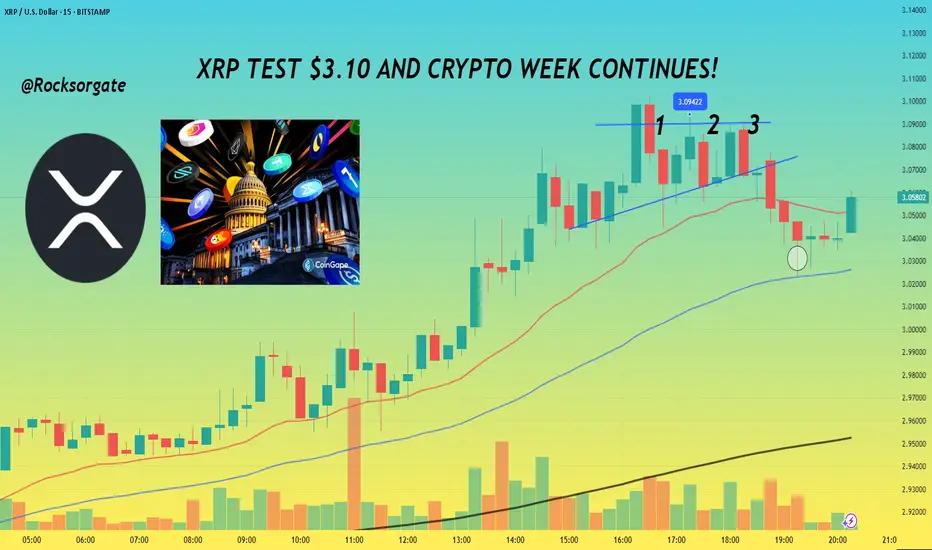
XRP TEST $3.10 AND CRYPTO WEEK CONTINUES!📊 Hey hey, hope all is well, gonna keep this idea pretty short and concise for the day, have a lot to do but thanks for joining as always.
📊 With Crypto week ongoing and the House of Representatives considering the Guiding and Establishing National Innovation for U.S Stable coins or GENIUS for short. Alongside that there's the Digital Asset Market Clarity Act or Clarity for short which is being considered as well. The last bill being considered is one which would be directed towards blocking the Federal Reserve from issuing a central bank digital currency directly to individuals.
📊 For summary CBDC is fiat money, just in digital form and that fiat money is issued and regulated by a central bank of a country.
📊 GENIUS has already made the rounds and passed through senate but is facing a snag, in limbo as House lawmakers as some lawmakers like Marjorie Taylor Greene and Chip Roy who themselves we're looking to get anti-CBDC language in with 12 republicans voting no on Tuesday's vote. Least to say things are still in flux, so we'll have to see if lawmakers can come to an agreement and sort things out simply put.
📊 If passed GENIUS would require stable coins to be fully backed by U.S dollars or similar liquid assets. Along with this you'd have annual audits for issuers with a market cap of more than $50 billion and guidelines would be established for foreign issuance.
📊 the Clarity Act takes a full on approach to crypto and would create a clear regulatory framework for crypto, this would function through the U.S Securities and Exchange Comission and Commodity Futures Trading Commission will regulate the crypto space. Digital asset firms would also have to provide retail financial disclosures and separate corporate from customer funds. More than likely in a nod to the collapse that FTX brought about for money when the company took advantage and started using customer funds.
📊 Overall these bills and acts alongside the CBDC bill would be a significant change for the digital asset space and give much more clarity for Institutions further allowing more money to enter the space basically.
Reference:
www.coindesk.com
www.theblock.co
📊 XRP itself will be impact by these changes just like the rest of the space with some digital assets making significant jumps or declines based on what bills and changes are ultimately decided so it's a crazy week to say in the least. For Technical I've added a chart below for reference:
📊 Can see how we're facing that horizontal level of resistance at $3.10 now, gonna set an alert for that but more than anything, right now what's gonna make or break things will be the news, we've already seen how much that's done us the last few weeks, grateful and blessed for it as always.
📊 Main thing now is to keep an eye on the news and watch that $3.10 level for resistance or a further breakout. We've also converged with our 200 EMA on the 3 minute chart so no doubt we'll see bulls and bears fight to break or keep that point. Should be an interesting next few days.
📊 Have to go study but as always, grateful for the continued support and those that take the time to read through these and continue with me on this journey, it's taken a few years but things are coming together finally, grateful we've perservered.
Best regards,
~ Rock '
Dirty Little Crypto World: Episode 1 🚩🔍 Dirty Little Crypto World: Episode 1 – Built for Beginners, Designed to Drain 🧠💥
I've called some BIG red-flagged ones before:
FTX: ( i will post proof in the comments)
Luna:
— both collapsed, and I said it before the smoke hit the screen.
But this time, the 'smoke' moved differently:
The market was pumping — and then came the thick, dark distraction of Pump.fun .☁️🧨
That’s why I posted my trades:
Long on real assets like ETH, DOGE, OP, SEI, SUI, HBAR etc etc —
Short on the smoke screen — the Pump.NoFun thing.
(trades i posted are small positions, trading leverage leads to losing money. do not trade unless you are experienced) ⚠️
Because while legitimate projects were finally gaining momentum , this launch was perfectly timed to suck attention and liquidity away from real value .🧬💸
🧪😤Recently I launched a token.
🧘♂️📊For years, I’ve traded thousands.
Now I understand the mechanics from the inside — and what I see isn’t innovation.
It’s exploitation. 🚫
This is Episode 1 of Dirty Little Crypto World — a 10-part series where we ask:
“Are we building the future — or destroying it?” 🔥💣
🧼 The PUMP.FUN Problem
At first glance, it looks fun. Quick. Easy. 🎉📲👻
But look closer:
🚩 PEG 18-rated app🧒🔞
🚩 “Launch a coin in 1 click”🤡
🚩 114 markets overnight on top CEXs (wow!! congrats, exchanges. Safu, Bravo🏦)
🚩 Buggy, unresponsive trading UI (it’s called SLIPPAGE/bad market execution to say it right , kiddos!)🐢💀
🚩 No team transparency — just meme avatars & chaos energy. 🎭
🚩 Built on Solana with zero accountability, no docs, no disclosures🧾❌
The Worst Part?
This system is built for children .🧒🕹️🤢🤢🤢
For beginners.
For untrained, unprotected traders who get chewed up by slippage, stealth taxes, and emotional manipulation. These kids ain't gonna be scientists, these kids will end up being scammers😞- or in the best case scenario they will be spending a lot of time in McDonalds🍟🧢.
It’s not just technical abuse.
It’s psychological warfare. 🎯🧠
SAD!!
This isn’t decentralization .
This isn’t crypto’s promise .
This isn’t adoption , nor 'memefication' .
This is the casinoization of the blockchain 🎰🔥🧨 — and we’re letting it shape our future?
The Big Question:
Are we going to use crypto to uplift humanity?🌍🚀
Or…
Are we going to let it become a weapon of distraction , addiction, and destruction —
especially for the next generation? 🎮📉🧒
Because right now, the answer’s looking ugly . (😖BFU!)
🔥 This Series Exists for One Reason:
We deserve better crypto. 💙🔧
Not because we’re bitter.
Because we’ve seen what it could be.
Because we’ve already paid the price.
Because the GOOD SIDE of crypto MUST prevail.🛡️🧬
💬 Harsh? Maybe.
But wait for Episodes 2, 3, 4…
Because I’ve got 10 truths lined up that need to be heard. Loudly. 📢📊
I’m not here to tear things down —
I’m here to ask you to join me and clean things up .🧽🧼
Unfortunately we need to deal with some serious s**t my friends, but we can make it!
One Love,
The FXPROFESSOR 💙
Disclosure: I am happy to be part of the Good side of Crypto where humanity goes forward and not downwards. Let's Fight for it.

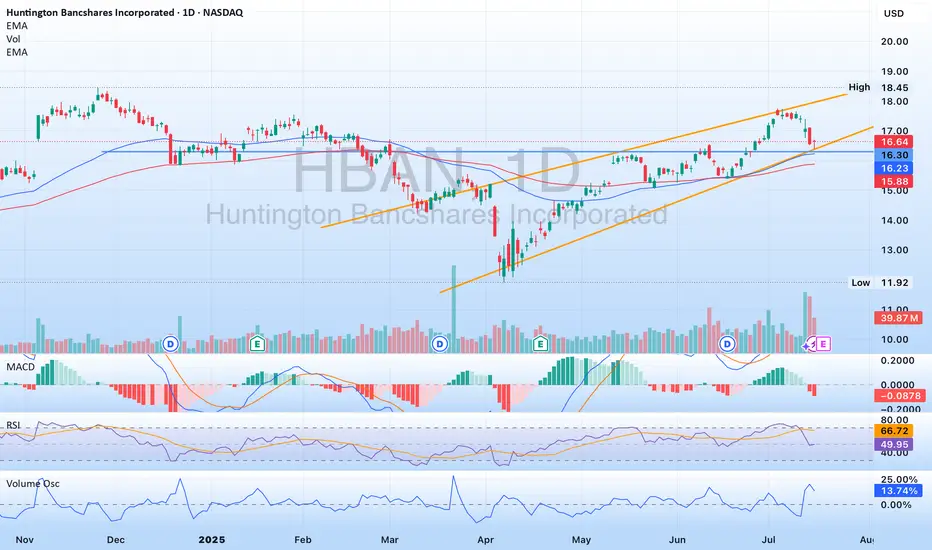
$HBAN - well positioned to continue on its pathNASDAQ:HBAN has been in a rising channel since April, and is no touching the lower band of the channel. His area also includes some previous resistance turned support, as well as some movement paces. NASDAQ:HBAN recently announced they are acquiring Veritex ( NASDAQ:VBTX ) which will strengthen their mark in Texas. Please note NASDAQ:HBAN is releasing earnings July 18th. A good report should see the stock moving towards the upper band of the channel, maybe break through it.
USDJPY (Daily Update) 17/07hi everyone as we yesterdays video is pretty much showing us whats happened today i did not go in as much detail but hopefully this video you find helpful. as always happy trading

DIYWallSt Trade Journal: How I Navigated Powell Firing Rumors & 07/16/25 Trade Journal, and ES_F Stock Market analysis
EOD accountability report: +428.75
Sleep: 7 hours
Overall health: Good
VX Algo System Signals from (9:30am to 2pm)
— 4:17 AM Market Structure flipped bullish
— 9:50 AM Market Structure flipped bearish
— 12:00 PM VXAlgo NQ X3 Buy Signal
— 1:02 PMMarket Structure flipped bullish
What’s are some news or takeaway from today? and What major news or event impacted the market today?
Today was a crazy trading day with a bunch of wild moves because Trump said they were going to fire Powell and then cancelled the threat.
Overall health and sleep have been good this week and our trading balance is reflecting that.
News
— 10:30 AM *SCOTT BESSENT: “FORMAL PROCESS” TO REPLACE FED CHAIR POWELL UNDERWAY
— 12:11 PM
*TRUMP ASKED IF HE WILL FIRE POWELL: NOT PLANNING ON DOING ANYTHING
What are the critical support levels to watch?
--> Above 6290= Bullish, Under 6280= Bearish
Video Recaps -->https://www.tradingview.com/u/WallSt007/#published-charts

Trump v Powell: Round 6A day that looked like it was drifting into a 'summer lull' kind of day, suddenly had bouts of volatility when the TRUMP / POWELL SAGA re-emerged. Which is making it difficult to hold an opinion at the moment. If the president wins the battle and the FED cut rates more than expected, the USD (should) weaken. If Mr Powell (and the FED board) remain steadfast and keep the wait and see narrative, the USD (should) remain bouyed.
Yesterday's AUD JPY trade stopped out when the market ultimately decided the data didn't move the dial for potential rate cuts. It turned out that 'USD JPY long' would have been the optimal trade. And that's the risk you take when placing a trade 'post data' but 'pre US open'.
Of course, the risk to waiting for the US open is that the opportunity could have passed. It's a conundrum I don't think will ever have a clear answer.
Ultimately, I don't regret yesterday's trade given the information I had at that moment.
Inflation remains 'sticky' in the UK and a lot of emphasis is being put on Thursday's employment data. A 'soft' number will put the BOE in a bind of needing rate cuts to stimulate the economy, but unable to cut due to high inflation.
We also have upcoming AUD employment data, an improvement on last month is forecast, which should see the RBA remain hawkish. And I continue to hold my view that 'fundamentally' AUD JPY long is a good trade. It's just a case of waiting for the right moment. I have read that this week's JPY strength could be attributed to profit taking following recent weakness and ahead of elections in Japan this coming weekend.
Currently, it's a case of staying patient, maintaing a narrative. And trade when you feel like momentum backs up bias. If you only feel comfortable with a 1.2:1 risk reward, I would suggest that could be wise for the time being.
Tricky times, please feel free offervthoughtd or questions:

7/17: Key Support for Gold Bulls at 3343–3337During the Asian session today, gold rose as expected into the 3337–3343 resistance zone. After failing to break through, the price retraced during the European and U.S. sessions, reaching the 3323–3313 support area. A sharp rally followed due to unexpected news, pushing the price into the 3372–3378 resistance zone. Overall, the intraday bullish strategy performed well, yielding solid profits.
After this sharp volatility, price movement has stabilized somewhat. The MA60 support on the daily chart remains intact.
For tomorrow’s trading, key levels to watch are:
🔽 Support: 3343–3337, with secondary support at 3328–3323
🔼 Resistance: 3372–3378
On the 2-hour chart, bullish momentum appears likely to continue as long as price holds above the support zone.
Additionally, upcoming economic data releases and any further developments on the report regarding Trump potentially firing Powell could have a significant impact on market sentiment—these factors should be closely monitored.
In summary, tomorrow’s initial trading focus can remain within the 3337–3358 range, with strategies adjusted as market conditions evolve.
fuboTV $5.00 price target Positive Divergence Multi time frameMy trade on fuboTV has a $5.00 price target. With positive divergence multiple time frames 15,1hr, 4hr. An RSI scoop where the hrly RSI with a length setting of 36 shows upward momentum? The Chande momentum oscillator with a setting of 24 indicates the price may not stall at $4.50.

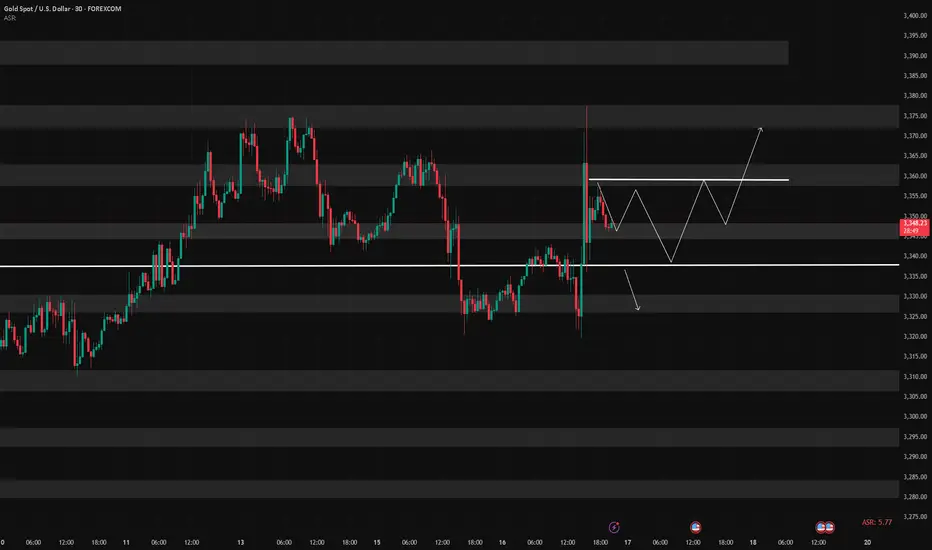
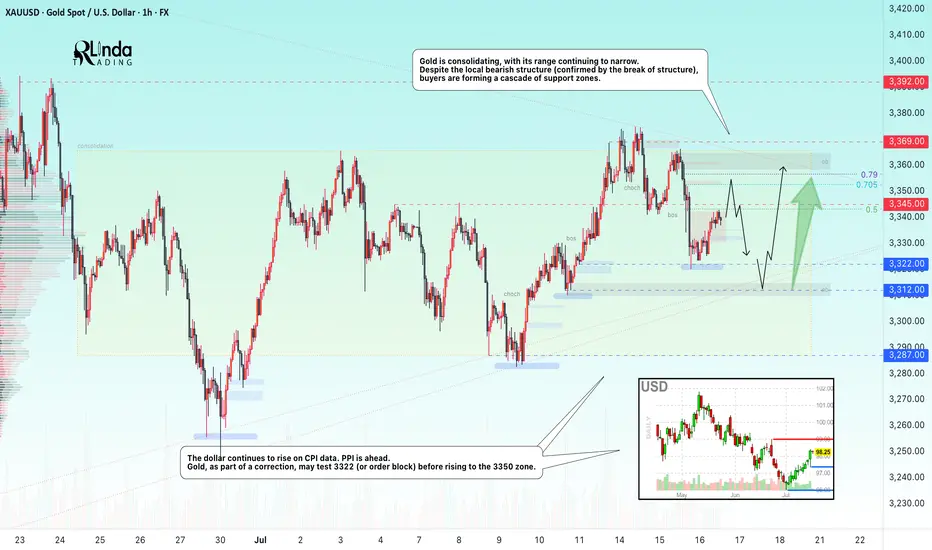
GOLD → Borders are shrinking. Consolidation continues...FX:XAUUSD is adjusting amid controversial CPI data and confirming the local bearish market structure. The PPI is ahead, and gold is consolidating, with its boundaries continuing to narrow...
Gold is recovering slightly but remains under pressure amid rising bond yields and a stronger US dollar. Higher inflation in the US reduces the chances of a quick Fed rate cut. Traders are cautious ahead of the PPI data release. If producer inflation exceeds forecasts, the dollar may rise again, putting further pressure on gold
Technically, we see consolidation in a symmetrical triangle pattern. Trading within the consolidation has a negative side - low volatility and unpredictable movements. The purpose of such movements is accumulation. However, decisions can be made based on relatively strong levels. In the current situation, we are seeing a rebound from 0.5 Fibonacci (I do not rule out a retest of the 0.7 zone before correction). The price may head towards the liquidity zone of 3322 before rising to the upper boundary of the consolidation and the zone of interest of 3350-3360.
Resistance levels: 3345, 3353, 3369
Support levels: 3322, 3312, 3287
The problem is that the price is in a consolidation phase. That is, technically, it is standing still and moving between local levels. You can trade relative to the indicated levels. Focus on PPI data. At the moment, gold is in the middle of a triangle and is likely to continue trading within the boundaries of a narrowing channel due to uncertainty...
Best regards, R. Linda!
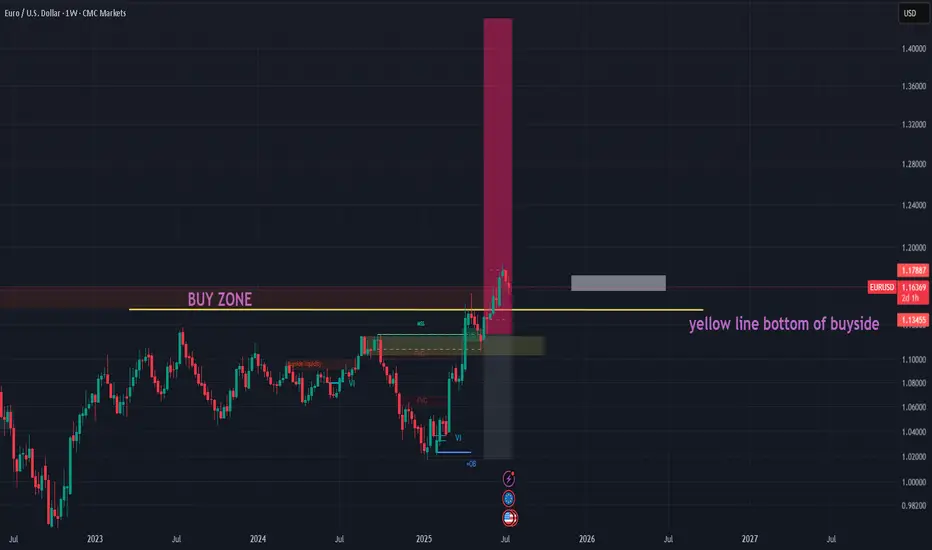
EURUSD BUY IDEA SWING PLAY (WEEKLY) Outlook🔁 EUR/USD Long – Weekly Buyside Re-Test for 1.17 Breakout 🌍📈
Description:
EUR/USD is retesting a weekly buyside liquidity zone between 1.1575–1.1600, which previously acted as strong resistance and has now flipped into support. This zone aligns with a confluence of breakout structure, Fibonacci mid-point, and a clean liquidity sweep beneath local lows.
📉 Trade Setup:
Entry Zone: 1.1475–1.1600 (buyside retest)
Stop Loss: 1.1400 Zone (risker)
Safer stop: use chart
Target 1: 1.1777
Target 2: 1.1877
Target 3: Open(manage)
Risk-Reward: ~1:3+ depending on entry precision
Trade Type: Swing / Trend Continuation
📊 Technical Bias:
Weekly structure flipped bullish after breakout above 1.1575
Daily shows clean HH/HL sequence with strong momentum
RSI/MACD favor continuation with no divergence yet
DXY weakness supports continuation move
🧠 Macro + Sentiment Overlay:
EUR supported by improving Eurozone data + reduced ECB dovishness
Fed pause expectations + soft US CPI drive USD weakness
Retail sentiment shows most traders are short EUR/USD — contrarian bullish
⏳ Patience:
Let price stabilize in the 1.1575–1.1600 zone with a bullish engulfing or H4 reversal signal before execution. Structure invalidation below 1.1530.
$GBIRYY - U.K Inflation Rises to a 2024 High (June/2025)ECONOMICS:GBIRYY
June/2025
source: Office for National Statistics
- The annual inflation rate in the UK rose to 3.6% in June, the highest since January 2024, up from 3.4% in May and above expectations that it would remain unchanged.
The main upward pressure came from transport prices, mostly motor fuel costs, airfares, rail fares and maintenance and repair of personal transport equipment.
On the other hand, services inflation remained steady at 4.7%.
Meanwhile, core inflation also accelerated, with the annual rate reaching 3.7%.

Major Breakout– Ethereum Broke Free from 'Clashing Resistances'🚀💥 Major Breakout – Ethereum Broke Free from the Clashing Resistances 🔓🟣
ETH has finally done it.
After months of battling overlapping resistances — the Clashing Stones, as we called them — Ethereum has broken out, and $2,912 is now acting as support, not resistance.
This breakout isn't just technical, it’s structural.
The previous 1-2-3 rejection setup has now been invalidated.
🔎 Chart Summary:
✅ $2,912 = confirmed breakout zone
🎯 Destination 1: $4,881 (if Vitalik’s asleep 😴)
🚀 Destination 2: $6,443 (if he wakes up 💡)
🔭 Scroll up for Destination 3
This is the real ETH breakout we’ve waited for — not hopium, not chop. This is clear structure.
If BTC stabilizes near 114,921+, ETH could enter outperformance mode and gain serious traction on the ETH/BTC chart.
📢 Keep your eyes on narrative catalysts:
ETH ETF, L2 growth, and Vitalik waking up...
We are officially off the resistance — and heading to where few have charted before.
One Love,
The FXPROFESSOR 💙
📌 Long — as long as $2,912 holds. If it fails, you already know what to do.
Disclosure: I am happy to be part of the Trade Nation's Influencer program and receive a monthly fee for using their TradingView charts in my analysis. Awesome broker, where the trader really comes first! 🌟🤝📈

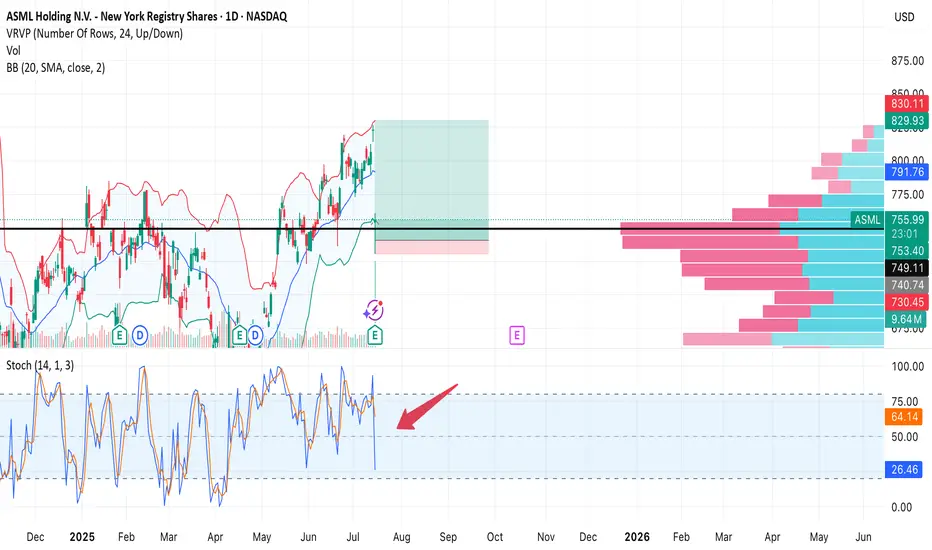
ASML — Strong earnings, sharp drop on profit-taking. Second chanAfter a strong quarterly report, NASDAQ:ASML stock initially surged, but then dropped -7.6% in a single session. Most likely due to profit-taking and a broader tech sector correction. Still, the key $754 support held, and the uptrend remains intact.
Trade Setup:
• Buy Zone: $754–760 (on retest)
• Target: $849 (+12%)
• Stop Loss: $730 (below support and volume shelf)
• Risk/Reward: 1:8
Earnings were great, fundamentals are solid. This drop could be a shakeout before continuation. As long as $754 holds, bulls have a second chance.
Litecoin: Major Expansion or Still Too Early?Price Action & Key Zones
Litecoin COINBASE:LTCUSD BINANCE:LTCUSDT continues to move within a multi-year consolidation range. The monthly chart clearly shows the range that has held since 2022. Key levels to watch:
Resistance at 145–150 USD — a key seller zone that has repeatedly acted as a reversal area.
Zone 150–180 USD — monthly imbalance, likely to serve as major resistance on breakout.
Range 195–270 USD — bearish order blocks, which will also act as overhead resistance.
On both monthly and weekly timeframes, LTC appears to be in a phase of accumulation or reaccumulation. A breakout from this structure will likely take time.
Wave Analysis: Two Scenarios
1. Base scenario : LTC is still forming a contracting triangle. Currently, it is developing wave D, which should test the monthly imbalance in the 150–180 range. After that, a correction in wave E (bearish phase) is expected, followed by a potential upward impulse.
2. Alternative scenario : the triangle is already complete, with wave E having formed at $62 in December 2024. A new upward expansion has begun. However, this version is not supported by the triangle’s geometry — none of its sides align with the 0.618 Fibonacci ratio. Also, proper distribution in such cases typically takes at least 6 months, and BTC might not have that much time left in its cycle.
Therefore, I stick with the base scenario: LTC is still in the accumulation phase.
Targets & Timing
Near-term targets: $107 → $128 → $147 (December high).
Maximum target for this cycle — $180, where a major reversal or distribution may occur.
On the 4H chart, a 5-wave impulse structure formed from April to May (likely wave A), followed by a sharp correction. Currently, wave C appears to be unfolding, and based on Fibonacci extensions, it could reach between $128 and $180.
Fundamental Drivers for Growth:
1. Litecoin remains a reliable payment network, offering fast transactions and low fees — often referred to as “digital silver.”
2. LTC mining is synchronized with BTC, making it a logical choice for certain miners.
3. In many regions, LTC is actively used for cross-border transfers and capital movement.
4. Undervalued compared to other altcoins, with no centralization concerns or SEC scrutiny — this could attract more institutional interest.
5. ETF Potential: after BTC and ETH, Litecoin could be the next natural candidate for a spot ETF. If approved, this could trigger a significant surge in interest and liquidity.

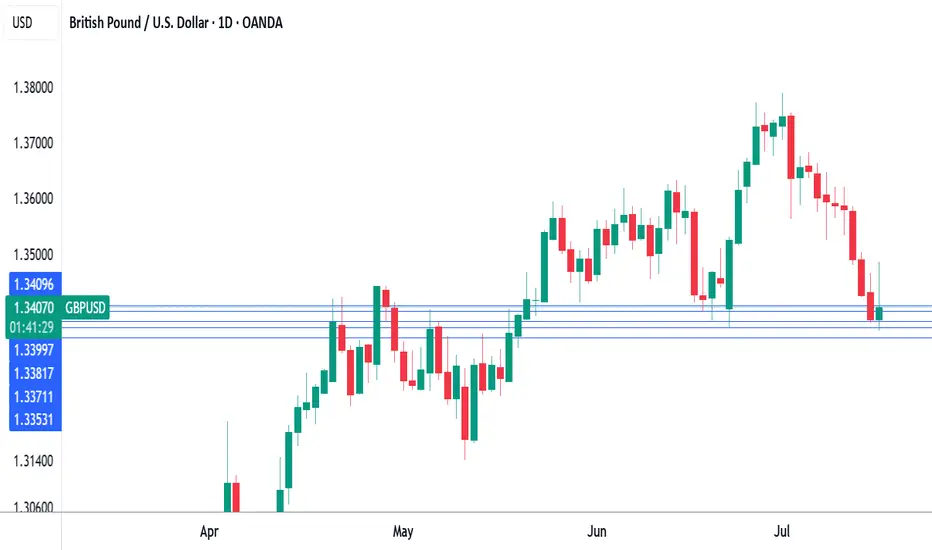
UK inflation heats up, Pound shrugsThe British pound has stabilized on Wednesday and is trading at 1.3389 in the European session, up 0.07% on the day. This follows a four-day losing streak in which GBP/USD dropped 1.5%. On Tuesday, the pound fell as low as 1.3378, its lowest level since June 23.
Today's UK inflation report brought news that the Bank of England would have preferred not to hear. UK inflation in June jumped to 3.6% y/y, up from 3.4% in May and above the market estimate of 3.4%. This was the highest level since January 2024 and is a stark reminder that inflation is far from being beaten. The main drivers of inflation were higher food and transport prices. Services inflation, which has been persistently high, remained steady at 4.7%. Monthly, CPI ticked up to 0.3% from 0.2%, above the market estimate of 0.2%.
It was a similar story for core CPI, which rose to 3.7% y/y from 3.5% in May, above the market estimate of 3.5%. Monthly, core CPI climbed 0.4%, above 0.2% which was also the market estimate.
The hot inflation report will make it more difficult for the BoE to lower interest rates and the money markets have responded by paring expectations of further rate cuts. Still, expectations are that the BoE will cut rates at the August 7 meeting, with a probability of around 80%, despite today’s higher-than-expected inflation numbers.
The UK releases wage growth on Thursday, which is the final tier-1 event prior to the August meeting. Wage growth has been trending lower in recent months and if that continues in the May reading, that could cement an August rate cut.
Xrp - The final bullish breakout!💰Xrp ( CRYPTO:XRPUSD ) will create new all time highs:
🔎Analysis summary:
After a consolidation of an incredible seven years, Xrp is finally about to create new all time highs. With this monthly candle of +40%, bulls are totally taking over control, which means that an altcoin season is likely to happen. And the major winner will simply be our lovely coin of Xrp.
📝Levels to watch:
$3.0
🙏🏻#LONGTERMVISION
SwingTraderPhil
