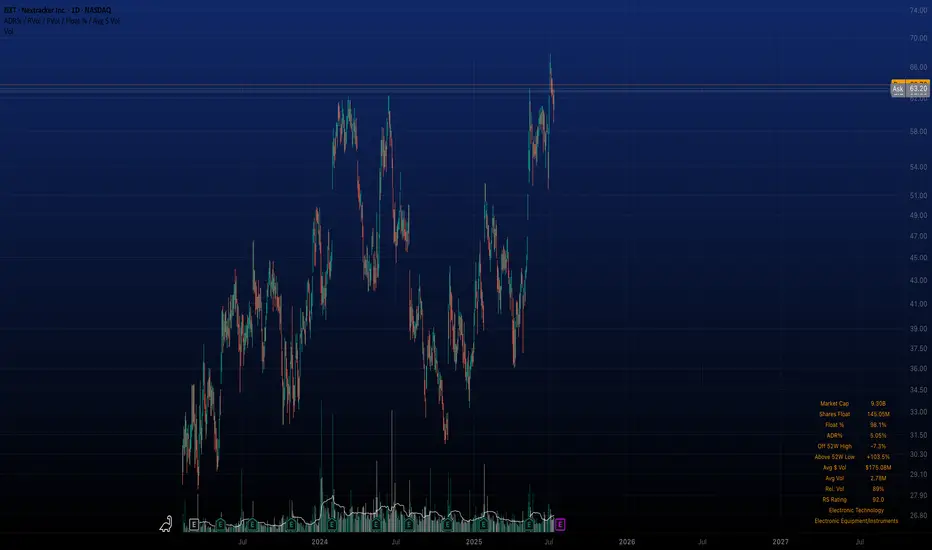
The Case for Solar Tracker Infrastructure (NXT) NASDAQ:NXT
THE CONCEPT
Superficially, the solar infrastructure sector appears to be just another subset of the cyclical renewable energy market, heavily influenced by commodity pricing, subsidies, and Chinese overcapacity. This view, while partially accurate, overlooks a deeper dynamic now unfolding in the utility-scale solar ecosystem: the emergence of solar trackers, specifically Nextracker (NXT), as a default layer of infrastructure that enhances energy yield, drives project economics, and becomes essential to capturing IRR in large-scale solar development.
The true attraction of companies like NXT lies not in their participation in the solar value chain but in their ability to compound earnings by becoming the default standard in project infrastructure. As utility developers increasingly seek higher ROI and shorter time-to-completion, tracker systems with proven yield enhancements and robust reliability are becoming indispensable. What began as a technological upgrade is now evolving into an infrastructure platform with software-defined margins, long product lifecycles, and embedded switching costs.
If this dynamic is recognized by investors, NXT may undergo a valuation re-rating, as happened with other asset-light infrastructure providers in the past. The process is potentially self-reinforcing: tracker adoption increases → project IRRs improve → developers standardize on proven providers → NXT backlog and margins grow → investor recognition expands → valuation multiple rises → NXT scales further, increasing its data advantage and competitive moat.
ANALYTICAL APPROACH
The conventional method of evaluating solar-linked equities—projecting demand growth for solar installations and then applying a valuation multiple based on cyclical earnings—is insufficient in this case. NXT’s trajectory is not merely a function of solar penetration; it depends critically on its ability to convert adoption into infrastructure entrenchment. The valuation multiple itself reflects investor understanding of this transition.
Instead of isolating earnings and then applying an arbitrary multiple, we analyze the self-reinforcing process of tracker adoption, profitability, and recognition. We identify three interlocking drivers:
The effective return on solar projects equipped with tracker systems
The penetration rate of trackers in utility-scale solar globally
Investor recognition of NXT as a long-term infrastructure platform rather than a cyclical solar component supplier
THE SCENARIO
Act One: The Emergence of the Infra Layer (2023–2025)
At present, the effective return on utility-scale solar projects is entering a new phase. While panel prices continue to decline due to Chinese oversupply (falling below $0.16/W in the U.S.), project economics are improving due to two compounding forces: rising electricity demand (particularly from AI, EVs, and data centers) and software-enhanced yield optimization from tracker platforms.
NXT's tracker systems, enhanced by machine-learning algorithms like TrueCapture, are capable of increasing energy yield by 15–25%, a material change in IRR for developers. Meanwhile, the total cost of tracker systems has declined enough to reach mass adoption thresholds, especially in markets like the U.S., where NXT holds a 57% share. Tracker usage in new U.S. projects now exceeds 95%, while global adoption is climbing from 40–45%.
Investor recognition is still partial; NXT trades at ~15x earnings despite 30% EPS growth and a $4.5B backlog. The process has just begun, but the initial indicators of self-reinforcing dynamics are visible.
Act Two: Recognition and Rerating (2025–2027)
As demand for electricity continues to grow and renewable installations scale with it, tracker systems become default components in new builds. Developers now see tracker-equipped plants as the norm, not an upgrade. Projects from 2025 onward increasingly retroactively upgrade from fixed-mount systems.
Investors begin to grasp the role of NXT as a high-margin infrastructure provider. The shift in narrative—from cyclical solar to embedded utility infrastructure—leads to a re-rating. Price-to-earnings multiples begin to reflect platform-like characteristics: recurring software revenue, long product cycles, data network effects, and entrenched customer relationships. The company’s moat, built on both hardware reliability (30-year durability) and proprietary software trained on years of operational solar data, becomes widely recognized.
Investor multiples compress slightly to reflect maturity but remain above historical solar averages due to sticky revenue, data leverage, and infrastructure resilience.
EVALUATION
The shakeout is still years away. Until then, NXT is positioned to benefit from a global shift in energy infrastructure. The real risk at present is not from saturation but from investor miscategorization. If NXT continues to be treated as a cyclical solar stock, it may remain undervalued despite strong fundamentals and compelling growth.
The key vulnerability lies in the macro environment. Should global renewable demand stall due to policy reversals (e.g., rollback of IRA credits), or should Chinese entrants successfully replicate NXT’s software and reliability at scale, the thesis may weaken. However, even in such cases, the cost structure of tracker-enhanced solar remains globally competitive, and NXT’s backlog and historical performance offer downside protection.
Yet, it must be acknowledged that current market sentiment favors nuclear-related equities, driven by political narratives of energy security and bipartisan support for nuclear expansion. Nuclear stocks are being re-rated on the expectation of long-term baseload reliability, even though their LCOE remains higher and their construction timelines are far longer than utility-scale solar. This sentiment bias may delay investor recognition of NXT’s strategic role as an infrastructure platform.
If the self-reinforcing process plays out as expected, NXT could deliver the compound benefits of scale, margin expansion, and multiple re-rating. The capital appreciation potential mirrors the early phases of other infrastructure transitions—cable, fiber, datacenter REITs—where early recognition translated into multiyear equity outperformance.
Fundamental Analysis
USD/CHF on the rise!The recent rebound of the US dollar has led to a decline in the Swiss franc against it, similar to other major currencies. The US dollar is also expected to show further strength in the coming period, supported by recent positive economic data, most notably, and the annual Consumer Price Index (CPI) - which came in at 2.7%, the highest reading in the last four releases.
This last CPI reading holds particular significance, as the Federal Reserve (Fed) is closely watching it, especially with expectations that the impact of tariffs may start to appear from this and the next reading.
Positive inflation data and a stable labor market give the Fed the flexibility to maintain steady interest rates in the near term, which could support further USD strength. The impact of all this economic data is expected to diminish as we approach August 1, the date when tariffs are set to resume, according to US President Donald Trump.
The world is closely watching how the tariff issue will unfold and whether trade agreements will be reached before that date. All of this directly affects global markets and the US dollar. For these reasons, traders should closely monitor the news, as developments are rapidly changing and appear daily, especially statements from the US President regarding tariffs.
Technical outlook
From a technical perspective, the USD/CHF pair is trading in an uptrend on the 4-hour chart. Its recent pullback to the 0.79419 level is considered corrective, with the uptrend likely to resume and target the 0.79997 level.
However, if the price drops below the 0.79193 level and forms a lower low on the 4-hour chart, this would signal a trend reversal from bullish to bearish, invalidating the bullish scenario mentioned above.

GBPJPYSell. Market Execution. trade 1:2. risk 0.50%
Enter in Sell because Market retest Seller's Zone.


CHZ (Chiliz) Analysis – July 15, 2025 Since breaking above the $0.03 level back in 2021,
CHZ surged to nearly $0.80, recording an impressive 3,500% gain.
🧠 This move indicates that major investors entered at lower levels,
while short-term holders who bought higher have been taking profits on every price rally,
effectively capping further upside momentum in the past.
Now, after 4 years, the price has returned to the $0.03 zone — a historically significant area that marked the start of the previous bull run.
🎯 A minimum 100% upside from this level is quite reasonable,
targeting around $0.08 in the short to medium term.
✅ For more impatient investors seeking faster exits,
$0.05 can be considered an optimal short-term take-profit level.

Sei Analysis – July 15, 2025
Sei appears to be forming a clear classic corrective pattern.
After rallying from $0.09 to $1.10,
it seems to have completed its correction through two downward legs.
🔁 The recent price action shows a bullish reaction near the previous low,
suggesting that Sei might now be in a strong accumulation zone.
📌 For a more conservative entry, waiting for price to approach $0.25 could provide a better risk/reward setup.
🎯 With a confirmed rebound, a move toward the $1.12 level — roughly a 300% gain — becomes a realistic target.

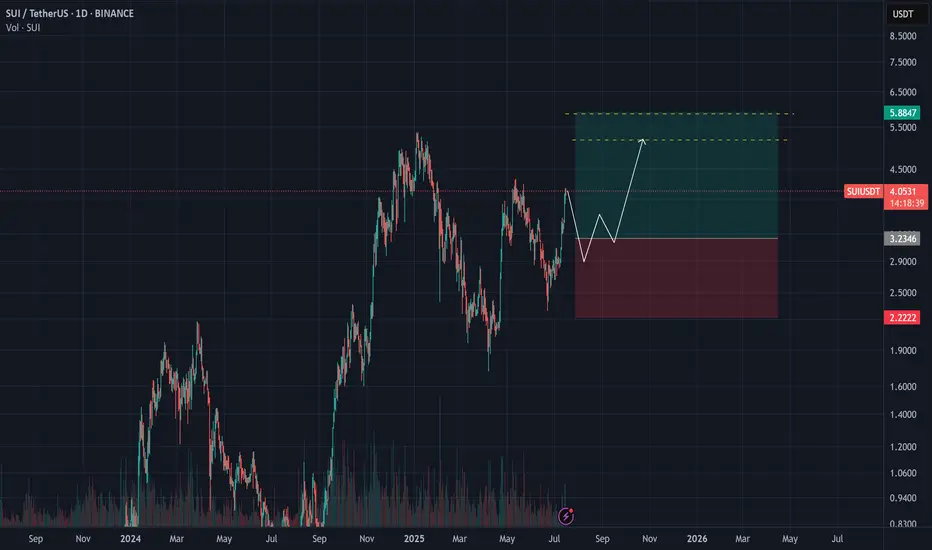
SUI Analysis – July 15, 2025
SUI appears to have entered its bullish phase slightly earlier than most other altcoins.
This move seems to be fueled by a number of key partnerships and contracts signed over the past six months — a fundamentally positive signal.
📊 However, based on the current chart structure,
entering at this level may not be the most attractive opportunity.
✅ While a short-term 20% upside could be possible,
it’s more prudent to wait for price to test its previous high,
and observe how investors react to that resistance zone.
Their behavior will offer clearer insight into whether a continuation or correction is likely.
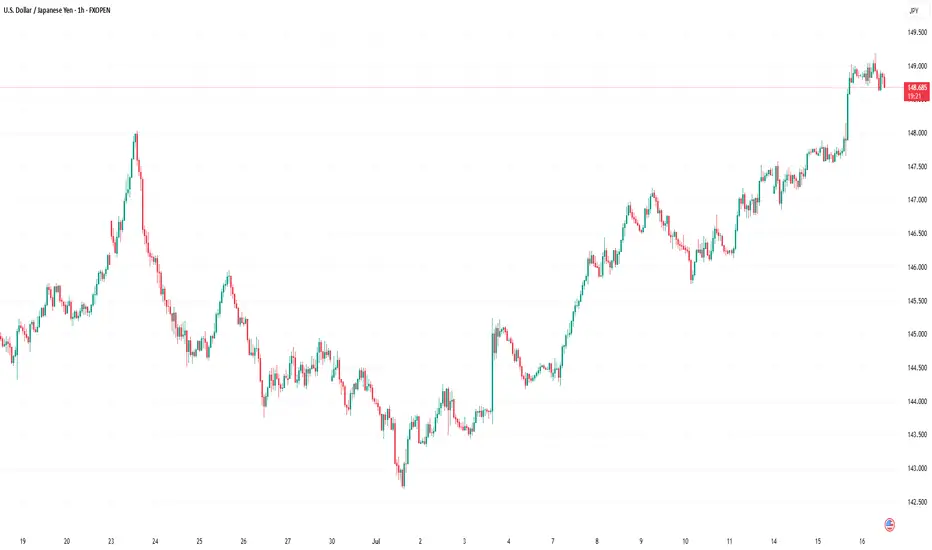
Market Analysis: USD/JPY RisesMarket Analysis: USD/JPY Rises
USD/JPY is rising and might gain pace above the 149.20 resistance.
Important Takeaways for USD/JPY Analysis Today
- USD/JPY climbed higher above the 147.50 and 148.40 levels.
- There is a key bullish trend line forming with support at 148.40 on the hourly chart at FXOpen.
USD/JPY Technical Analysis
On the hourly chart of USD/JPY at FXOpen, the pair started a fresh upward move from the 145.75 zone. The US Dollar gained bullish momentum above 146.55 against the Japanese Yen.
It even cleared the 50-hour simple moving average and 148.00. The pair climbed above 149.00 and traded as high as 149.18. The pair is now consolidating gains above the 23.6% Fib retracement level of the upward move from the 145.74 swing low to the 149.18 high.
The current price action above the 148.50 level is positive. There is also a key bullish trend line forming with support at 148.40. Immediate resistance on the USD/JPY chart is near 149.20.
The first major resistance is near 149.50. If there is a close above the 149.50 level and the RSI moves above 70, the pair could rise toward 150.50. The next major resistance is near 152.00, above which the pair could test 155.00 in the coming days.
On the downside, the first major support is 148.40 and the trend line. The next major support is visible near the 147.90 level. If there is a close below 147.90, the pair could decline steadily.
In the stated case, the pair might drop toward the 147.50 support zone and the 50% Fib retracement level of the upward move from the 145.74 swing low to the 149.18 high. The next stop for the bears may perhaps be near the 146.55 region.
This article represents the opinion of the Companies operating under the FXOpen brand only. It is not to be construed as an offer, solicitation, or recommendation with respect to products and services provided by the Companies operating under the FXOpen brand, nor is it to be considered financial advice.
XRP (Ripple) Analysis – July 15, 2025XRP has built significant liquidity between the $1.6 to $3.4 range, making a clear breakout through this zone more challenging.
📊 While a short-term breakout above this range is possible,
the presence of short-term investors likely aiming to take profits above the range increases the probability of a pullback toward the lower bound.
🎯 For a more optimal and lower-risk entry, we should wait for price action near the $2 zone.
If the market shows a strong bullish reaction from that level, it could offer a solid setup for targeting higher levels.

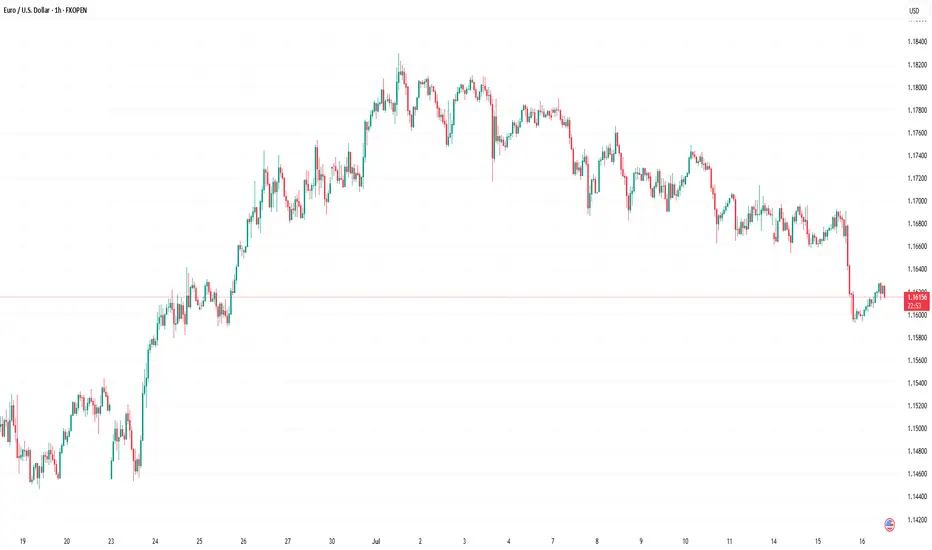
Market Analysis: EUR/USD Pares GainsMarket Analysis: EUR/USD Pares Gains
EUR/USD declined from the 1.1750 resistance and traded below 1.1650.
Important Takeaways for EUR/USD Analysis Today
- The Euro started a fresh decline after a strong surge above the 1.1720 zone.
- There is a connecting bearish trend line forming with resistance at 1.1660 on the hourly chart of EUR/USD at FXOpen.
EUR/USD Technical Analysis
On the hourly chart of EUR/USD at FXOpen, the pair rallied above the 1.1720 resistance zone before the bears appeared, as discussed in the previous analysis. The Euro started a fresh decline and traded below the 1.1660 support zone against the US Dollar.
The pair declined below 1.1620 and tested 1.1590. A low was formed near 1.1592 and the pair started a consolidation phase. There was a minor recovery wave above the 1.1610 level.
EUR/USD is now trading below the 50-hour simple moving average. On the upside, it is now facing resistance near the 1.1630 level. It is close to the 23.6% Fib retracement level of the downward move from the 1.1749 swing high to the 1.1592 low.
The next key resistance is at 1.1660 and the 50% Fib retracement level. There is also a connecting bearish trend line forming with resistance at 1.1660.
The main resistance is near the 1.1690 level. A clear move above it could send the pair toward the 1.1720 resistance. An upside break above 1.1720 could set the pace for another increase. In the stated case, the pair might rise toward 1.1750.
If not, the pair might resume its decline. The first major support on the EUR/USD chart is near 1.1590. The next key support is at 1.1550. If there is a downside break below 1.1550, the pair could drop toward 1.1520. The next support is near 1.1485, below which the pair could start a major decline.
This article represents the opinion of the Companies operating under the FXOpen brand only. It is not to be construed as an offer, solicitation, or recommendation with respect to products and services provided by the Companies operating under the FXOpen brand, nor is it to be considered financial advice.
FIL 1W – Triple Bottom, Structure Aligns for ReversalTriple bottom confirmed on weekly.
All three lows hold ~$2.20 — strong base.
EMA50 flattening. EMA100 still declining but compressing.
MACD histogram decreasing in downside momentum.
Signal lines curling toward crossover.
RSI pushing off 40 — strength emerging from oversold zone.
Volume uptick confirms interest at structural lows.
Market structure turning asymmetrical — downside tight, upside open.
Quant thesis: probabilistic edge shifting long. DCA zone remains active.

Ideas for Gold
The US dollar is gaining strength following Tuesday's CPI report, which showed a 2.7% inflation rate. This development is likely to benefit gold bears. On the chart, gold is currently trading within a range, but this could be the catalyst for a significant drop to $3300. With gold currently trading at $3340 and facing resistance, the upcoming core CPI report could further impact gold's value. If the report favors the dollar again, gold prices may decline even further.

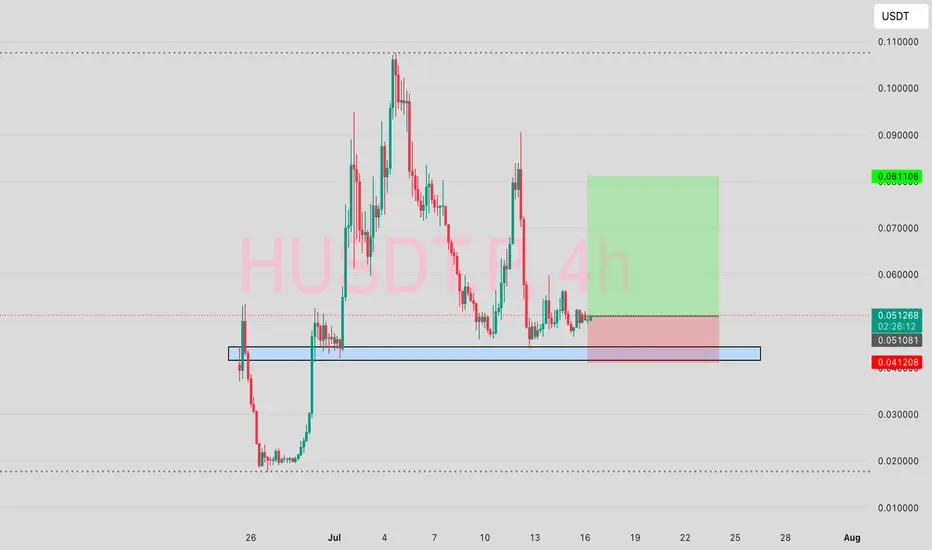
$HUSDTMy risk trade today is on BYBIT:HUSDT.P .
I trust the move to go as planned based on existing chart patterns but the percentage of risk is as high as 19.33%. The reason is not far-fetched, It's simply a new listing.
If you choose to ride this with me, apply caution ⚠️
#NFA #DYOR
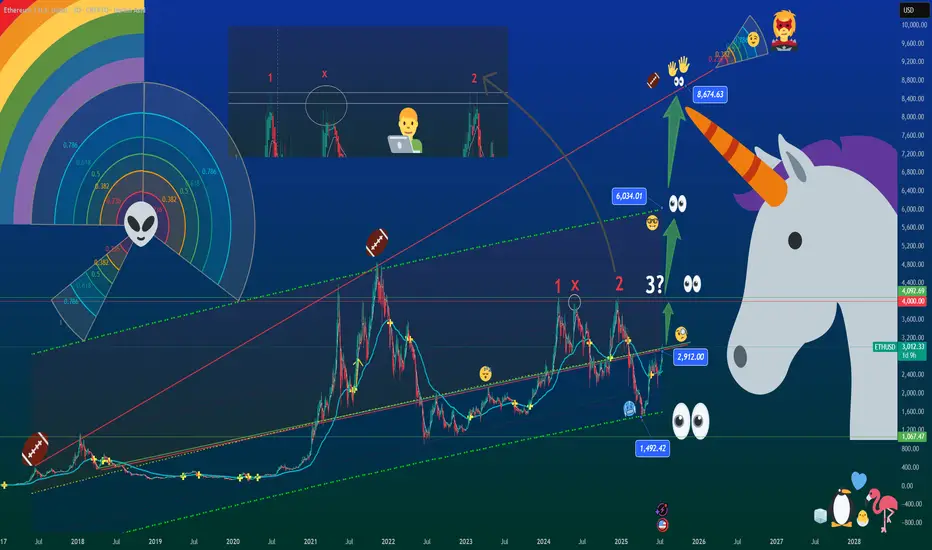
The Unicorn Breakout – Regression, Madness & Meme Math🦄 The Unicorn Breakout – Regression, Madness & Meme Math
FX_Professor | July 14, 2025
🎨 Welcome to my world…
Some draw straight lines.
I draw quadratic regression channels, alien spirals, and unicorns.
Because sometimes, the market is not just math — it’s emotion, storytelling, and madness therapy.
This chart isn’t just analysis. It’s a prophecy. It’s a canvas.
It’s for the traders who still feel.
📈 What are we looking at?
🧠 The Setup:
- Quadratic Regression Channel: Anchored from the 2018 top, respected for over 7 years. ETH is bouncing off the midline like it heard destiny calling.
- Major Resistance: The $2,900–$3,100 zone is our historic ceiling. Marked as 1 – X – 2… and next, not maybe but SURELY the decisive number3? 🚨 (X stands for 'no touch' ie 'close but no cigar' - Look at my recent BTC 1-2-3 breakout posts!)
- My Golden Cross: Quietly forming support. Check that xx/Xxx Secret EMA crossover. Setup reserved as a little family secret destined to be passed on to my sons (and some of you!).
- Alien Spiral (not Fib 😉 ): A colorful vortex leading us toward areas of re-accumulation and expansion. ETH is now riding the 0.382 arc — and you know what that means...
🚀 Targets:
- $4,000 — First milestone and zone of psychological resistance
- $6,034 — Mid-regression line + historical extension
- $8,674 — Unicorn Target Zone. Meme ATH + Euphoric breakout + Regression logic
👽 The Floor:
$1,067 – $1,492 — Alien Support Range™. If we nuke, that’s where we land, in pain. That's when we apply for jobs at Taco Bell (at least i love the food there, i am prepared for that scenario too).
🦇✨ Ethereum Community — this might be your time.
Dear ETH fam...
This isn't hopium.
This is regression math meeting Breakout Structure.
ETH has reclaimed key levels, rotated capital is flowing, and Bitcoin dominance is peaking. . WAIT FOR MY ETHBTC ANALYSIS (ON SUPPORT AND REBOUNDING)
The Unicorn doesn't knock twice.
If Ethereum Season is real — this chart might age beautifully.
🤹 Why the chaos?
Because markets are art.
Because crypto is culture. (and yes it's also 90% shit, you will hear a lot about that when that time comes).
Because every emoji here has meaning:
🦄 = Imagination
👀 = Momentum watchers
👽 = Alternative thinking
🏈 = Painful resistances, mental and physical toughness builds champions. Patience Wins!
🥶 = Cold accumulation
🧑💻 = Professor mode
🐧❤️🔥🐤🦩 = Read below…
🧊 The Penguin Message
Bottom right, you’ll see a penguin family :
A penguin, a flamingo, a baby chick, and a blue heart.
That’s not just decoration — it’s the real alpha.
💙 The best blockchain is YOU.
👶 The best altcoins are your CHILDREN.
🧊 The best staking is your FAMILY.
Trade smart. Build cool stuff. But don’t forget to be a good human.
The charts will wait. But your people won’t.
Spend time wisely: Learn skills, invest in YOURSELF, enjoy moments with loved ones, make others smile, be that change in the world.... and if you don't have kids then what on earth are you doing?? Go get laid, now! You are ready, stop thinking, just Do It (disclaimer: unless you have 5 already, in that case pls invest in condoms)
Share this with someone who needs to see this. Or just save it as 'ETH season'.
FX Professor — out.
🦄📈👁️
#ETH #Ethereum #UnicornBreakout #CryptoArt #QuadraticRegression #Altseason #TradingView #ChartTherapy #BeAGoodHuman
ARB (Arbitrum) Analysis – July 15, 2025After its listing on Binance, ARB has never revisited such low price levels.
Reaching the $0.25 zone has sparked a wave of new investors, confirmed by recent on-chain data.
It also seems that the correction pattern has completed, placing ARB in a strong position for a potential rebound.
📌 While a more conservative entry could be around $0.35,
this current level also offers strong justification for initiating a position.
🎯 Target: $0.90
🔼 That’s a potential upside of approximately 160%.
With proper risk management, this setup stands out as one of the more compelling opportunities in the current market.

HBAR Price Drop To $0.20 Likely; $53 Million Liquidation AheadBINANCE:HBARUSDT price currently sits at $0.235, encountering resistance at $0.241. Despite its recent rally, the broader market conditions are pulling it down, and the next major support level is at $0.220 . If the altcoin fails to hold above this level, it could slide towards $0.200.
Looking at the liquidation map, there is a real possibility of significant losses for $BINANCE:HBARUSDTtraders. The map shows that if the price drops to $0.20 or lower, approximately $53 million worth of long positions would be liquidated . This would create a wave of selling pressure and potentially drive the price down further.
In the event of a surge in bearish sentiment or increased selling pressure, BINANCE:HBARUSDT could fall below $0.220 , hitting the psychological support level at $0.200. A drop below this critical level would likely trigger the $53 million worth of liquidations, further exacerbating the decline.
However, if BINANCE:HBARUSDT manages to hold above $0.220 and successfully breaches the $0.241 resistance, there could be an opportunity for a rally. A successful bounce off $0.220 could push HBAR towards $0.267 , providing some relief to traders and reinforcing its bullish outlook.
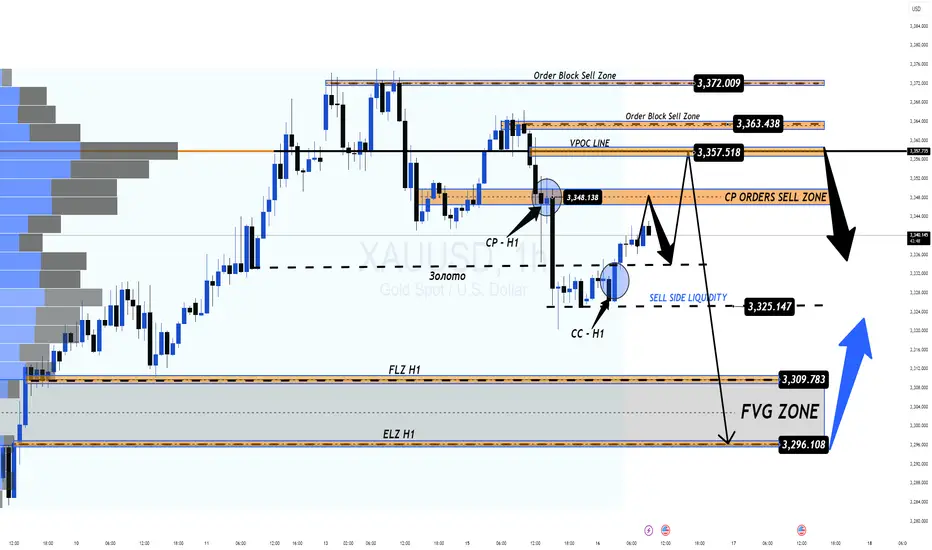
XAUUSD 16/07 – Temporary Rebound or Trap Before the Next Drop?XAUUSD 16/07 – Temporary Rebound or Trap Before the Next Drop?
🌍 Macro View – Calm Before the Volatility?
Gold is currently hovering around $3,334/oz after an aggressive sell-off earlier this week. While June's Core CPI data from the US came in lower than expected — easing immediate inflation concerns — the broader macro landscape remains far from stable:
New US tariffs are beginning to ripple through consumer prices.
Sectors like appliances and electronics are seeing early signs of inflation.
Shrinking inventories may lead to direct price pressures on consumers soon.
🔎 As the market digests these signals, gold remains a defensive play — but today's PPI release could flip sentiment quickly.
📉 Technical Outlook – Setup for a Deeper Pullback?
After CPI, gold retraced sharply and filled liquidity around 332x.
A clear Fair Value Gap (FVG) formed on the H1 chart, alongside a potential Continuation Pattern (CP) near 3347–3349.
Price action is likely to revisit the 334x–336x resistance zone, providing ideal short setups if rejection is confirmed.
🎯 Below lies a deep liquidity zone (FVG) near 3294, which could serve as the magnet for the next bearish move.
📊 Key Trade Zones to Watch
🔵 Buy Zone – Deep Liquidity Support: 3,296 – 3,294
SL: 3,290
TP: 3,300 → 3,304 → 3,308 → 3,312 → 3,316 → 3,320 → 3,330
🔴 Sell Scalp – CP Pattern Rejection: 3,347 – 3,349
SL: 3,353
TP: 3,343 → 3,340 → 3,336 → 3,330 → 3,325 → 3,320 → 3,310 → 3,300
🚨 Sell Zone – VPOC Level Resistance: 3,358 – 3,360
SL: 3,364
TP: 3,354 → 3,350 → 3,346 → 3,340 → 3,330 → 3,320 → 3,300
⚠️ What to Expect Today
All eyes are on the US PPI data, which could shake markets later in the session.
Look for a bullish fake-out during London or New York hours, especially toward 334x–336x zones.
Ideal strategy: wait for H1 candle confirmation before entering, and manage risk with clean TP/SL levels.
💬 Your Take?
Will gold revisit 329x this week, or are we setting up for a bullish reversal?
👇 Drop your thoughts in the comments and follow @MMFlowTrading for high-probability setups and macro insights — daily!
NZDCHF → Pre-breakdown consolidation on a downtrendFX:NZDCHF is forming a pre-breakout consolidation amid a downtrend. Focus on support at 0.4759. Global and local trends are down...
On July 10-11, the currency pair attempted to break out of the trend. In the chart, it looks like a resistance breakout, but technically it was a short squeeze aimed at accumulating liquidity before the fall. We can see that the price quickly returned back and the market is testing the low from which the trap formation began. The risk zone for the market is 0.4759 - 0.475. In simple terms, this is a bull trap against the backdrop of a downtrend. The NZD has passed through the risk zone. At this time, the currency pair is forming a pre-breakout consolidation relative to the support level of 0.4759 with the aim of continuing its decline.
Support levels: 0.4759, 0.4753
Resistance levels: 0.477, 0.4782
A breakout of the 0.4759 level and consolidation in the sell zone could trigger a continuation of the decline within the main and local trends.
Best regards, R. Linda!

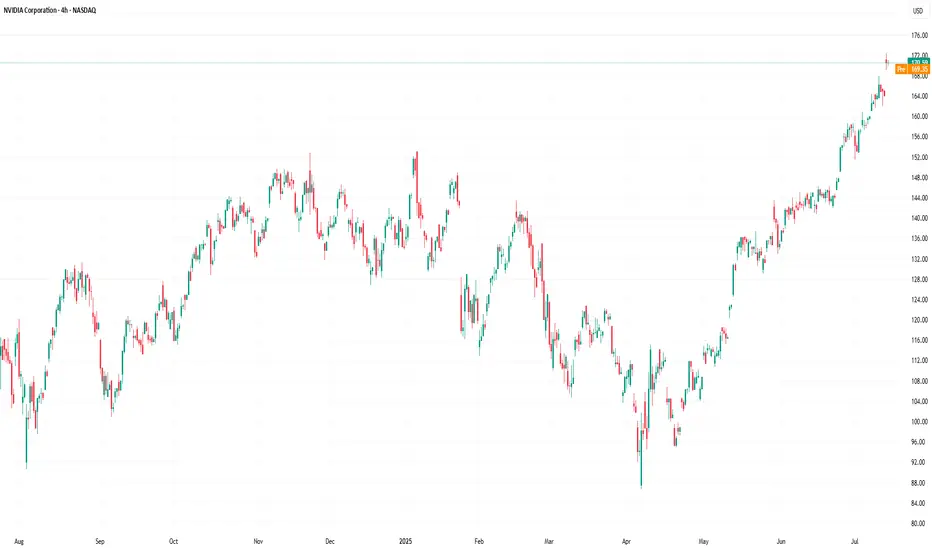
Nvidia (NVDA) Share Price Surges Above $170Nvidia (NVDA) Share Price Surges Above $170
Yesterday, Nvidia’s (NVDA) share price rose by more than 4%, with the following developments:
→ It surpassed the psychological level of $170 per share;
→ Reached another all-time high;
→ Gained more than 9% since the beginning of the month.
The bullish sentiment is driven by Nvidia CEO Jensen Huang’s visit to China shortly after meeting with US President Trump. At the same time:
→ US Secretary of Commerce Howard Lutnick stated that the planned resumption of sales of Nvidia H20 AI chips in China is part of the US negotiations on rare earth metals.
→ The head of Nvidia stated that he was assured licences would be granted very quickly, and that a large number of orders for H20 chip deliveries had already been received from Chinese companies.
Market participants are viewing the situation with strong optimism, and analysts are raising their valuations for NVDA shares:
→ Morningstar analysts raised their fair value estimate for Nvidia shares from $140 to $170.
→ Oppenheimer analysts increased their target price from $170 to $200.
Technical Analysis of the NVDA Chart
The price trajectory of NVDA shares fully reflects the exceptionally strong demand:
→ The price is moving within an ascending channel with a steep growth angle;
→ Since early May, the RSI indicator on the 4-hour chart has not fallen below the 50 level;
→ Yesterday’s trading session opened with a large bullish gap.
The chart also shows the formation of a stable bullish market structure (shown with a purple broken line), expressed through a sequence of higher highs and higher lows.
Given the above, it is difficult to imagine what might cause a sharp shift from positive to negative sentiment. If a correction begins (for example, with a test of the $160 level), traders should watch for signs of its completion — this could present an opportunity to join the emerging rally.
This article represents the opinion of the Companies operating under the FXOpen brand only. It is not to be construed as an offer, solicitation, or recommendation with respect to products and services provided by the Companies operating under the FXOpen brand, nor is it to be considered financial advice.
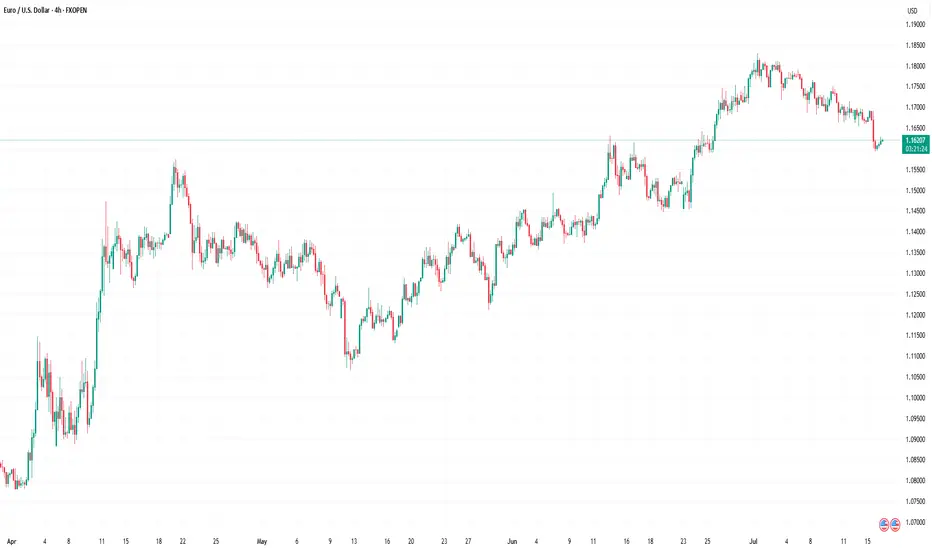
EUR/USD : US Dollar Strengthens Following Inflation ReportEUR/USD Analysis: US Dollar Strengthens Following Inflation Report
Yesterday, the US Consumer Price Index (CPI) report was released, showing an increase in consumer prices. According to Forex Factory, annual CPI rose from 2.4% to 2.7%, exceeding analysts' expectations of a 2.6% rise.
As reported by Reuters, the data supports the stance of Federal Reserve Chair Jerome Powell, who has repeatedly stated that the anticipated inflationary pressure—driven in part by tariffs—is a reason to refrain from further interest rate cuts.
However, President Donald Trump interpreted the data differently. On his Truth Social platform, he posted that consumer prices remain low and called for an immediate rate cut.
The market responded with a stronger US dollar—indicating that participants believe interest rates are likely to remain at current levels in the near term. Notably, the EUR/USD exchange rate fell to the 1.1600 level for the first time since late June (as indicated by the arrow).
Technical Analysis of the EUR/USD Chart
Analysing the EUR/USD chart as of 7 July, we identified:
→ A long-term ascending channel
→ A potential downward trajectory (marked by red lines)
Since then, the pair has followed the outlined path and declined by more than 1%.
It is worth noting that today, the EUR/USD price is near the lower boundary of a key trend channel, which may offer significant support — traders may look for a technical rebound from this level.
Additionally, attention should be paid to the upcoming release of the US Producer Price Index (PPI) at 15:30 GMT+3. These figures carry particular weight in light of potential renewed inflationary pressures. This and other upcoming data may prove decisive for the near-term direction of EUR/USD.
This article represents the opinion of the Companies operating under the FXOpen brand only. It is not to be construed as an offer, solicitation, or recommendation with respect to products and services provided by the Companies operating under the FXOpen brand, nor is it to be considered financial advice.
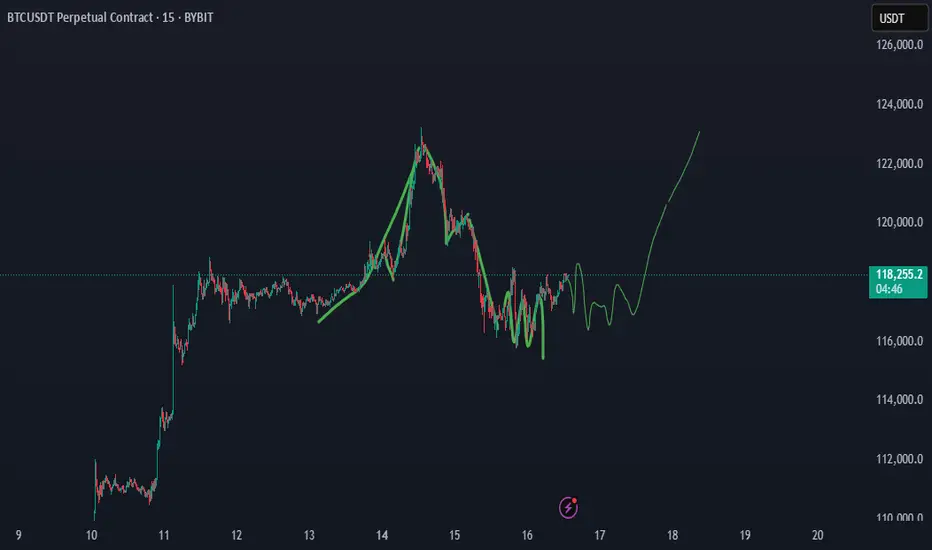
Where Is BTC Headed in the Next 7 Days?As Bitcoin (BTC) continues to dominate headlines, investors and traders are eager to understand its next move. With a current price of around $117,465 and a recent all-time high (ATH) of $122,980 on July 14, 2025, the cryptocurrency market is buzzing with excitement. Drawing from real-time data on social media platforms like X, web sources, and technical analysis, this article explores Bitcoin’s potential market direction over the next seven days, blending fundamental and sentiment insights for a comprehensive outlook. Whether you're a seasoned trader or a curious HODLer, here’s what you need to know about Bitcoin’s short-term trajectory.
Bitcoin’s Current Market Landscape
Bitcoin boasts a market capitalization of $2.34 trillion and a 24-hour trading volume of $88.63 billion as of July 16, 2025. Its market dominance stands at 62.92%, though it dipped slightly by 0.54% recently, hinting at competition from altcoins. The market is driven by strong fundamentals, including institutional adoption and supply constraints, but short-term volatility looms as traders monitor key price levels. Let’s break down the factors shaping Bitcoin’s path and forecast its movement through July 23, 2025.
Fundamental Factors Driving Bitcoin’s Momentum
Over 265 companies hold Bitcoin, with portfolios valued in the billions. Spot Bitcoin exchange-traded funds (ETFs) recorded $1.69 billion in inflows this week, reflecting strong institutional confidence in Bitcoin as a store of value.
The April 2024 halving reduced miner rewards, tightening supply—a pattern that has historically fueled bullish cycles. Analysts predict sustained upward pressure as demand grows against a constrained supply.
Bitcoin’s correlation with risk assets like the S&P 500 (0.73–0.90 in Q2 2025) underscores its role as a hedge against inflation and geopolitical uncertainty, amplified by recent U.S. policy shifts favoring crypto.
Over 95% of Bitcoin addresses are in profit, and declining exchange reserves suggest long-term holders are confident in higher prices, reducing available supply.
However, risks like profit-taking after the recent high and macroeconomic uncertainties, such as trade tensions, could introduce short-term fluctuations. These fundamentals set the stage for Bitcoin’s next moves.
Sentiment Analysis. Gauging the Market’s Mood
Market sentiment, gathered from online discussions and news, leans bullish with some cautionary undertones.
Recent analysis indicates that bearish sentiment often signals market bottoms, suggesting a potential bullish reversal. Whale accumulation amid retail uncertainty further supports optimism. Bitcoin’s sentiment score averages 82/100, with 45.49% bullish, 11.49% bearish, and 54.51% neutral commentary, reflecting high engagement.
Institutional enthusiasm, ETF inflows, and pro-crypto policy developments drive positive sentiment, particularly in the U.S. and Europe. However, concerns about price manipulation—evidenced by a +1,550% surge in related online searches—and potential profit-taking temper short-term optimism.
High trading activity during European hours (08:00–17:00 GMT) often extends Asian session trends, while weekends see increased volatility due to lower institutional participation.
The overall sentiment is bullish, with short-term bearish signals potentially creating buying opportunities for savvy investors.
Technical Analysis
Technical analysis across 15-minute (15m), 1-hour (H1), and 4-hour (H4) time frames offers insights into Bitcoin’s short-term behavior
15m and H1 Time Frames: Recent chart patterns show a rejection below $117,800, indicating a short-term bearish structure. Support lies at $115,000–$116,600, with resistance at $117,800–$118,000. Indicators like the Relative Strength Index (RSI at 68) and MACD suggest neutral momentum, with a bearish bias if Bitcoin remains below $118,000. A break below $115,000 could push prices toward $109,000–$110,000.
H4 Time Frame: The market is consolidating, with the 9-period Exponential Moving Average (EMA) catching up to price. The long-term trend remains bullish, supported by rising 50-day and 200-day moving averages. Overall, technical indicators rate Bitcoin as a “Buy,” with 13 Buy signals from moving averages and neutral oscillators, pointing to a potential retest of $120,000–$123,000 if support holds.
The charts suggest a bullish long-term trend with short-term consolidation, making support levels critical for traders.
Bitcoin Price Forecast for Next 7 Days
Synthesizing fundamental strength, sentiment trends, and technical signals, here’s Bitcoin’s likely direction by July 23, 2025
Bullish Scenario: If Bitcoin holds above the $115,000–$116,000 support zone, it could rally to $120,000–$123,000, fueled by institutional demand, ETF inflows, and positive sentiment. Rising moving averages and a bullish H4 trend support this, with analysts eyeing even higher long-term targets. A breakout above $118,000 could trigger a push toward the recent high or beyond.
Bearish Scenario: Short-term bearish signals on 15m and H1 time frames, combined with profit-taking risks, suggest a potential dip to $115,000–$116,000. A break below could target $109,000–$110,000, particularly if macroeconomic concerns or altcoin competition intensify.
Bitcoin may test $115,000–$116,000 in the next few days due to short-term bearish pressures, but strong fundamentals and bullish sentiment make a rebound to $120,000–$123,000 likely by July 23, 2025. Any pullback should be viewed as a buying opportunity, given the robust institutional and on-chain metrics.
Key Levels to Watch
Support: $115,000–$116,600 (short-term), $109,000–$110,000 (secondary)
Resistance: $117,800–$118,000 (immediate), $120,000–$123,000 (next target)
Catalysts: Keep an eye on ETF flows, macroeconomic developments (e.g., inflation, trade policies), and online sentiment for potential market shifts.
Bitcoin’s market is in a dynamic phase, balancing short-term volatility with a strong bullish foundation. Traders should monitor the $115,000–$116,000 support zone for signs of a bounce or further correction, while long-term investors can take comfort in the robust fundamentals driving Bitcoin’s growth. The next seven days could see BTC testing $120,000–$123,000 if key levels hold, though a brief dip is possible. Stay informed on market developments and be ready to seize opportunities in this exciting crypto landscape.
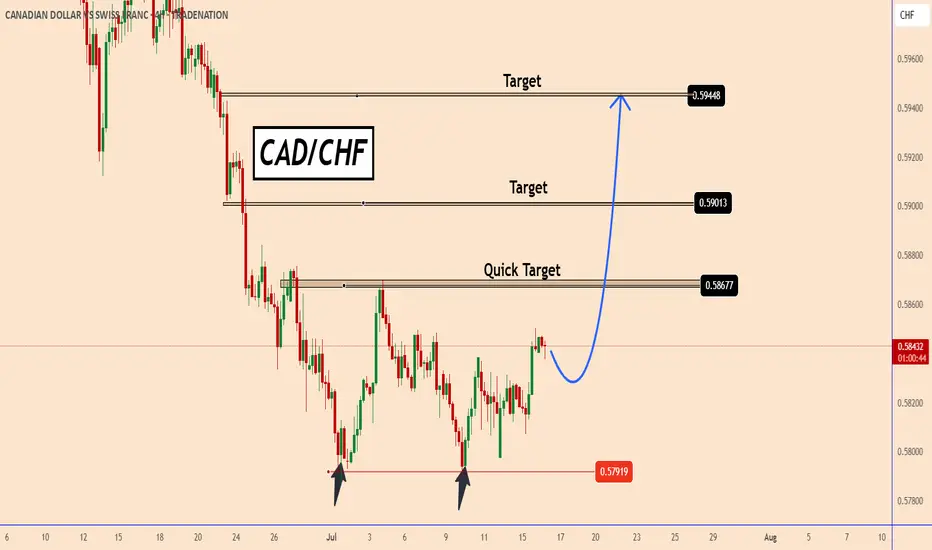
CADCHF found strong support zone near 0.5790CADCHF found a strong support zone near 0.5790
The chances are that the price already completed a doubt bottom pattern. It is not confirmed yet but the support zone is already too strong.
The price may face a strong resistance near the first target 0.5870 that is also the strongest target. Once the price moves above that zone it should rise further to the other targets near 0.5900 and 0.5945
You may find more details in the chart!
Thank you and Good Luck!
PS: Please support with a like or comment if you find this analysis useful for your trading day
Disclosure: I am part of Trade Nation's Influencer program and receive a monthly fee for using their TradingView charts in my analysis.
Gold XAU/USD Analysis for July 15, 2025: Trading Strategy and KeThe market is showing a strong upward trend, as indicated by the yellow trendline.
Fibonacci Retracement Levels:
38.2% Fibonacci Level: 3,344.79
50% Fibonacci Level: 3,344.47
61.8% Fibonacci Level: 3,347.91
Resistance Zone: The price is approaching a strong resistance level at 3,370 USD.
Technical Observations:
Gold is currently moving upward but is encountering resistance at 3,361. The price tested the 61.8% Fibonacci level and is now facing some resistance.
The Fibonacci levels suggest that if the price breaks above 3,362, the next target could be 3,370 USD.
Support Zone: If the price retraces, support may emerge near the 3,340 region.
Gold XAU/USD Trading Strategy:
Bullish Scenario:
If the price breaks above resistance at 3,362, the next target would be the 3,370 level. This could be a signal to enter Long positions near the 3,344 to 3,348 range, with a target around 3,370.
Bearish Scenario:
A retracement to the support level at 3,340 is possible. If the price drops below 3,340, further downside could be expected. In this case, a Short position could be considered if the price falls below 3,340, with a target near 3,330.
With the current upward trend, gold XAU/USD may continue to rise if it breaks the 3,362 resistance level, with the next target being 3,370 USD. However, if the price turns lower and drops below the 3,340 support level, the market may continue to decline.
Note: Be sure to monitor the Fibonacci levels and price behavior closely to adjust your trading strategy accordingly for today. If this analysis was helpful, don't forget to save it and follow for more trading strategies!
