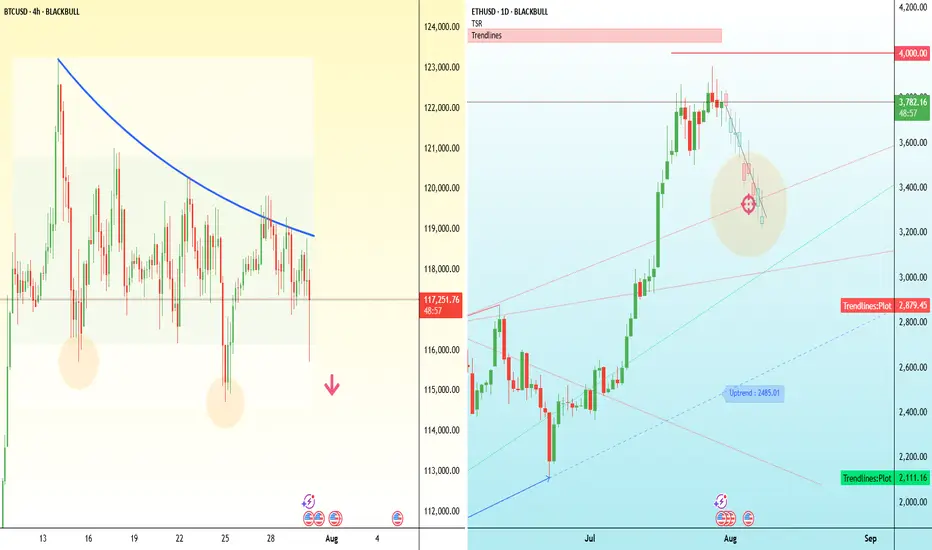
Major test for crypto bulls - BTC and ETH Bitcoin has dipped below $118,000, putting pressure on the bullish structure that’s held for the past two weeks.
The attempted breakout above $121,000 has failed, and price is now breaking down through the middle of the consolidation range, threatening short-term higher lows. On the 4H chart, this move resembles a failed breakout with a potential double-top near $121,000.
If Bitcoin can’t reclaim $116,000 quickly, the next downside levels to watch are $114,000 and $110,000.
Ethereum, meanwhile, has stalled just below $3,800 after a strong rally this month. Price action has flattened out over the past few days, with several failed attempts to push through that level. The key upside trigger remains $4,000.
But if $3,700 gives way, ETH may slide back to the $3,450–$3,300 region, where previous resistance and the rising trendline converge.
Fundamental Analysis
BITCOIN → Correction within a downward channel. 112K or 125K?BINANCE:BTCUSDT is consolidating. However, a local downward trading range is forming relative to the current setup. What is the probability of a correction continuing to 112K or growth to 125K?
Daily structure: a local correctional channel within a global bullish trend. We have cascading resistance at 119.2, 119.6, 120, and 120.8. It will be quite difficult to break through this zone on the first attempt, but MM can use it to form traps and collect liquidity.
At the bottom, everything is simpler — a breakdown of the local bullish structure, the formation of an intermediate minimum, below which there is a void down to 112K.
Yesterday, relative to 115-116K, mm staged a massacre (trap) on both sides of the market.
Liquidity collection, return to the range, and growth. The reaction to the false breakdown of support is quite strong. Since the opening of the session, Bitcoin has been heading towards resistance, but there may not be enough potential to break through the upper resistance conglomerate, so I expect to see a pullback or decline to 116-115-114.
Resistance levels: 119.2, 120.1, 120.85
Support levels: 116.37, 115.67, 112
Technically and fundamentally, I do not see any drivers that could support the market (I am talking about Bitcoin, since the driver for altcoins is the decline in Bitcoin's dominance). It is possible that this may appear later. In the current situation, I am considering a false breakout and correction, as the market has not yet finished consolidating or correcting, and the current downward trading range may be extended.
PS: As the price moves towards resistance, it is necessary to monitor the reaction. The market itself will show what it is preparing for...
Best regards, R. Linda!

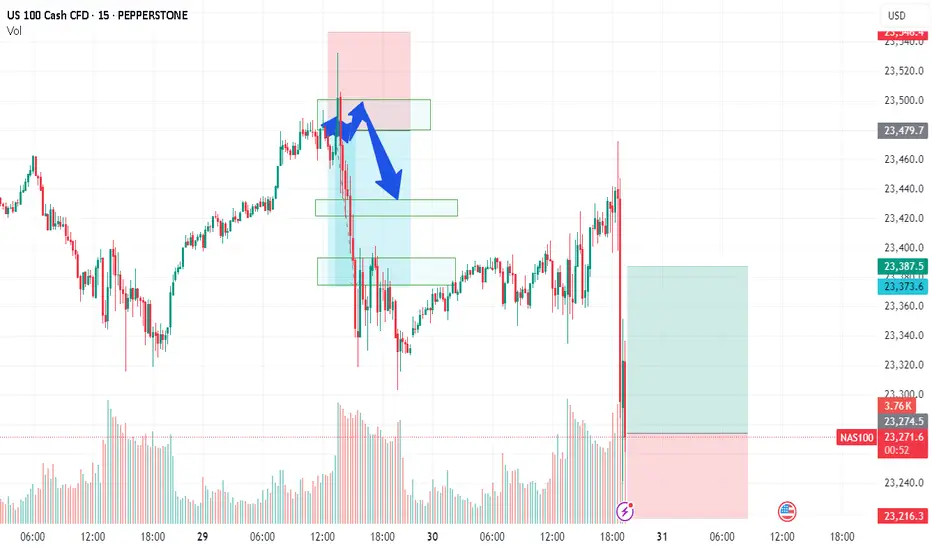
NAS100 - EXPECTING THE DUMPTeam, we got short well today with AUS200 - both target hit
we have set up the NAS entry , this is the entry price 23268 - 23200
STOP LOSS at 23100
Once it break above 23320 - bring stop loss to BE
Target 1 at 23320-60 - take 50%-70& partial
Target 2 at 23380-23400
LETS GO
KSS Uptrend HoldsKSS has been trading down since the spike and should hold its uptrend into earnings. Brokers will raise borrow costs and if GDP is any guide, KSS should have better than expected results for earnings.

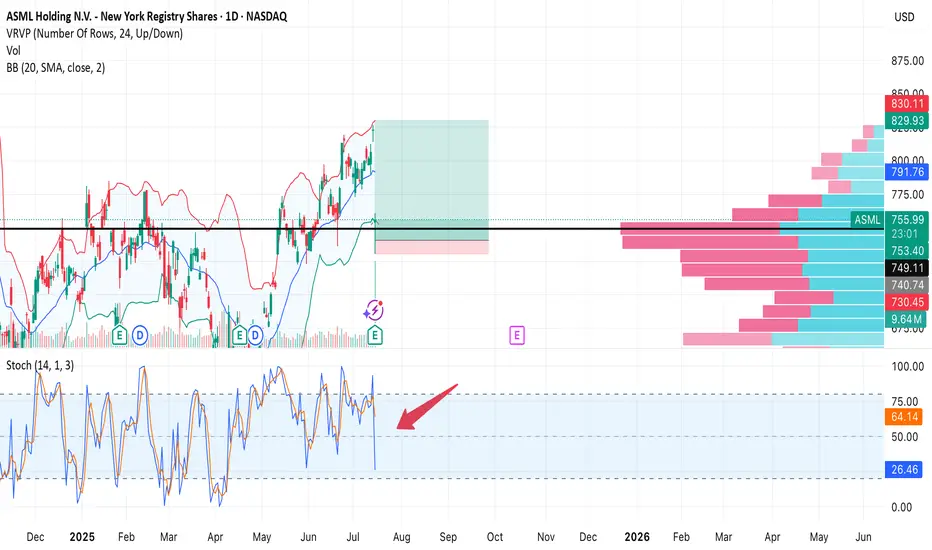
ASML — Strong earnings, sharp drop on profit-taking. Second chanAfter a strong quarterly report, NASDAQ:ASML stock initially surged, but then dropped -7.6% in a single session. Most likely due to profit-taking and a broader tech sector correction. Still, the key $754 support held, and the uptrend remains intact.
Trade Setup:
• Buy Zone: $754–760 (on retest)
• Target: $849 (+12%)
• Stop Loss: $730 (below support and volume shelf)
• Risk/Reward: 1:8
Earnings were great, fundamentals are solid. This drop could be a shakeout before continuation. As long as $754 holds, bulls have a second chance.
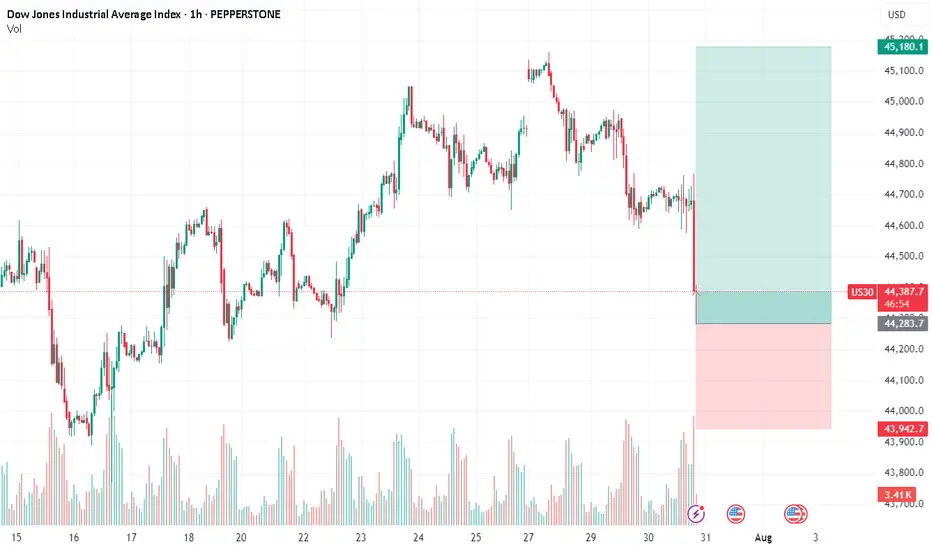
DOW/US30 - PATIENCE IS THE KEYTeam, i expect the DOW/ NAS will be selling off due RATE unchange
i am going LONG now at 44335-44300 ranges
STOP LOSS at 44195
Target 1 at 44500-44550
Target 2 at 44600-44630
LETS GO
By the way, if you trade AUS200 today, both target hit on SHORT.
Have been warned multiple times....BTC will FALL on retailersBTC has been consolidating at the top for a while, which is not very common. Have a feeling that crypto bros have been getting the scratch for more profit taking, but no sensible person will keep buying at the top when the market is already WAY overheated. Picked up early UltraBear signal on this, don't be the person holding to the bag for years. This bubble will burst, just like every other time! Always do your own due diligence, stay safe and get out if you can....

ETHUSD Long Setup: Targeting $4,000 After Bullish Reversal from ETH just swept the previous lows near $3,650–$3,700, clearing liquidity and flipping that zone into fresh support. This classic price action move often precedes expansion, and ETH looks primed for a continuation toward $4,000 in the coming sessions.
🧠 Technical Analysis
Previous Highs Swept: ETH took out the prior highs around $3,650–$3,700, trapping late shorts and grabbing liquidity.
Break of Structure: We've seen a clear bullish market structure form on the 4H and daily TFs, with higher highs and higher lows intact.
Support Zones:
$3,650–$3,700 (former resistance, now flipped support)
$3,550 (consolidation base before breakout)
Resistance Zones:
$3,950–$4,000 (psychological level + previous 2024 highs)
$4,100+ (weekly imbalance and potential extension zone)
Now that ETH has cleared short-term liquidity and confirmed demand on the retest, the path of least resistance appears to be up.
🔍 Fundamental Outlook
ETH ETF Narrative: Market anticipation for spot ETH ETF approval is heating up, boosting demand and institutional interest.
Reduced Sell Pressure: With the Shanghai upgrade long behind us, staking continues to increase, reducing circulating supply.
Macro Tailwinds: Risk-on sentiment in the broader market is aiding crypto momentum, especially for large-cap assets like ETH.
🎯 Target: $4,000
📉 Invalidated Below: $3,550 (if reclaimed by bears, invalidates bullish thesis)

GOLD: Multi-Timeframe Analysis Ahead of FOMCGOLD: Multi-Timeframe Analysis Ahead of FOMC
Gold prices may experience a short-term surge leading up to the FOMC announcement.
But what comes next?
Let’s break down the analysis, step by step.
For deeper insights, watch the full breakdown in the video.
Thank you!

Bearish Gold Outlook — Potential Flash Crash Imminent🔻 Technical Structure – Bearish Breakdown Brewing
Lower highs and lower lows forming on the daily and 4H timeframes — classic downtrend mechanics.
Price has rejected multiple times near $3,400–3,430, forming a strong resistance ceiling.
Support at $3,280–3,300 has been tested too many times— and each bounce is weaker. When support holds with less conviction, it's often about to break.
Volume spikes on red candles show smart money is exiting on down moves — signs of institutional distribution.
The **tightening consolidation range** looks like a **descending triangle** — usually resolves downward.
If $3,280 breaks, expect a **liquidity event**. Stops get swept, leading to a **sudden acceleration — possibly a flash crash** to $3,200 or lower.
🌍 **Fundamental Drivers – Macro Picture Is Turning Hostile for Gold**
1. Real Yields Are Climbing
U.S. real yields are up as inflation fades and the Fed stays hawkish.
Gold, being yieldless, suffers when investors can get positive returns from bonds.
2.The Dollar Is Gaining Strength
DXY is pushing higher, fueled by strong U.S. data and weak peers (euro, yen).
Gold priced in USD becomes more expensive globally — this suppresses demand.
3. **Rate Cuts Are Off the Table — or Delayed**
Market is pricing fewer and later rate cuts from the Fed.
This removes one of gold’s biggest bullish catalysts from earlier in the year.
4. Geopolitical Fear Is Cooling
No major escalation in Ukraine, Middle East, or Taiwan.
Without fear, gold loses its safe-haven premium.
5. Central Bank Buying May Have Peaked
Recent data from WGC shows some slowing in central bank accumulation.
If this institutional bid softens, gold could drop hard — few natural buyers remain above $3,300.
⚠️Conclusion: Gold Is Walking a Tightrope
The chart is a staircase down.
Macro fundamentals are no longer supportive.
A clean breakdown below $3,280 could trigger a **chain reaction** of automated selling and margin calls — **a flash crash is on the table**.
This isn’t just a correction — this feels like the calm before the storm.

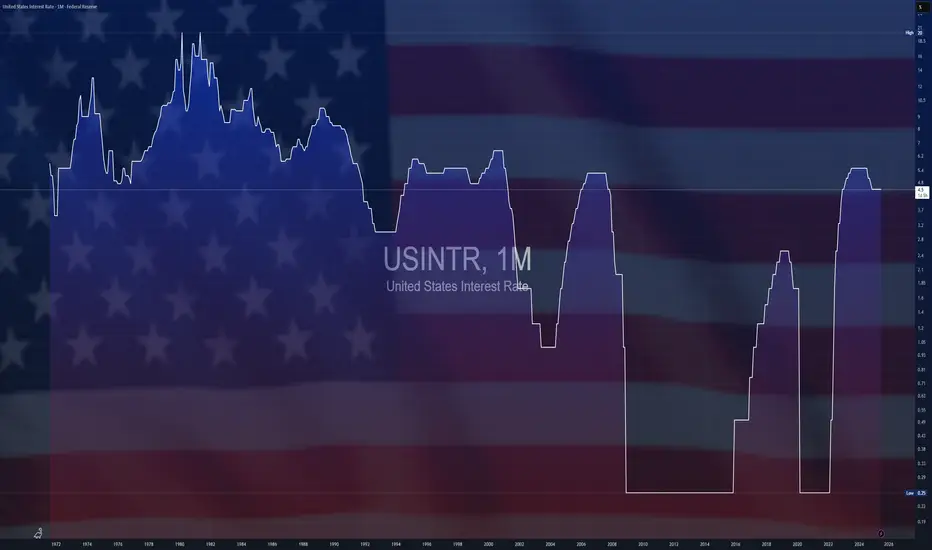
$USINTR -Feds Leaves Rates Steady (July/2025)ECONOMICS:USINTR
July/2025
source: Federal Reserve
- The Federal Reserve held rates steady at 4.25%–4.50% for a fifth straight meeting, defying President Trump’s demands for cuts even after positive GDP growth .
Still, two governors dissented in favor of a cut—the first such dual dissent since 1993.
Policymakers observed that, fluctuations in net exports continue to influence the data, and recent indicators point to a moderation in economic activity during the first half of the year.
The unemployment rate remains low, while Inflation somewhat elevated.
Interest rates unchanged, sticking to my bearish idea.Look at my other posts and you''ll understand as to why, I was telling everyone to sell. There was a small sellers trap, we pushed up, at that moment I already had closed my positions. Now we go down to the other key levels. I'm done till the end of August. Will still post my setups, but won't take any trades. Stay safe and keep your funds safe. Hella Love!

USDJPY Setup: Prime Buy Zone with a Clear Target!Good morning my friends,
I've prepared a fresh USDJPY analysis just for you.
Currently, the most logical buy zone sits at 147.170. If price reaches this level and performs a retest, it’s likely to target the 149.185 level.
I'll personally be entering at 147.170 and waiting for my target: 149.000.
This setup is based on the 4-hour timeframe, so it may take some time to reach the target.
Every single like you give is a major source of motivation for me to keep sharing these analyses.
Thanks so much to everyone supporting with a like!

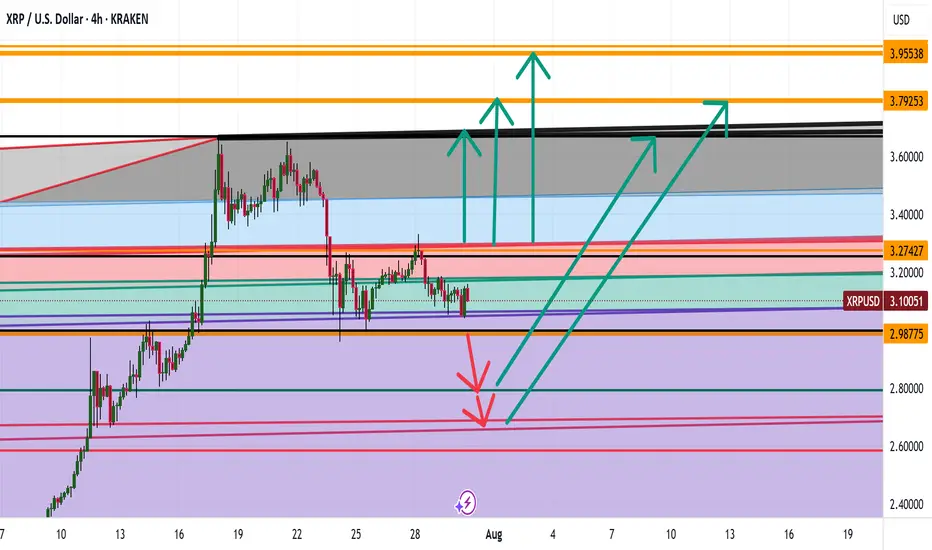
XRP WHERE ARE WE HEADED ? LEVELS TO LOOKOUT FORHey trading fam
So XRP is a fun one but based on BTC correcting and what we are seeing there are a couple thesis's that we currently have for it
Thesis 1: We break south from 2.98 lows: Levels to look out for:
2.80
2.70
2.68
Thesis 2: We break the highs of 3.29: Levels to look out for:
3.65
3.79
3.99
Trade Smarter Live Better
Kris
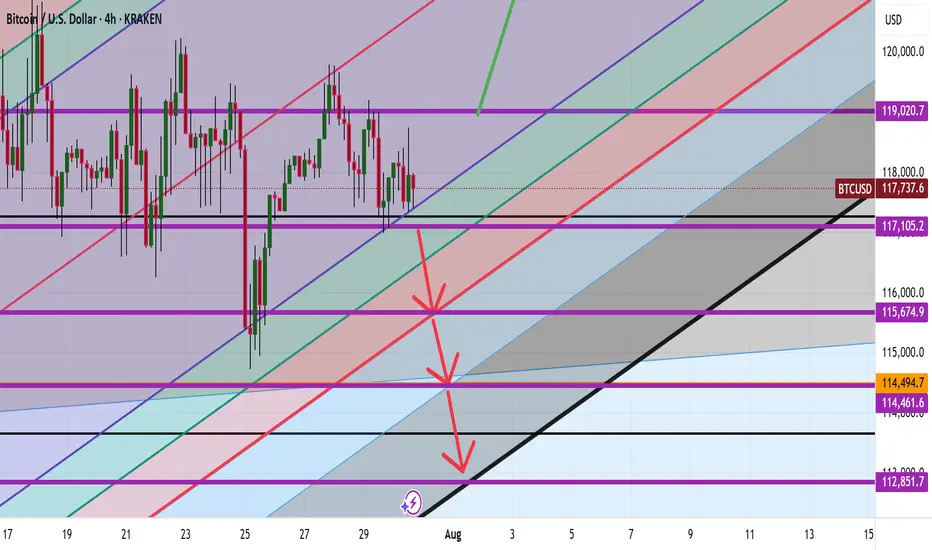
Bitcoin Are We Heading to 140K or 80K ??? Here is the Analysis Based on what is happening here is what we currently see with Bitcoin
Idea 1: If we can break 119K then here are the following levels Bitcoin can go to :
122K
126K
135K
140K
Idea 2: If we continue and break further bearish here are the levels BTC can go to
115,600
114,500
112,800
If we go below this level then a larger correction thesis would point us with a deeper bearish level
Happy Trading
Trade Smarter Live Better
Mindbloome Exchange
Kris
USD/ CAD Are We Heading to $1.46 Territory Watch OUT Afternoon Trading Family
Based on what we are seeing is a nice bullish run up to the following levels :
Levels To Watch For:
1) $1.39
2) $1.41
3) $1.43
4) $1.46
However be aware if we for whatever reason we sink back into the 1.35 territory then we could see a drop down to 1.34
Trade Smarter Live Better
Kris

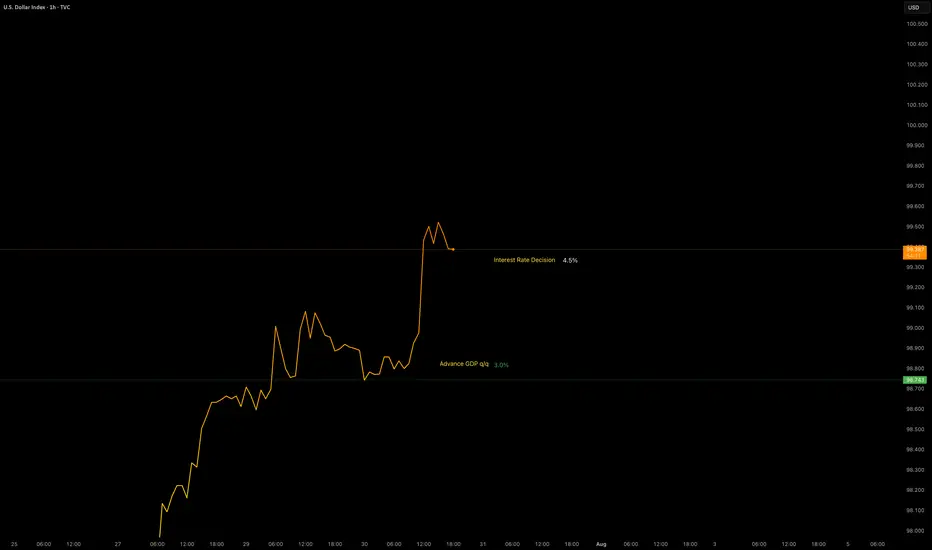
Data Release - Interest Rate DecisionJul 30 2025: Interest Rate Decision (4.5%)
Rates remain unchanged as expected.
OANDA:XAUUSD remains bearish with the help of GDP data.
TVC:DXY remains bullish with the help of GDP data. No major changes in either pairs.
Volatility is increased.

AUD/USD ANALYSIS: WHERE ARE WE HEADED Good afternoon
Based on what we are saeeing with AUD/USD we see two options
1) Below .645 low then we can see a decent drop down to .635
2) If we can break the highs of .652 then a drive up to .65951 makes sense
Trade Smarter Live Better
Kris

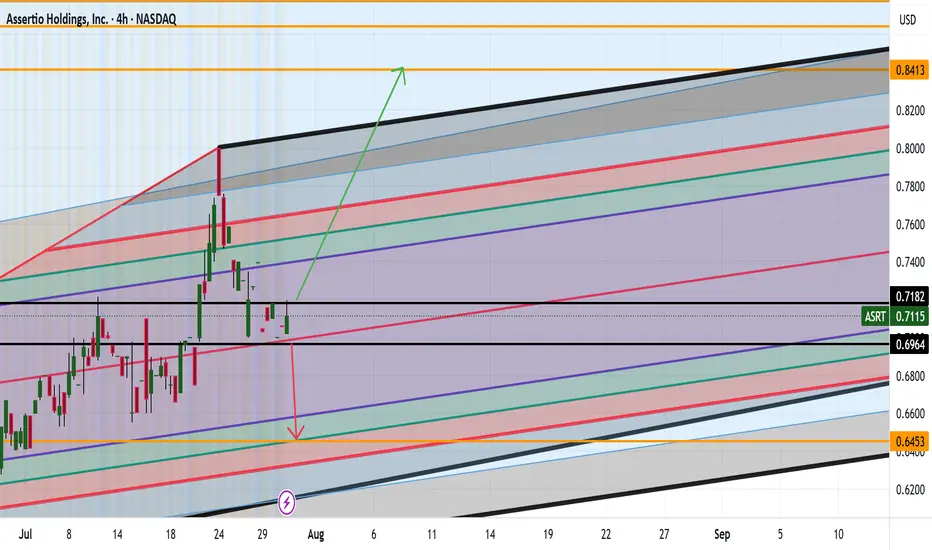
ASRT ARE WE HEADING TO .84CENTS AND HIGHER? Good afternoon Trading Family
So looking at ASRT we see two options here:
1) We break .71 cents high which then would give confirmation to a drive up to 84 cent range
2) We break below the .69 cent low which then would help us confirm a possible short down to .64 cents
Trade Smarter/ Live Better
Kris
GOLD PLAN – LIQUIDITY HUNT BEFORE THE REAL MOVE? SCALPING PLAN – LIQUIDITY HUNT BEFORE THE REAL MOVE? 🔍
🔹 Timeframe: 30M
🔹 Bias: Intraday Bullish to Bearish Reversal
🔹 Posted by: Clinton Scalper | Smart Money Focus
🔹 Date: July 30, 2025
🔍 MACRO CONTEXT – WHY GOLD REMAINS HIGHLY REACTIVE
The macro backdrop continues to favor volatility in gold:
🟢 Dovish Fed tone ahead of FOMC
– Fed speakers hint at a pause or rate cut timeline.
– Inflation pressures are easing → lowers interest rate expectations.
📉 USD weakening + falling yields
– 10Y U.S. bonds retreating → dollar under pressure → gold gains ground.
🌐 Geopolitical risks remain elevated
– Tensions from Middle East and global recession risks continue to drive flows into safe-haven assets like gold.
🧭 Conclusion: Short-term upside still viable – but be cautious of liquidity traps and OB rejection.
📈 TECHNICAL + SMC INSIGHTS – THE CHART TELLS THE STORY
🔹 Structure Overview:
Market broke out of a descending channel and formed a bullish ascending wedge.
However, price is now approaching multiple OB SELL zones, aligning with smart money exhaustion levels.
🔹 Key Zones:
🔺 OB SELL Zones:
3,334 → 3,342
3,354 → 3,369 (Fibonacci 1.618 extension)
🔻 OB BUY Zones:
3,302 → 3,291 (confluence with previous liquidity sweep)
📍 Current Price: 3,330 – approaching first supply zone.
🔹 Smart Money Flow:
Liquidity above 3,334 has likely been targeted.
If price reaches 3,354–3,369 and shows exhaustion, expect distribution + reversal.
Key confirmation will be a break back below the ascending structure with momentum.
🎯 TRADE PLAN – TWO POSSIBLE SCALPING SCENARIOS
✅ SCENARIO 1: SHORT FROM PREMIUM OB SELL ZONE
Looking to fade bullish liquidity grab near top of range.
Entry: 3,354–3,369
SL: 3,375
TP1: 3,334
TP2: 3,302
TP3: 3,291
Ideal for reversal scalpers catching the distribution move.
✅ SCENARIO 2: LONG FROM DISCOUNT OB BUY ZONE
If price rejects OB SELL and dumps into unfilled demand.
Entry: 3,291–3,302
SL: 3,275
TP1: 3,322
TP2: 3,343
TP3: 3,354
Smart money often reloads after hunting liquidity beneath discount OBs.
⚠️ EXECUTION REMINDERS
✅ Wait for confirmation candles: engulfing / wick rejection / breaker structure
⛔ No market orders without OB reaction
📊 Risk max 1–1.5% per position
📉 Use volume to confirm absorption / exhaustion in OB zones
📢 FINAL THOUGHT – TRAPS COME FIRST, THEN MOVES
Smart Money doesn't chase price — it hunts stops first.
We’re watching closely to see if price completes its liquidity sweep at 3,354–3,369 before a potential reversal. Alternatively, we wait for price to return to the OB BUY zone around 3,291 for a high-RR long play.
🔥 If this helped you:
👍 Like this idea
💬 Comment your thoughts below
🔔 Follow Clinton Scalper for weekly institutional-grade setups

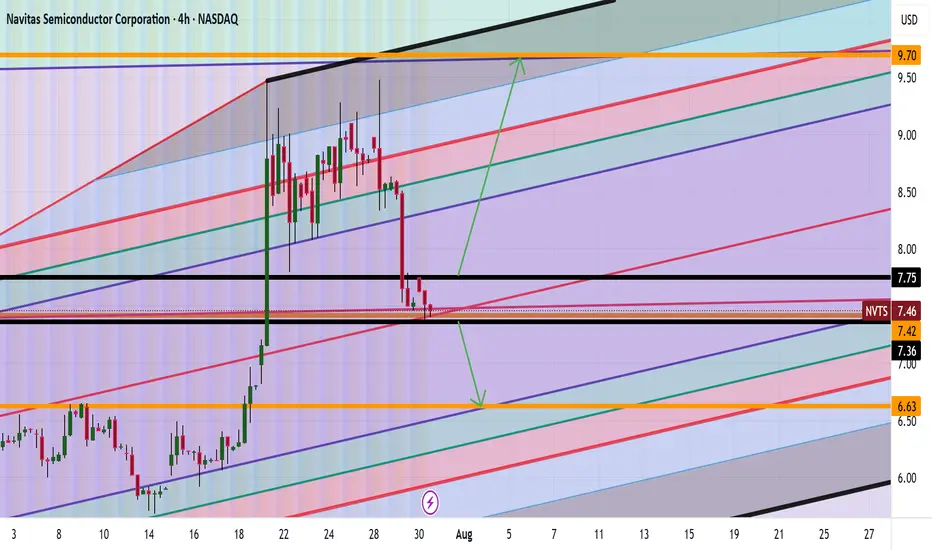
NVTS Analysis Are we Heading to $9+ Good afternoon Trading Family
Based on what we currently see with NVTS are two scenarios happening:
1) Above 7.80 highs we will thus be heading to the 9-9.7 range
2) Below 7.30 lows then we will be heading to the 6 dollar range
Happy Trading
Trade Smarter/ Live Better
Kris
The Current State and Future Direction Of The S&P 5006/9/24
Created By Joeseph Emanuel Dennis
Idea:
Critical area and critical moment in not only the NASDAQ but for the entire bull market otherwise we'll start a prolonged retracement or an unlikely bear market turnaround. My SPY target remains 600 based on previous positive FOMC, CPI, Job Report Data, Rate Cuts, Elections, and Current Institutional development. On the technical side, the higher high movement began at the start of 2023 my initial target was 480 and I was correct! after the September weekly retracement on SPY, we have been pushing higher despite January's negative economic data and the conflict with IRAN. The daily is set to move currently above the 20MA with the weekly bullish and the monthly extremely bullish. IMPORTANT WEEK AHEAD! the future data will determine if the bullish trend will progress onward FOMC meeting will either scare people out of the market or drive the market into a rally along with central bank stocks. My bet is bullish even though inflation is record high thanks to the Biden administration we somehow keep pushing higher makes you wonder if the positive economic data is even accurate is employment being at a record high is that a good thing? Many Americans find them selfs more with two jobs or even three jobs is that a positive thing? Underemployment is also at record highs are these post-college graduates getting the salary they deserve or are they settling with two low-wage jobs? Nonetheless, the bull market will rain on with a summer rally. I will keep watching in case something turns around the enemy isn't Jerome Powell it's the liars at the white house and the propaganda creators over at MSNBC.
Note: This goes for Bitcoin as well! 80K here we go!
