XAUUSD ANALYSISOn gold currently we're analyzing 2H time frame. As we know that current trend was bullish. At this stage, I'm anticipating a retracement towards my Point of Interest (POI), where I’ll be looking for a clear bullish confirmation, ideally through candlestick structure or solid price action. Only upon receiving that confirmation will I consider entering a buy position.
This outlook is based on the higher time frame structure. For now, I'm observing patiently to see how price unfolds. Until the market sweeps the SSL liquidity, I will remain on the sidelines no entries until that key liquidity level has been taken. Confirmation is key.
Always use stoploss for your trade.
Always use proper money management and proper risk to reward ratio.
#XAUUSD 2H Technical Analysis Expected Move.
Fundamental Analysis

GBP/USD Drop: Something Big BrewingGBP/USD is cratering, hitting 1.3550 as weak UK economic data and a soaring dollar dominate. Markets look grim with supports shattered. A liquidity drop could trigger wild swings and wider spreads. Global news adds heat: Trump’s 35% tariff threats on Canada and BRICS nations stir trade war fears, crushing GBP. Stay alert, tighten risk.


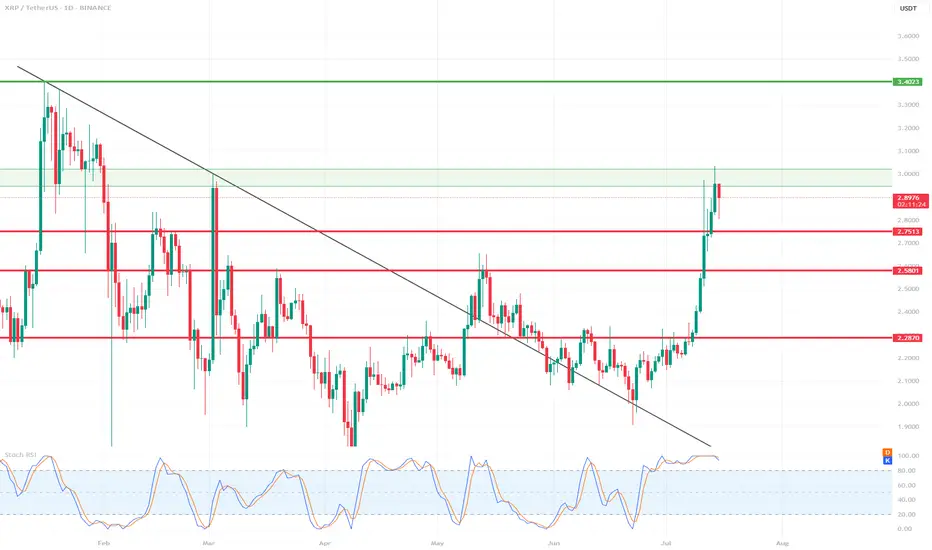
XRP 1D Chart Review📊 Support and Resistance Levels:
🔼 Resistance:
$2.95 - $3.02 – currently being tested, a local resistance zone. Price slightly rejected.
$3.40 – another strong resistance level from the previous high (visible on the left side of the chart).
🔽 Support:
$2.75 – the closest, recently broken support level.
$2.58 – another local support level.
$2.28–$2.30 – a very strong support zone that has been tested multiple times.
📈 Pattern and Momentum:
A breakout from a wedge-shaped downtrend with very high volume and long bullish candles indicates strong demand.
We are currently observing a correction/rejection at $3.02 – a possible short-term pullback.
🔄 Oscillator – Stochastic RSI:
The Stochastic RSI oscillator is in the overbought zone (near 100) – indicating possible consolidation or correction.
The curves are starting to curve downwards – a potential signal for a slight correction in the coming days.
🧠 Scenarios:
✅ Bullish (continued growth):
If the $2.95–$3.02 level is broken strongly and confirmed (e.g., by a daily candlestick closing above it), the target will be $3.40.
In this case, a quick rally to $3.40 is possible without major obstacles.
⚠️ Bearish (correction):
If the $3.02 zone holds as resistance, the price could retrace to $2.75 (the first local support).
If downward pressure persists, $2.58 could be tested.
📌 Summary:
XRP is in a strong uptrend after breaking out of long-term resistance.
In the short term, overbought prices on the Stoch RSI could trigger a correction to $2.75.
Key resistance: $3.02 – breaking it could signal further gains towards $3.40.
It's worth monitoring price reaction in this zone and candlestick confirmation.

Double Calendar Option Spread on MMMUsing a double calendar spread to profit from price movement in either direction after earnings announcement in 3 days time (18 July) for MMM.
These trades can be extremely profitable if one expects movement after earnings.
Selling both a Put and Call at high (pre-earnings IV) makes this option trade relatively cheap, since the purchase for the other Call and Puts are after earnings announcement with lower IV
Selling a Call with Strike $167 for 18th July
Selling a Put with Strike $145 for 18th July
Buying a Call with Strike $175 for 29 Aug
Buying a Put with Strike $140 fro 29 Aug
Total net debit and max loss $125 for 1 contract
Max profit $ 287
For more details on these type of Option trades you can search for Strategic Options Trader on Substack

DIYWallSt Trade Journal: Perfect Morning Signals & Rate Cut bets07/15/25 Trade Journal, and ES_F Stock Market analysis
EOD accountability report: +404.50
Sleep: 7 hours
Overall health: Good
VX Algo System Signals from (9:30am to 2pm)
— 8:41 AM Market Structure flipped bullish on VX Algo X3!
— 9:33 AM VXAlgo ES X1 Sell Signal (triple sell)
— 9:40 AM Market Structure flipped bearish on VX Algo X3!
— 1:20 PM VXAlgo ES X1 Buy signal (triple buy)
What’s are some news or takeaway from today? and What major news or event impacted the market today?
We got great signals at the start of the day and that really helped with today's trading. I had some meetings today and stufff to take care of so i decided to lock out the funded account around noon and called a day.
News
— 9:54 AM
*TRADERS STICK TO BETS ON SEPTEMBER FED RATE CUT AFTER INFLATION REPORT
What are the critical support levels to watch?
--> Above 6295= Bullish, Under 6285= Bearish
Video Recaps -->https://www.tradingview.com/u/WallSt007/#published-charts

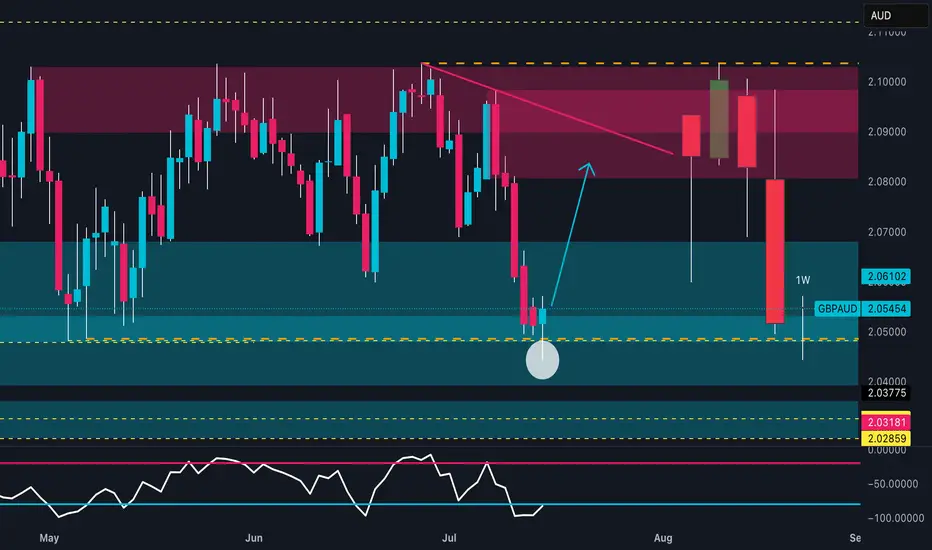
GBPAUD: Weekly Reversal | COT & Seasonality Support Bullish📊 Technical Outlook
Price strongly reacted from a key weekly demand zone between 2.0400 and 2.0500, showing clear absorption of bearish pressure. The RSI is rebounding from the 30 area, signaling early reversal potential.
The next technical target lies between 2.08900 and 2.10000, within a well-defined supply zone.
An early bullish reversal is in progress, with potential for a swing move toward the red zone.
🧠 Commitment of Traders (COT Report – 08/07/2025)
GBP: Non-commercial traders are net long, with positioning growing across the board: +869 longs / -926 shorts. Commercials reduce shorts and increase longs → Bullish bias.
AUD: Non-commercials are clearly short (-2,267 longs / +1,957 shorts). Commercials are increasing long exposure (+2,629), but still in the minority → Bearish bias.
➡️ The COT spread confirms a GBP long vs AUD short bias.
📅 Seasonality (July)
GBP: Historically strong in July, with average monthly gains across all timeframes (especially the 2Y window).
AUD: Less favorable seasonal profile in July; flat to slightly negative across all time horizons.
➡️ Seasonality supports GBP strength.
📉 Retail Sentiment
58% Long / 42% Short on GBPAUD
➡️ Retail traders are still heavily long → a shakeout of weak long hands is possible before the real rally begins.
🎯 Strategic Conclusion
GBP shows bullish convergence across technical, COT, and seasonal factors. AUD presents clear weakness.
The current price zone offers a clean entry point for longs, targeting the 2.08900–2.10000 supply zone.
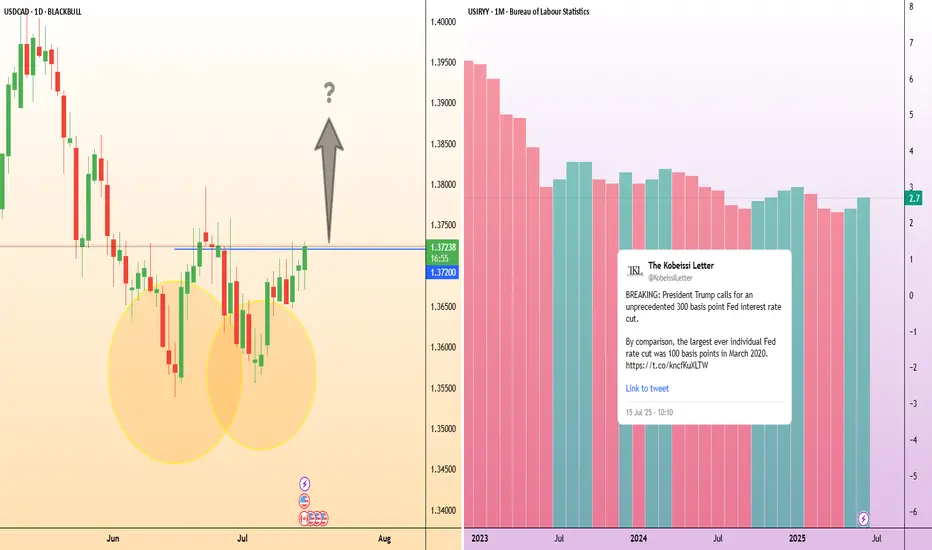
USD/CAD: Inflation gaps create opportunityIn the U.S., inflation accelerated for a second straight month, with headline CPI reaching 2.7% year-on-year in June as President Trump’s tariffs begin to push up the cost of a range of goods.
Increasing inflation could likely heighten the Federal Reserve’s reluctance to cut its interest rate, in defiance of Trump’s public demand. This could provide upward momentum for USD/CAD if expectations for rate cuts are delayed.
USD/CAD is showing signs of a potential trend reversal after finding strong support around 1.3600 in late June. Price action has since formed a series of higher lows, and the recent breakout attempt above 1.3720 suggests bullish momentum could be building.
Canada’s inflation rate, released at the same time as the US’s, edged up to 1.9%, staying below the Bank of Canada’s 2% target for a third consecutive month. With the BoC already signalling easing bias, this divergence in inflation paths may limit CAD strength.
CRUDE OIL Bearish Flag Breakout 📉CRUDE OIL Bearish Flag Breakout!
⭕Sell!
__
#USOIL is trading in a local
Downtrend and formed a bearish
Flag pattern and now we are
Seeing a bearish breakout
So we are bearish biased
And we will be expecting
A further bearish move down
Sell!🔽
—

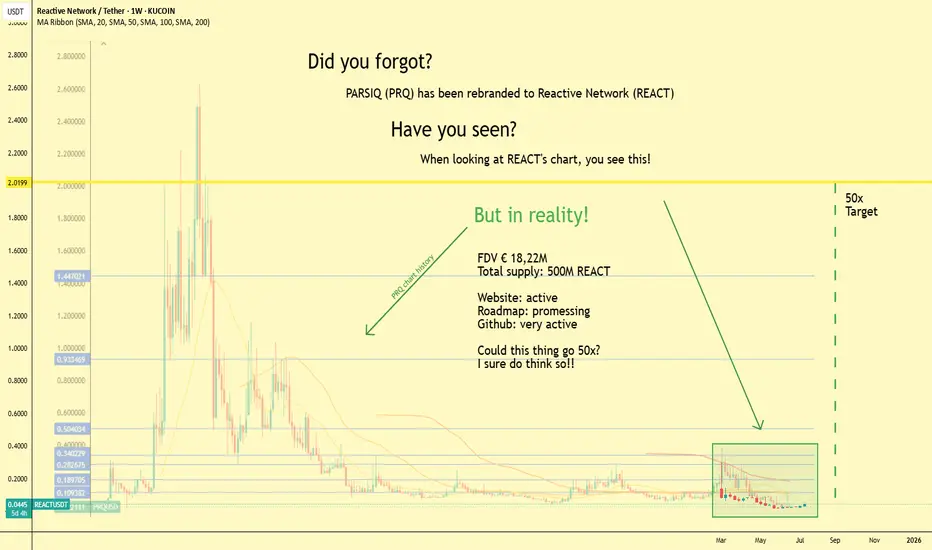
Is REACT Set for a 50x Price Explosion? A Look at PSQ RebrandIs REACT Set for a 50x Price Explosion?
Sometimes, to see the future, you have to look at the past. For those watching Reactive Network (REACT), a look back at the history of its predecessor, PARSIQ (PRQ), might reveal a path toward significant gains. After rebranding and a 1:1 token swap, REACT is poised to follow in PRQ's footsteps, with some analysts seeing a potential 50x increase on the horizon.
The Ghost of PRQ's Past
By overlaying the historical chart of PRQ onto REACT's current price action, a striking similarity emerges. This "ghost map" suggests that if REACT follows a similar trajectory to PRQ's past bull run, the upside potential is massive. The all-time high for PRQ was $2.62, a tantalizing target for REACT holders.
Why a 50x Target Isn't Just a Dream
Beyond the chart parallels, there are fundamental reasons to be bullish on Reactive Network:
A Major Rebrand and Technological Leap: The shift from PARSIQ to Reactive Network is more than just a name change. Reactive Network is a cutting-edge, EVM-compatible blockchain layer designed to revolutionize how dApps operate across multiple ecosystems.
It introduces "Reactive Smart Contracts," which can be triggered by external events from other blockchains, enabling powerful cross-chain interoperability. This technology aims to be a tool for developers to enhance their existing dApps on other chains like Ethereum or Arbitrum.
Solid Tokenomics: The REACT token launched with a total supply of 500 million, identical to PRQ's initial supply, ensuring no dilution for existing holders. The token is essential for the network, used for transaction fees, event log processing, and validator staking. A fee-burning mechanism is also in place to potentially reduce the total supply over time.
Growing Ecosystem and Active Development: The project boasts an active GitHub, a promising roadmap, and a functioning website. The mainnet officially launched in early 2025, and the project has already announced its first hardfork, "Amber," aimed at increasing stability and decentralization. They have also established a $3 million developer fund to encourage building on the network.
Recent Performance and Market Cap: As of mid-July 2025, Reactive Network (REACT) and PARSIQ (PRQ) have seen significant price increases. REACT is trading around $0.03846 with a market cap of approximately $11.9 million and a fully diluted valuation of about $19.36 million. This relatively low market capitalization could leave significant room for growth if the network gains adoption.
The Road Ahead
While past performance is not indicative of future results, the combination of a compelling technical narrative, strong tokenomics, and a dedicated team makes Reactive Network a project to watch. The "ghost map" of PRQ's past suggests a potential target of around $2.00, representing a substantial increase from its current price. As the Reactive Network continues to develop and onboard new projects, the 50x target may move from a possibility to a reality.
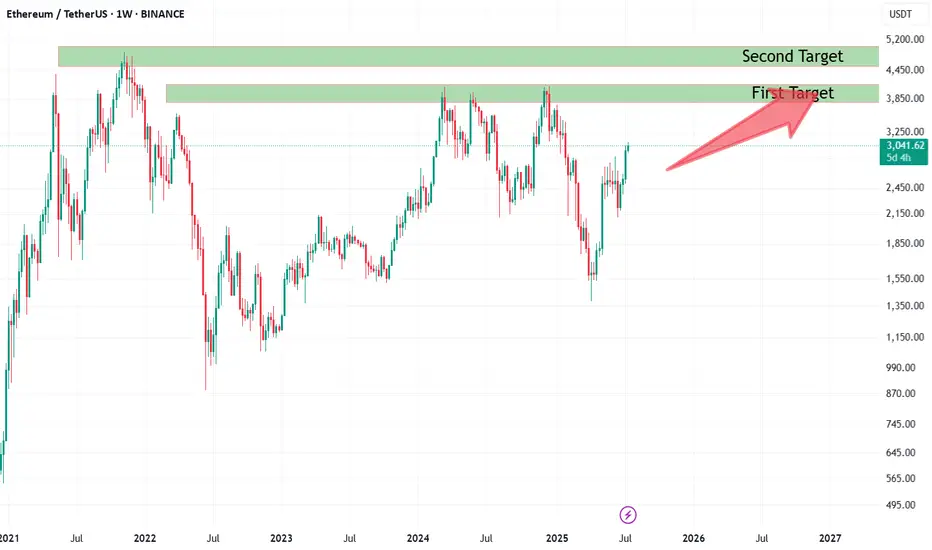
Binance Holds 25% of Exchange ETH: Smart Accumulation?According to cryptoonchain’s analysis of on-chain data from CryptoQuant, Binance now holds about 25% of the total Ethereum reserves across all exchanges. This significant figure could be a sign of smart accumulation by major market participants. Notably, Binance’s rising share has occurred while overall ETH reserves on exchanges have remained stable. In a situation where Ethereum’s price is still below its all-time highs—even as Bitcoin has set new records—this accumulation on Binance may signal that large investors are entering and expecting future price growth.
On the weekly chart, Ethereum is showing signs of strength and a possible continuation of its upward trend. If buyers maintain their momentum, the first target lies in the 3,900–4,200 zone, with the second target in the 4,850–4,950 range—close to previous all-time highs.
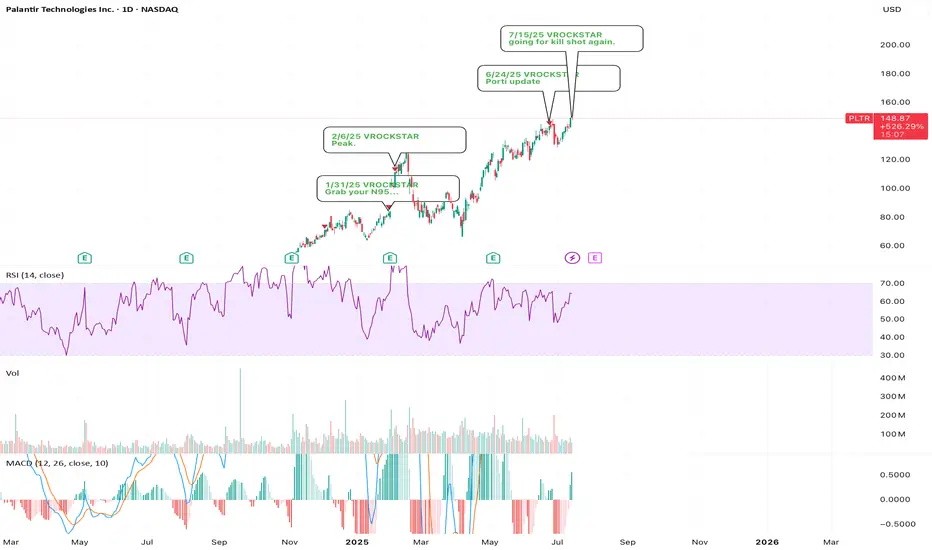
7/15/25 - $pltr - going for kill shot again.7/15/25 :: VROCKSTAR :: NASDAQ:PLTR
going for kill shot again.
- using the 2x levered meme etf PTIR to buy P's
- there are no logical explanations anymore for me to justify valuation "yeah V valuation doesn't matter"... you'll see what i mean, kid
- even 2x'ing FCF over the next 2 yrs and this thing with decelerating growth and the emergence of super intelligence means more competition, more vendors... again "you'll see kid"
- so does this go down tmr idk idc. this is a great hedge on my long book and it's done in a way where i'll roll it, pull it off, whatever.. it's not a core position in any capacity
- but it's already looking weak
- good luck holding this thing up. it wants to reset lower before it can make new highs is my armchair take (and tbh, this is secondary in my process anyway vs. the guys who just draw lines and "trust me bro" energy -- gl w that)
V
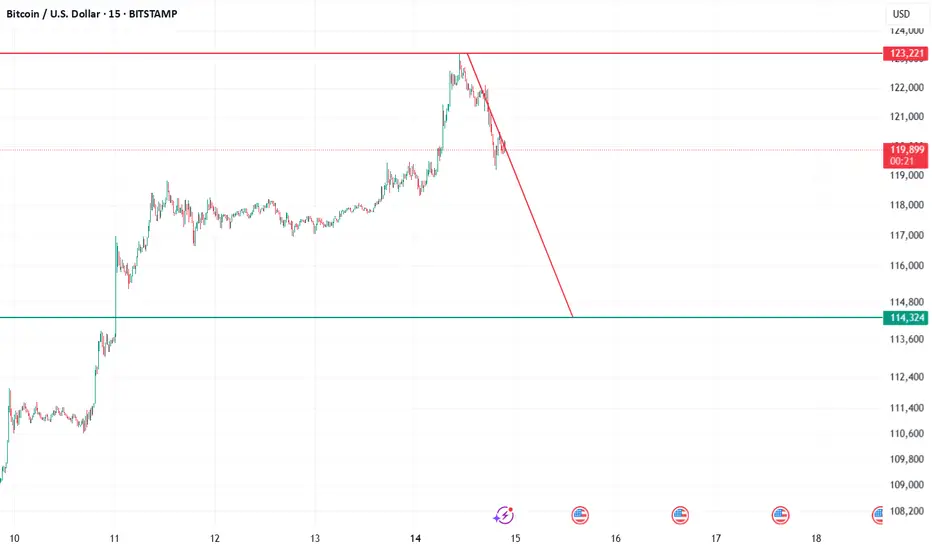
BTC SHORT FOR NOW?An all time high was achieved recently at around 123k USD. A number of buyers should potentially be liquidating their profits around this region, reducing buy pressure and ultimately leading to a short term pull back maybe close to around the 110's? Price action will have to reveal more information in order to see what happens after this movement.
HUGE BULL FLAG BREAKOUT with Stifel Coverage initiation at $5.Been preaching this for a couple years, but just pour through this chart with amazing fundamentals, Govt contracts, and $200M Indonesian contract... just lovely...

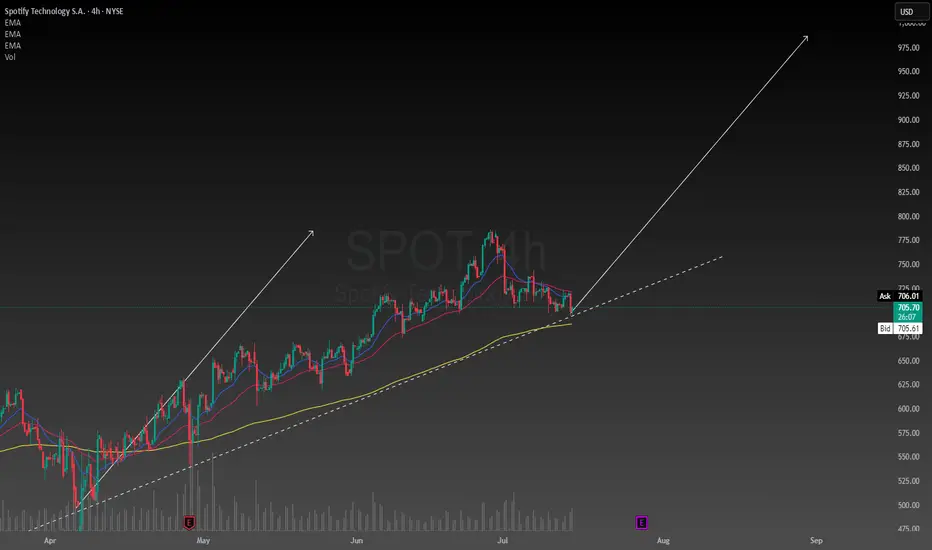
Raising the bar for SpotifySpotify has been my favorite stock so far this year. Primarily because resilience in uncertain economies. Subscription-based services, especially freemium models, are seen as defensive. Spotify is the number one music streaming service in the world and unless that changes people will keep using it every single day in their lives.
They will generate revenues based on advertisements and subscriptions which are in my opinion reasonable and conducive of a strong business model. I am raising my price target to $985. This is not unreasonable considering the intrinsic value of the stock is between $400 and $2900. I am confident Spotify will find ways to stay ahead of its competitors and dominate the music streaming industry. While keeping its customers happy and loyal.
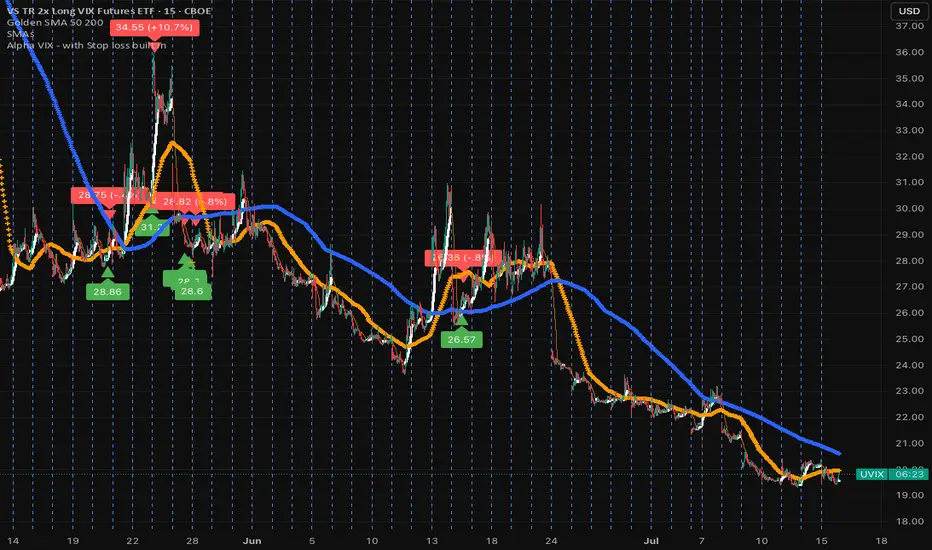
Consolidation taking place...VIX primed to spike soonBeen following the VIX for a while now, and it seems like the party will end pretty soon. Japan's yield is exploding and no one is talking about it (i.e., implications to US) and CNBC is celebrating small wins completely avoiding talking about bank's unrealized losses at historic levels and what impacts 90% of Americans, like tariffs that are only going to get worse. Keep an eye on the VIX as at its lows right now and creeping up, until it shoots up like a rocket, which it has done historically since 1993.
Best of luck!
Daily Market Outlook. 16.07.2025, CPI dayGold Short and NQ order flow explained. Along with the Dollar Index

XAUUSD Expecting bullish Movement Gold is showing potential for a bullish reversal from the key support zone between 3390 to 3395. Price has formed a base in this range, and if it holds, we may see an upside breakout above the descending trendline
Buy Zone: 3390 – 3395
First Target: 3355.50
Second Target: 3380.50
A successful breakout and hold above the trendline resistance could trigger a move toward our short-term targets. Watch for bullish confirmation before entering. Manage risk accordingly

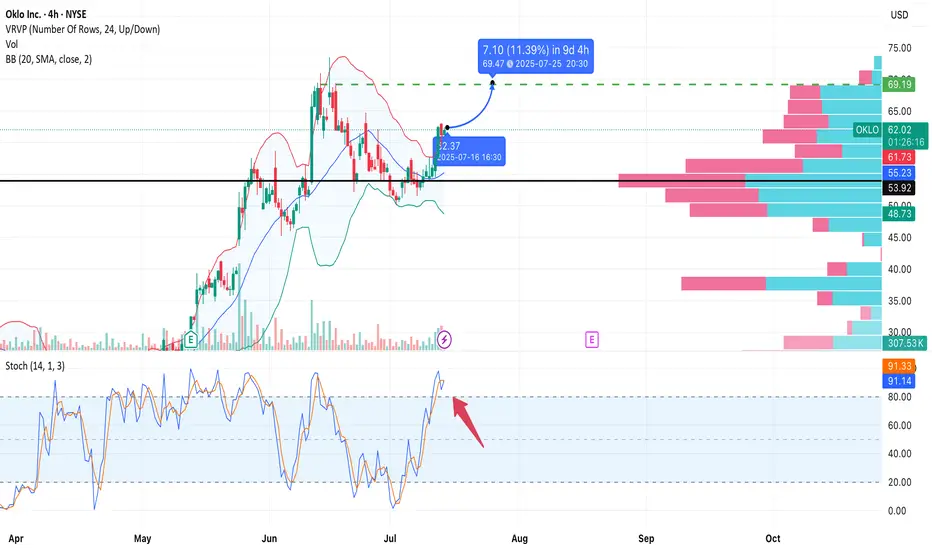
OKLO – Upside Potential Ahead of EarningsNYSE:OKLO
Type: Swing/positional
Timeframe: 4H
Style: No stop-loss, technically driven
Target: 69.50
Risk: Moderate (earnings volatility risk)
Overview:
Oklo is forming a bullish continuation pattern after consolidating above the 55.00 support area.
The price has broken above the Bollinger Band basis and reclaimed the 61.78 resistance zone.
Stochastic shows overbought conditions, but the trend remains strong.
The volume profile reveals a low-resistance zone up to ~69.50, offering clean air for upward momentum.
Entry Zone:
• Entry near 62.2 (market price)
• The setup remains valid while price stays above ~61.5
• Upcoming earnings (July 19) may act as a catalyst
Target:
• Take Profit: 69.50
Expected move: +11%
No Stop? Then Watch Closely:
Soft invalidation if price breaks below 59.50 (4H close)
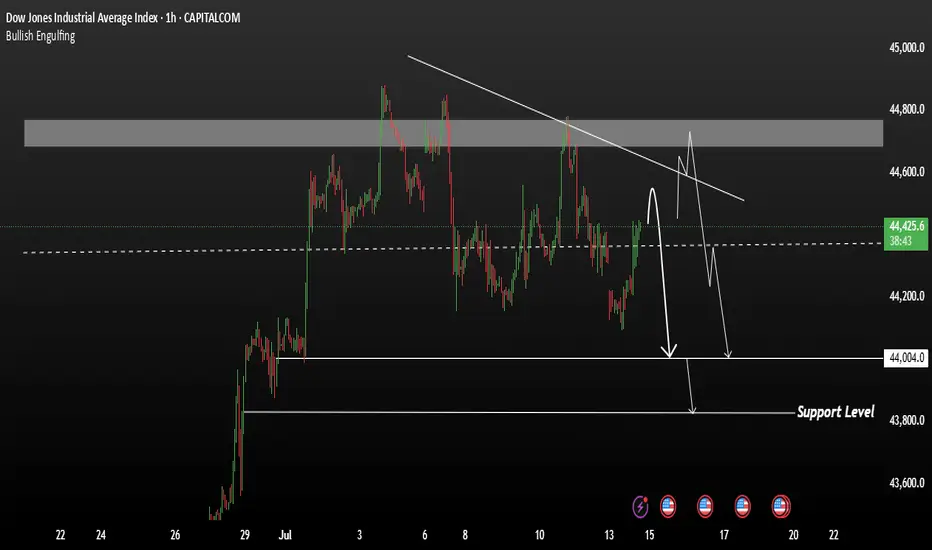
US30 Price close below Bullish reversal Then drop to 43,800The US30 is currently in a consolidation phase after a strong bullish rally, but is now showing signs of weakness. The index is facing resistance near 44,700, and as long as the price remains below this level, the bearish correction is expected to continue.
If the price fails to break above 44,700 and closes below this resistance, we could see a push toward the support zones at 44,004 and 43,800. A bullish reversal may only be considered if the price successfully holds above 44,700 on a strong candle close.
For now, bearish bias remains intact unless a confirmed breakout occurs above key resistance.
Ps Support with like and comments for more better analysis share with you Thanks for Supporting.
XAUUSD Expecting bullish Movement Price has now entered a strong demand zone between 3310 to 3305, as highlighted on the chart. This area has previously acted as a key support, and current price action indicates potential for a bullish reversal.
Structure Breakdown
Wave A Strong bearish leg
Wave B Minor consolidation
Wave C Final push into demand zone (3310–3305)
Buy Entry Zone: 3310–3305
First Target: 3365
Second Target: 3380
Risk Management is essential. Always use stop loss based on your strategy

YTD Performance: Large NBFIs of CSE vs. ASI & LOFCOverview
All major Non-Bank Financial Institutions (NBFIs) listed on the Colombo Stock Exchange (CSE) have significantly outperformed the All Share Index (ASI) in Year-to-Date (YTD) terms—with one exception.
YTD Returns (2025)
Institution / Index | YTD Performance
----------------------------------------------
ASI 37%
COCR 127%
CFIN 93%
LFIN 66%
PLC 64%
LOFC -1.47%
Underperformance of LOFC
LOLC Finance (LOFC), the largest NBFI on the CSE, not only underperformed its sector peers but also delivered a negative return of -1.47%, diverging sharply from the broader market trend.
While the divergence was visible since Feb. 2025, underperformance during recent months probably due to share buyback executed at LKR 6.
Sector Tailwinds
The NBFI sector's strong performance is largely attributed to the anticipated revival of the vehicle leasing segment, following the government’s decision to permit vehicle imports. This policy shift has fueled investor optimism across the financial leasing landscape.
Strategic Implication
Given its scale and market position, LOFC should theoretically be the primary beneficiary of this resurgence.
Will there be a catch-up trade?
As buy back is now closed, we should pay close attention for a Catchup trade opportunity together with other shares of the group.
