ETH - BTC ETF News: What It Means for the Market+ China Rumors 🚨 ETH - BTC ETF News: What It Means for the Market + China Rumors 💥🌐
July just ended with a crypto bombshell 💣 — and the market is barely reacting.
Let’s break it down:
🧠 One part hard news.
🌀 One part geopolitical smoke.
🎯 All parts worth watching if you care about macro market shifts.
🏛️ SEC Approves Real BTC & ETH for ETF Flows (July 29)
Say goodbye to the cash-only ETF model.
The SEC now allows direct in-kind creation/redemption of Bitcoin and Ethereum in ETFs.
That means providers like BlackRock, Fidelity, VanEck can now use actual BTC/ETH, not just synthetic tracking.
✅ Bullish Impact:
💰 Real Spot Demand: ETF inflows = real crypto buying
🔄 Efficient Arbitrage: No middle step via cash = faster flows
🧱 TradFi + Crypto Merge: ETFs now settle with crypto — not just track it
🎯 Better Price Accuracy: Spot ETFs reflect true market value more cleanly
📉 The market reaction? Mild.
But don’t get it twisted — this is a structural reset, not a meme pump.
⚠️ But There’s a Bearish Angle:
🏦 Centralized Custody: Crypto now lives in Coinbase, Fireblocks vaults
⚠️ Network Risks: ETF performance now tied to ETH/BTC uptime
🧑⚖️ Regulatory Overreach: More hooks into validator networks, MEV relays
🌊 Volatility Risk: Panic redemptions = real BTC/ETH sold into open markets
Still, this is good news for Ethereum in particular.
Why? Because ETH isn’t just money — it’s infrastructure.
And now Wall Street is finally using it, not just watching it.
🇨🇳 And Then There’s China… Rumor or Tumor?
Crypto Twitter is swirling with unconfirmed whispers from July 29 that China may be prepping a major Bitcoin statement ahead of the BRICS summit.
But let’s be clear:
🚨 It’s a rumor. Or a tumor. 🧠
And like many tumors in crypto — there’s a 40% chance it brings bad news. 🤕
Still, here’s what’s being floated:
🧠 Speculations Include:
🔓 BTC re-legalization in “special finance zones” (HK-style)
🏦 BTC in national reserves (!)
🤖 CBDC integration or smart contract interoperability
⚒️ Return of official state-backed Bitcoin mining
🧯 But no official sources. Just geopolitics + timing.
China’s FUD/FOMO pattern is Bitcoin tradition — don’t get trapped by hopium.
But if even half of it is true... buckle up.
📈 Ethereum Leads the Charge — But Watch These Alts:
If ETFs go fully crypto-native, some sectors light up 🔥
🔹 1. Ethereum Layer 2s (ARB, OP, BASE)
→ ETF gas pressure = L2 scaling demand
🔹 2. DeFi Protocols (UNI, AAVE, LDO)
→ TradFi liquidity meets on-chain utility
🔹 3. ETH Staking Derivatives (LDO, RPL)
→ Institutions want yield = LSD narrative grows
🔹 4. Oracles (LINK)
→ ETFs need trusted on-chain data = Chainlink shines
🔹 5. BTC on ETH Bridges (ThorChain, tBTC)
→ If BTC flows into ETH-based ETFs, bridges light up
🚫 What I will Avoid:
❌ Memecoins – zero relevance to ETF flows
❌ GameFi – not part of TradFi’s roadmap
❌ Ghost Layer 1s – no users, no narrative, no pump
🧠 My Take:
ETH is building momentum toward $4,092 — the third breakout attempt on your 1-2-3 model.
🔥 The fuse is lit. Target? $6,036
Timing? Unknown. But structure is in place.
Meanwhile, Bitcoin Dominance is rising.
ETH is shining.
Solana — while powerful — continues paying the price for memecoin madness 💀
We’re entering a new phase — where ETFs settle with real crypto , China watches the stage, and macro money is warming up behind the curtain.
So stack smart.
Study the flows.
Don’t let silence fool you — the biggest moves come after the news fades.
One Love,
The FX PROFESSOR 💙
Disclosure: I am happy to be part of the Trade Nation's Influencer program and receive a monthly fee for using their TradingView charts in my analysis. Awesome broker, where the trader really comes first! 🌟🤝📈
Fundamental Analysis

The Unicorn Breakout – Regression, Madness & Meme Math🦄 The Unicorn Breakout – Regression, Madness & Meme Math
FX_Professor | July 14, 2025
🎨 Welcome to my world…
Some draw straight lines.
I draw quadratic regression channels, alien spirals, and unicorns.
Because sometimes, the market is not just math — it’s emotion, storytelling, and madness therapy.
This chart isn’t just analysis. It’s a prophecy. It’s a canvas.
It’s for the traders who still feel.
📈 What are we looking at?
🧠 The Setup:
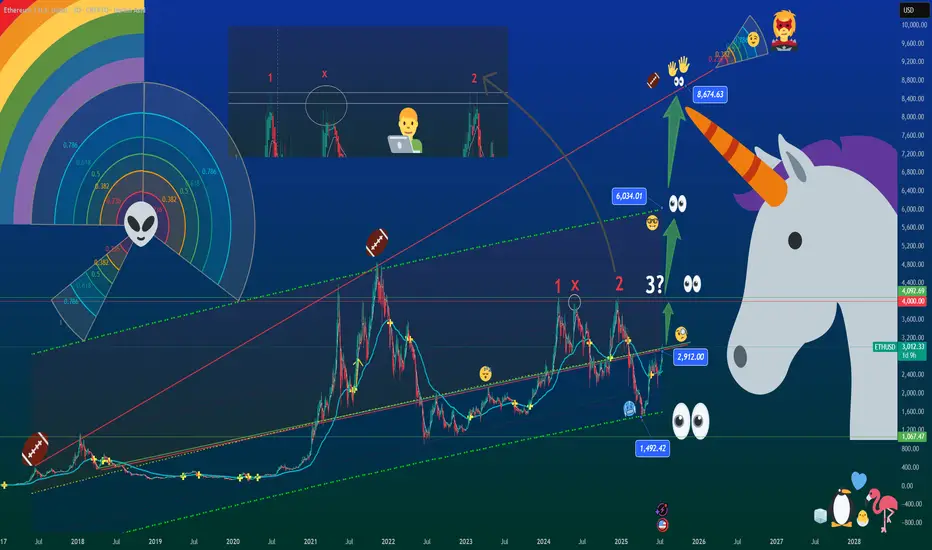
- Quadratic Regression Channel: Anchored from the 2018 top, respected for over 7 years. ETH is bouncing off the midline like it heard destiny calling.
- Major Resistance: The $2,900–$3,100 zone is our historic ceiling. Marked as 1 – X – 2… and next, not maybe but SURELY the decisive number3? 🚨 (X stands for 'no touch' ie 'close but no cigar' - Look at my recent BTC 1-2-3 breakout posts!)
- My Golden Cross: Quietly forming support. Check that xx/Xxx Secret EMA crossover. Setup reserved as a little family secret destined to be passed on to my sons (and some of you!).
- Alien Spiral (not Fib 😉 ): A colorful vortex leading us toward areas of re-accumulation and expansion. ETH is now riding the 0.382 arc — and you know what that means...
🚀 Targets:
- $4,000 — First milestone and zone of psychological resistance
- $6,034 — Mid-regression line + historical extension
- $8,674 — Unicorn Target Zone. Meme ATH + Euphoric breakout + Regression logic
👽 The Floor:
$1,067 – $1,492 — Alien Support Range™. If we nuke, that’s where we land, in pain. That's when we apply for jobs at Taco Bell (at least i love the food there, i am prepared for that scenario too).
🦇✨ Ethereum Community — this might be your time.
Dear ETH fam...
This isn't hopium.
This is regression math meeting Breakout Structure.
ETH has reclaimed key levels, rotated capital is flowing, and Bitcoin dominance is peaking. . WAIT FOR MY ETHBTC ANALYSIS (ON SUPPORT AND REBOUNDING)
The Unicorn doesn't knock twice.
If Ethereum Season is real — this chart might age beautifully.
🤹 Why the chaos?
Because markets are art.
Because crypto is culture. (and yes it's also 90% shit, you will hear a lot about that when that time comes).
Because every emoji here has meaning:
🦄 = Imagination
👀 = Momentum watchers
👽 = Alternative thinking
🏈 = Painful resistances, mental and physical toughness builds champions. Patience Wins!
🥶 = Cold accumulation
🧑💻 = Professor mode
🐧❤️🔥🐤🦩 = Read below…
🧊 The Penguin Message
Bottom right, you’ll see a penguin family :
A penguin, a flamingo, a baby chick, and a blue heart.
That’s not just decoration — it’s the real alpha.
💙 The best blockchain is YOU.
👶 The best altcoins are your CHILDREN.
🧊 The best staking is your FAMILY.
Trade smart. Build cool stuff. But don’t forget to be a good human.
The charts will wait. But your people won’t.
Spend time wisely: Learn skills, invest in YOURSELF, enjoy moments with loved ones, make others smile, be that change in the world.... and if you don't have kids then what on earth are you doing?? Go get laid, now! You are ready, stop thinking, just Do It (disclaimer: unless you have 5 already, in that case pls invest in condoms)
Share this with someone who needs to see this. Or just save it as 'ETH season'.
FX Professor — out.
🦄📈👁️
#ETH #Ethereum #UnicornBreakout #CryptoArt #QuadraticRegression #Altseason #TradingView #ChartTherapy #BeAGoodHuman
USDJPY Forming Bullish Reversal | MMC Analysis + Target🧠 Chart Overview (2H Timeframe)
🔸 1. Head and Shoulders Inverse Pattern – MMC Bullish Blueprint
The chart beautifully shows an Inverse Head & Shoulders pattern, one of the most powerful reversal signals under MMC logic:
Left Shoulder: Formed after the initial drop and quick recovery.
Head : Deep liquidity grab and reversal from the lowest point (demand zone).
Right Shoulder: Higher low structure, indicating reduced selling pressure and shift in momentum.
This pattern is forming around a previous liquidity zone, which makes it more valid and aligned with smart money behavior.
🔸 2. Retesting Zone – Critical MMC Demand Area
Price is now retesting a highlighted demand zone, which acted as the springboard for the previous bullish move:
Bullish Pattern marked aligns with MMC’s concept of “Return to Origin”.
This zone also sits just above the right shoulder, confirming that buyers are defending aggressively.
If this level holds, we may see a strong continuation move to the upside.
🔸 3. Previous Reversal Zone (Supply) – Next Target Area
Marked in light green, this area is the next critical resistance:
Acts as liquidity target for institutions if price rallies.
Historically acted as a major reversal point.
Price is likely to show reactions or profit-taking behavior here.
Once broken and retested, it becomes a new support for further upside continuation (as marked on the chart).
🔸 4. Dual Scenarios – Bullish vs Bearish Pathways
Your chart correctly outlines two strategic possibilities:
✅ Bullish Scenario:
Price respects demand zone.
Breaks above previous reversal zone (149.000+).
Bullish continuation toward 149.800–150.500 range.
MMC tip: “If it goes bullish, use previous demand or double it” = Add confluence or stack demand zones for scale-in entries.
❌ Bearish Scenario:
If price breaks below retesting zone, bullish invalidation triggers.
Look to the previous all supply zone (Zone Pattern Must) for next reaction.
This scenario reflects smart money rejection of upside continuation.
🗂️ MMC Structural Elements Identified:
Zone/Pattern Role in Analysis
Inverse H&S Trend reversal signal
Retesting Zone Demand/entry area
Previous Reversal Zone First key resistance / next liquidity pool
Supply Zone Below Target in case of downside breakdown
MMC Logic Follow price structure, fakeouts, demand/supply traps
📈 Summary Outlook:
USDJPY is showing a technical bullish structure backed by MMC-based price psychology. The current pullback into a demand zone gives traders an excellent R:R opportunity for long positions, targeting higher zones upon breakout confirmation.
🟩 If bullish, breakout >149.000 will likely lead toward 150.000+
🟥 If bearish, breakdown <147.600 opens doors to deeper drop toward 146.000 zone (watch for reversal pattern).
🔑 Key Levels to Watch:
Type Level Range Notes
Support 147.600–147.800 Current retesting demand
Resistance 148.800–149.300 Previous Reversal Zone (Profit booking area)
Higher Resistance 150.500+ Final upside objective
Breakdown Zone <147.500 Flip to bearish scenario

USDJPY – Liquidity Grab Before Continuation Down
**📉 USDJPY – Liquidity Grab Before Continuation Down**
📍 *Update to previous publication*
Following further technical analysis, the current price action suggests a **short-term bullish move** on USDJPY — likely acting as a **liquidity grab over previous session highs**.
This corrective movement is expected **before price resumes its broader bearish direction**.
🔍 Key observations:
* Price may seek short-term buy-side liquidity above recent highs.
* Liquidity engineering likely, especially around the **148.800 zone**.
* My **bias remains bearish**, but only **after liquidity is taken** and structure confirms a reversal.
Waiting for signs of exhaustion or confirmation around the upper FVG to align with the primary short thesis.
---DO NOT USE AS SIGNAL OR ANY OF A KIND--
EMERSON MASSAWE
COO | FINANCIAL MARKET ANALYST 6+


BA: Boeing down on better than expected results! 30-07-2025Yesterday we get Boeing earnings report which came better than expected, but the stock down more than 4% as the company is not expected to make positive profit or free cashflow before 2026. No dividends currently paid, so there is nothing attractive to me now.
Disclaimer: This content is NOT a financial advise, it is for educational purpose only.

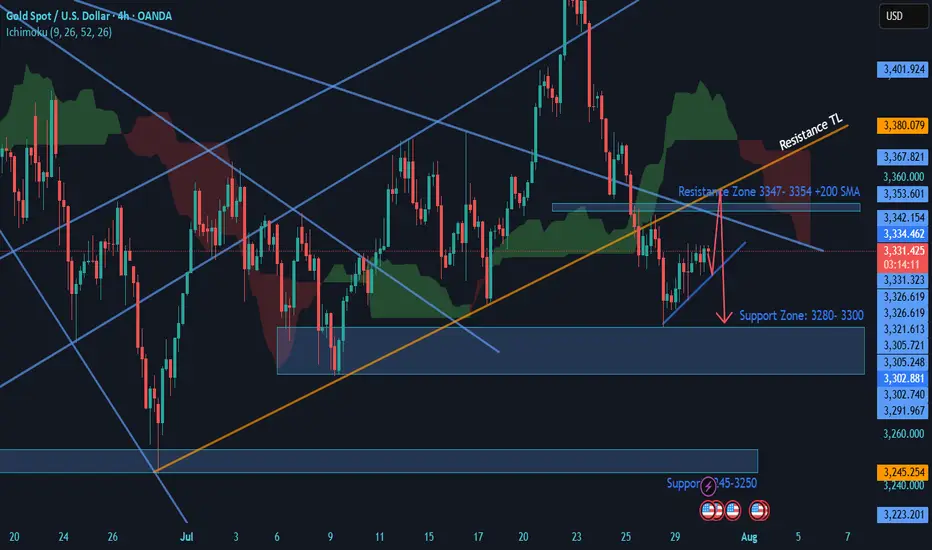
Gold holds Bearish Structure- SELLGold: Price is Exhibiting Head & Shoulders Strcure on 4H & 1 H chart. 4 H chart is Bearish, Daily chart is Neutral to bearish. Price is under the IChimuku Cloud in 4 H.
Daily chart is forming a death cross (20 SMA cutting 50 SMA) which might be completed in 1 day or Two.
Currently Gold is trying to recover losses and on retracement journey. I am expecting Price to test the 3347-3354 Zone of resistance where 4H 200+100 SMA + TL resistances+ Structure resistance will likely to Push price back to 3320 & 3300 Support Zone.
If price breaks the 3300 level. Then this daily candle break may take price to 3280 Support Level.
Good Luck
Market Analysis: USD/CHF Consolidates GainsMarket Analysis: USD/CHF Consolidates Gains
USD/CHF is rising and might aim for a move toward the 0.8120 resistance.
Important Takeaways for USD/CHF Analysis Today
- USD/CHF is showing positive signs above the 0.8040 resistance zone.
- There is a connecting bullish trend line forming with support at 0.7990 on the hourly chart.
USD/CHF Technical Analysis
On the hourly chart of USD/CHF at FXOpen, the pair started a decent increase from the 0.7910 support. The US Dollar climbed above the 0.8000 resistance zone against the Swiss Franc.
The bulls were able to pump the pair above the 50-hour simple moving average and 0.8040. A high was formed at 0.8079 and the pair is now consolidating gains above the 23.6% Fib retracement level of the upward move from the 0.7911 swing low to the 0.8079 high.
There is also a connecting bullish trend line forming with support at 0.7990. On the upside, the pair is now facing resistance near 0.8080. The main resistance is now near 0.8120.
If there is a clear break above the 0.8120 resistance zone and the RSI remains above 50, the pair could start another increase. In the stated case, it could test 0.8200. If there is a downside correction, the pair might test the 0.7990 level.
The first major support on the USD/CHF chart is near the 0.7950 level and the 76.4% Fib retracement level.
The next key support is near 0.7910. A downside break below 0.7910 might spark bearish moves. Any more losses may possibly open the doors for a move towards the 0.7850 level in the near term.
This article represents the opinion of the Companies operating under the FXOpen brand only. It is not to be construed as an offer, solicitation, or recommendation with respect to products and services provided by the Companies operating under the FXOpen brand, nor is it to be considered financial advice.

Market Analysis: EUR/USD Dips FurtherMarket Analysis: EUR/USD Dips Further
EUR/USD extended losses and traded below the 1.1600 support.
Important Takeaways for EUR/USD Analysis Today
- The Euro struggled to clear the 1.1800 resistance and declined against the US Dollar.
- There is a key downward channel forming with resistance at 1.1575 on the hourly chart of EUR/USD.
EUR/USD Technical Analysis
On the hourly chart of EUR/USD at FXOpen, the pair failed to clear the 1.1800 resistance. The Euro started a fresh decline below the 1.1720 support against the US Dollar.
The pair declined below the 1.1660 support and the 50-hour simple moving average. Finally, it tested the 1.1520 level. A low was formed at 1.1519 and the pair is now consolidating losses. The market is showing bearish signs, and the upsides might remain capped.
There was a minor increase toward the 23.6% Fib retracement level of the downward move from the 1.1770 swing high to the 1.1519 low. Immediate resistance on the upside is near the 1.1575 level.
There is also a key downward channel forming with resistance at 1.1575. The next major resistance is near the 1.1665 zone and the 50-hour simple moving average or the 50% Fib retracement level.
The main resistance sits near the 1.1770 level. An upside break above the 1.1770 level might send the pair towards 1.1800. Any more gains might open the doors for a move towards 1.1850.
On the downside, immediate support on the EUR/USD chart is seen near 1.1520. The next major support is near the 1.1465 level. A downside break below 1.1465 could send the pair towards 1.1350.
This article represents the opinion of the Companies operating under the FXOpen brand only. It is not to be construed as an offer, solicitation, or recommendation with respect to products and services provided by the Companies operating under the FXOpen brand, nor is it to be considered financial advice.

Fundamental Market Analysis for July 30, 2025 EURUSDEvents to watch today:
30.07 15:30 EET. USD - Gross Domestic Product
30.07 21:30 EET. USD - FOMC Rate Decision
EURUSD:
Exclusive for our readers – a 202% bonus on deposits of $202 or more! Give the promo code PROFIT202 to customer support and start trading with TRIPLED capital.
EUR/USD remains under pressure amid stronger demand for the US Dollar ahead of the Federal Reserve decision (July 30, 2025). Market sentiment reflects the perception that the recent US–EU trade arrangements are relatively more favorable for the US economy, reinforcing expectations for stronger corporate earnings and a more supportive external balance in the coming months. Capital flows are skewed toward dollar-denominated assets, also because investors prefer to wait out key central‑bank communications in “quality” instruments.
A further driver is the divergence in macro momentum: the US economy shows greater resilience in consumption and labor markets, while the euro area faces constrained growth and a cautious ECB tone. With little reason for ECB tightening and with lingering risks for European industry and exports after tariff headlines, the euro’s fundamental support looks softer. Persisting uncertainty around the inflation path in the euro area adds to the preference for the USD.
Given these factors, the near‑term fundamental tilt remains to the downside for EURUSD. Risks to this view include unexpectedly dovish Fed communication, a pullback in US Treasury yields, and/or positive euro‑area data surprises that could improve growth expectations and support the euro.
Trading recommendation: SELL 1.15650, SL 1.16000, TP 1.15150

XAUUSD Outlook – July 29, 2025
Gold enters a high-risk environment starting today.
All eyes are on Jerome Powell's speech, which will signal whether the Fed remains firm on its hawkish stance or adopts a more dovish tone.
📈 That said, a broader look at the chart suggests the market has already aligned itself with the dominant trend.
🗓️ In addition to today’s speech, tariff-related news expected on Friday doesn’t seem likely to disrupt the ongoing bullish momentum in gold — or in crypto markets, for that matter.
🧠 That’s the general market read I'm sensing right now, but we’ll have to see how it unfolds.
🎯 Personally, I still view the $3290 level as a solid buy zone, with the potential to become one of gold’s historical bottoms.

BTCUSD Analysis : Blue Ray + MMC Bullish Scenario + Target Zone🟢 Today’s BTCUSD Analysis (MMC) – Strategic Insight into Institutional Behavior 💪
📊 Chart Breakdown: Understanding Price Through MMC
This 4H BTCUSD chart highlights critical behavior using Mirror Market Concepts (MMC) — where smart money traps, fakes, and flips market participants to create directional moves. Let’s break down the scenario:
🔸 1. Fakeout Zone – Smart Money Trap
Price initially surged to a local high, triggering a bullish fakeout, as shown in the green rectangle.
This move is designed to lure in breakout buyers above resistance, only to reverse sharply.
The sudden drop confirms smart money liquidation, catching retail longs off-guard.
A perfect example of a liquidity grab before shifting back into range.
📌 Fakeouts often mark the beginning of a new range or reversal setup in MMC methodology.
🔸 2. Blue Ray – Trend Continuation Structure
The consolidation after the fakeout forms the Blue Ray pattern, a recognizable trend continuation framework.
This structure signals smart money’s accumulation or re-accumulation phase.
Note how the price oscillates within the pattern, creating both lower highs and higher lows.
These compressions usually lead to explosive moves, either up or down, depending on liquidity build-up.
🔸 3. QFL – Quantity Following Line Event
Price briefly dips below the QFL level — another engineered stop-hunt to shake out premature longs and trap breakout sellers.
The reaction afterward shows strong buyer defense, confirming hidden demand.
MMC traders recognize this zone as a fake breakdown, setting up for the next trend wave.
🔸 4. Central Reversal Zone – The Decision Area
We’re currently hovering around the Central Reversal Zone, a key level of decision-making.
This is where liquidity from both buyers and sellers meets, making it a high-volatility zone.
Price could either:
(Scenario 1) Reject and fall lower to retest the trendline zone (marked with label 1).
(Scenario 2) Break above minor resistance and head toward the Next Reversal Zone (marked with label 2).
This structure aligns with MMC’s "Trap – Absorb – Break" cycle.
🔸 5. Major & Minor Resistance
Above the current price lies:
Minor Resistance (~$120,000): Immediate zone to clear for bullish continuation.
Major Resistance (~$121,000): Strong institutional supply, could act as the final hurdle before reversal.
If price clears these, BTC will likely target the Next Reversal Zone (~$122,500–123,500) for the next MMC reaction or short-term top.
🧠 Strategic Trade Outlook (MMC Logic)
✅ Bullish Playbook (Scenario 2):
Entry: Break and retest above $120,000 (Minor Resistance)
Confirmation: Hold above Central Reversal Zone with impulse
Target: $122,500–123,500 (Next Reversal Zone)
Risk: Close below $117,500 invalidates idea
🔻 Bearish Playbook (Scenario 1):
Entry: Rejection from $119,500–120,000
Target: Trendline support or prior QFL (~$116,000–115,500)
Invalidation: Clean 4H close above $120,500
📐 Key Concepts in This Analysis
Fakeout Trap: Retail euphoria liquidation
QFL Sweep: Smart money’s liquidity grab below structure
Blue Ray: Compression structure before continuation
Reversal Zones: Institutional interest areas where reactions occur
SR Flip Zones: Level conversion confirms trend maturity
📈 Summary
BTCUSD is currently in a smart money-controlled environment, compressing near key structural levels. The next move will be large, and by applying MMC, we’re prepared for both bullish breakout and bearish retest scenarios.
Be patient — traps come before trends.

Gold is bullish Long TermLooking at the consolidation of Gold on a daily timeframe, you'd see that gold is still undecided on a reversal. I think that Gold would retest the uptrendline one last time...
What are your thoughts on this?

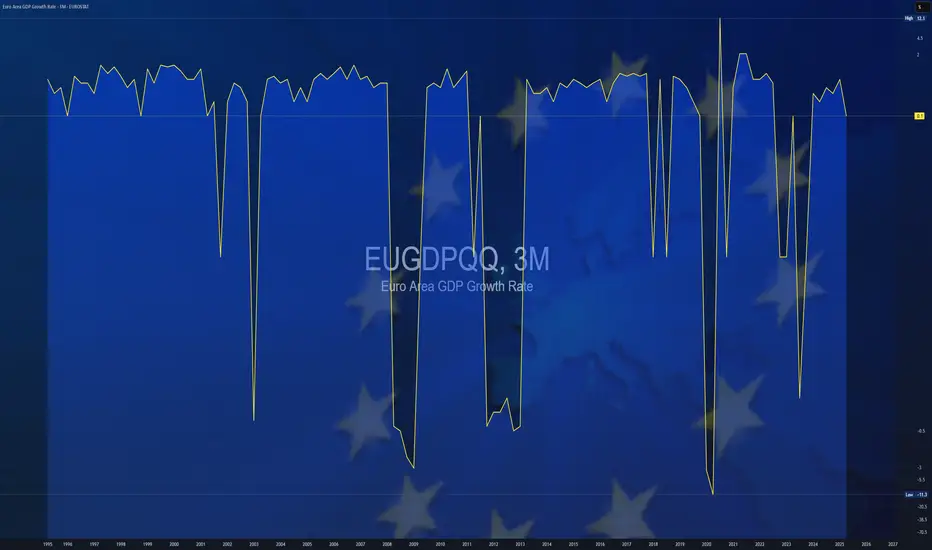
$EUGDPQQ -Europe GDP (Q2/2025)ECONOMICS:EUGDPQQ
Q2/2025
source : EUROSTAT
- The Gross Domestic Product (GDP) In the Euro-Area expanded 0.10 percent in the second quarter of 2025 over the previous quarter.
GDP Growth Rate in the Euro Area averaged 0.37 percent from 1995 until 2025, reaching an all time high of 11.60 percent in the third quarter of 2020 and a record low of -11.10 percent in the second quarter of 2020.
GOLD (XAUUSD) Analysis : Major Break + Bullish Setup + Target🟩 Today’s GOLD Analysis based on Volume Behavior, Smart Money Traps & Market Structure (MMC)
🔍 Chart Breakdown and MMC Concepts Explained:
1. Preceding Downtrend – Smart Money Trap Initiated
The chart begins with an extended downtrend, marking significant bearish pressure. However, deeper into the move, we notice price entering a Volume Absorption (VA) Zone — a key MMC signal where institutional orders quietly absorb aggressive retail selling.
This Volume Absorption Zone is highlighted on the left of the chart.
Smart money quietly positions longs here while inducing panic-selling from retail traders.
Wicks and indecision candles show early signs of sell exhaustion.
2. QFL Breakdown & Liquidity Sweep
The breakdown from the QFL (Quick Flip Level) is another hallmark of MMC behavior. The market intentionally breaks previous lows to trigger stop-loss clusters — known as a liquidity sweep or stop-hunt.
Price aggressively drops to a well-marked demand zone.
Massive bullish reaction from this zone confirms that smart money has completed accumulation.
The QFL move is not a true breakout, but a trap, designed to mislead retail into chasing shorts.
3. Demand Zone Reaction – Shift in Momentum
Price finds support at the demand zone (highlighted in green) and starts forming higher lows. This transition from lower lows to higher lows is a structural confirmation of market reversal.
Buyers have regained control.
Large bullish candles and wick rejections at key levels signal institutional entry.
4. SR Interchange Zone – Key MMC Confirmation
One of the most important zones on this chart is the SR Interchange area.
This level was previously resistance and is now acting as support — a concept known as support-resistance flip.
MMC teaches us that this is where smart money re-tests the breakout zone to trap late sellers and confirm the trend.
This zone is reinforced by:
Previous rejections
Retest with wicks
Alignment with ascending trendline support
5. Minor & Major Resistance Levels
Currently, price is attempting to break above a minor resistance at ~$3,330–3,332.
If it breaks, the next major target lies at the ~$3,340–3,345 level, marked on the chart.
This zone is crucial for short-term targets and may act as a profit-taking zone for early bulls.
Once this major resistance is cleared, the trendline projection suggests a continuation toward higher highs.
📐 Trendline Analysis
An ascending trendline is supporting price action. Each bounce off this line has led to higher lows — a clear sign of bullish intent.
Trendline + SR Interchange = Confluence zone
Traders should watch for bullish engulfing candles or strong wick rejections at this trendline area for re-entry or add-ons.
🧠 MMC Strategy Interpretation (Mirror Market Concepts)
This chart perfectly follows the MMC logic:
Trap retail sellers during the downtrend.
Absorb their volume at a key zone (Volume Absorp).
Sweep liquidity below QFL level.
Reverse structure with a shift to higher highs and higher lows.
Interchange SR zone to test buyers' strength.
Continue trend post-confirmation with breakout above resistance.
This is the classic "trap-to-trend" sequence smart money uses repeatedly in gold and other volatile markets.
✅ Trade Setup Summary:
Bias: Strongly Bullish (based on market structure shift)
Entry #1: Pullback into SR Interchange (ideal if price rejects 3,326–3,328)
Entry #2: Break and retest of Minor Resistance (3,332–3,334)
Targets:
TP1: 3,340 (Major Resistance)
TP2: 3,345–3,350 (Projection based on breakout path)
Invalidation: Clean break below trendline and demand zone (~3,318)
🧭 Final Words for Traders:
Gold is currently positioned at a critical junction where structure, volume, and institutional behavior all align. If you're following MMC strategies, this is a textbook scenario:
Trap ✅
Absorption ✅
Structure Shift ✅
Trendline Support ✅
SR Interchange ✅
Now, we wait for confirmation and execute with discipline.

AUD/USD part 2.my trading journal continued.
trend line of ascending triangle bottom appears to be holding. Road map still valid. looking for a entry point at end of 1 hour chart for leg up before a major downward move. (2 potential trades on the table).
remember today some big news out of US today. i final spike down on 5 minute is on the cards.

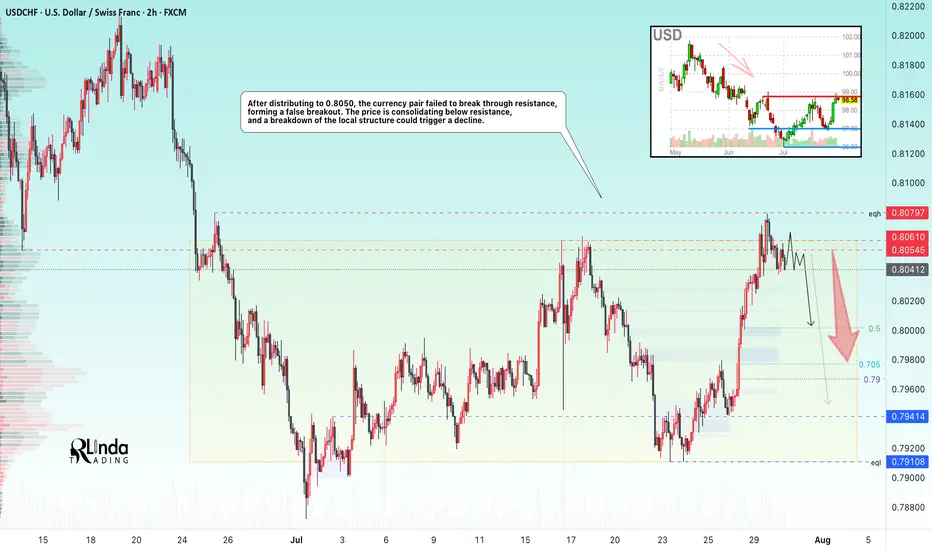
USDCHF → The resistance retest ended with a false breakoutFX:USDCHF tested resistance at 0.805 - 0.806 and formed a false breakout without the possibility of continuing growth. The global trend is downward...
Against the backdrop of the dollar's growth (reaction to news), the currency pair also moved to distribution to 0.8050. The price failed to break through resistance, forming a false breakout. USDCHF is consolidating below resistance, and a breakdown of the local structure could trigger a decline.
The dollar index is also facing fairly strong resistance and may continue its downward trend, which will also affect the decline in the USDCHF price.
Resistance levels: 0.805, 0.806, 0.81
Support levels: 0.800, 0.794, 0.791
If, within the current consolidation, the price begins to fall and break the local structure, then we can expect the decline to continue towards the specified targets!
Best regards, R. Linda!
Gold Market Builds Momentum Toward 3358 Supply ZoneGold market continues to build momentum gradually, with price action targeting supply mitigation at 3358.
The duration of this stance depends on whether price can clear this zone decisively; failure may lead to short-term consolidation before the next stance.comment ,boost idea and follow for more informed decisions on gold market

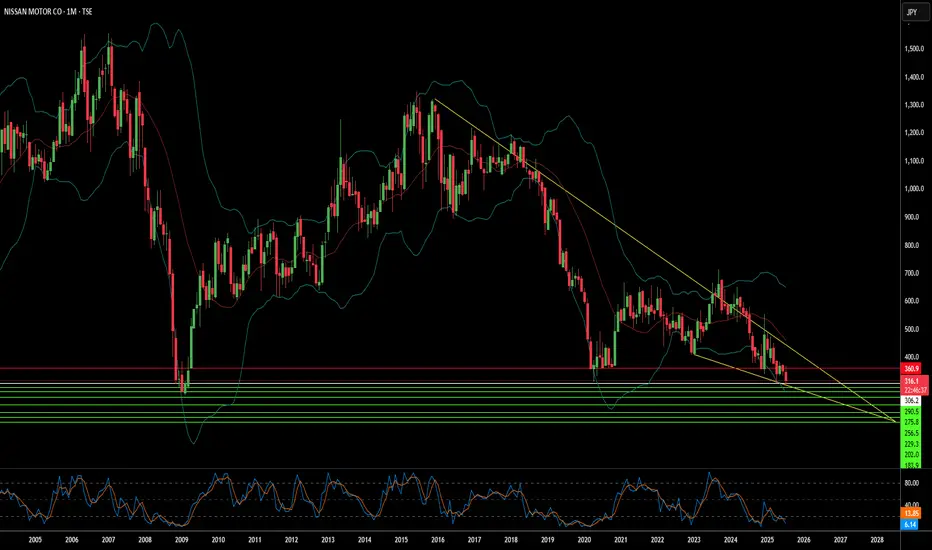
Is Nissan's Future Fading or Forging Ahead?Nissan Motor Company, once a titan of the global automotive industry, navigates a complex landscape. Recent events highlight the immediate vulnerabilities. A powerful 8.8-magnitude earthquake off Russia's Kamchatka Peninsula on July 30, 2025, triggered Pacific-wide tsunami alerts. This seismic event prompted Nissan to **suspend operations at certain domestic factories in Japan**, prioritizing employee safety. While a necessary precaution, such disruptions underscore the fragility of global supply chains and manufacturing, potentially impacting production targets and delivery schedules. This immediate response follows a period of significant operational adjustments as Nissan grapples with broader economic, geopolitical, and technological headwinds.
Beyond natural disasters, Nissan faces substantial financial and market share challenges. Although Fiscal Year 2023 saw operating profit and net income increases, global sales volume remained largely stagnant at 3.44 million units, signaling intensified market competition. Projections for Fiscal Year 2024 indicate a **forecasted revenue decline**, and recent U.S. sales figures show an 8% year-on-year drop in Q1 2025. Macroeconomic pressures, including inflation, volatile currency fluctuations, and a significant hit from **billions of dollars in lease losses** due to plummeting used car values, have directly impacted profitability. Geopolitical tensions, particularly the threat of a 24% U.S. tariff on Japanese auto exports, further threaten Nissan's crucial North American market.
Nissan's struggles extend into the technological arena and its innovation strategy. Despite holding a **remarkable patent portfolio** with over 10,000 active families, the company faces criticism for **lagging in electric vehicle (EV) adoption** and perceived technological stagnation. The slow rollout and underwhelming market impact of new EV models, coupled with a notable absence in the booming hybrid market, have allowed competitors to gain significant ground. Moreover, the brand has contended with **multiple cybersecurity breaches**, compromising customer and employee data, which damages trust and incurs remediation costs. Internal factors, including the lingering effects of the **Carlos Ghosn scandal**, management instability, and costly product recalls—like the recent July 2025 recall of over 480,000 vehicles due to engine defects—have further eroded investor confidence and brand reputation. Nissan's journey ahead remains uncertain as it strives to regain its competitive edge amidst these multifaceted pressures.
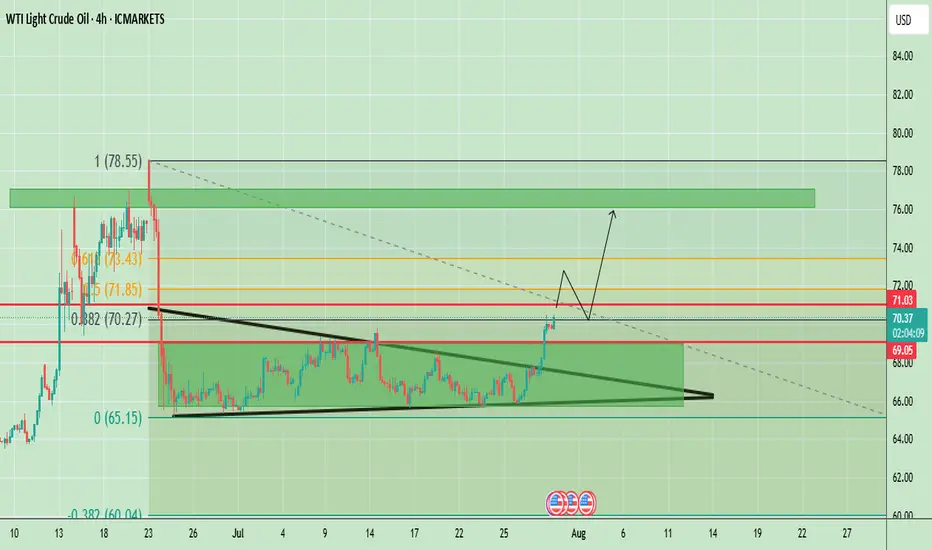
WTI Crude Oil Breaks Out of Symmetrical Triangle, $73-$76 ZoneThe WTI Crude Oil chart shows a strong breakout from the symmetrical triangle pattern that was forming for several weeks. Price has decisively broken above the descending resistance trendline and is now testing the $70–$71 area, which aligns with the 0.382 Fibonacci retracement level (around $70.27) and an important horizontal resistance ($71.03). This breakout indicates strong bullish momentum, supported by the recent series of higher lows and a sharp upward move in recent sessions.
If price sustains above $69.05 (previous breakout zone), we could see a bullish continuation towards $73.40 (0.118 Fibonacci) and potentially to $76.00–$76.50, which is the upper resistance block marked on the chart. However, if the price fails to hold above $69.00, there could be a pullback to retest the broken triangle resistance around $67–$68 before any next bullish leg.
Weekly Chart
The weekly chart of WTI Crude Oil is showing a long-term downtrend channel, where price has been consistently making lower highs and lower lows since mid-2023. Currently, oil is trading around $69.96, showing a sharp bullish push of 6.13% for the week. However, the price is still inside the broader descending channel, which keeps the long-term trend bearish unless a confirmed breakout occurs.
Key Resistance Levels:
- $70.27, $71.03, $73.43
Support Levels:
- $69.05 (previous breakout zone)
- $67.00–$68.00 (triangle retest area)
Trend Outlook:
- Short-Term: Bullish momentum; pullbacks likely to hold above $69.05.
- Medium-Term: If $71.85 breaks, price may target $76.00–$76.50 resistance.
Note
Please risk management in trading is a Key so use your money accordingly. If you like the idea then please like and boost. Thank you and Good Luck!
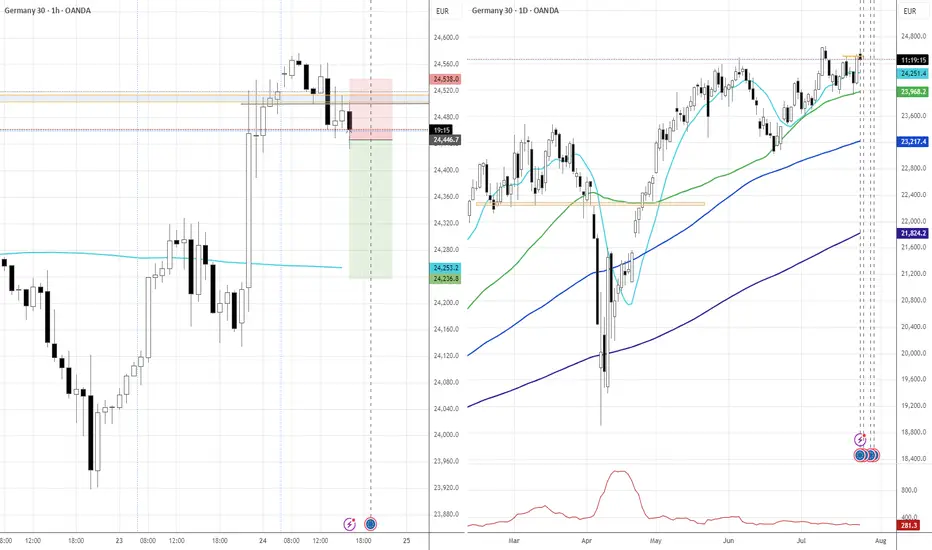
DAX 24.07.2025~+ Post-trade deal risk-on seems to be subsiding
~+ Profit taking towards the ECB Rate decision
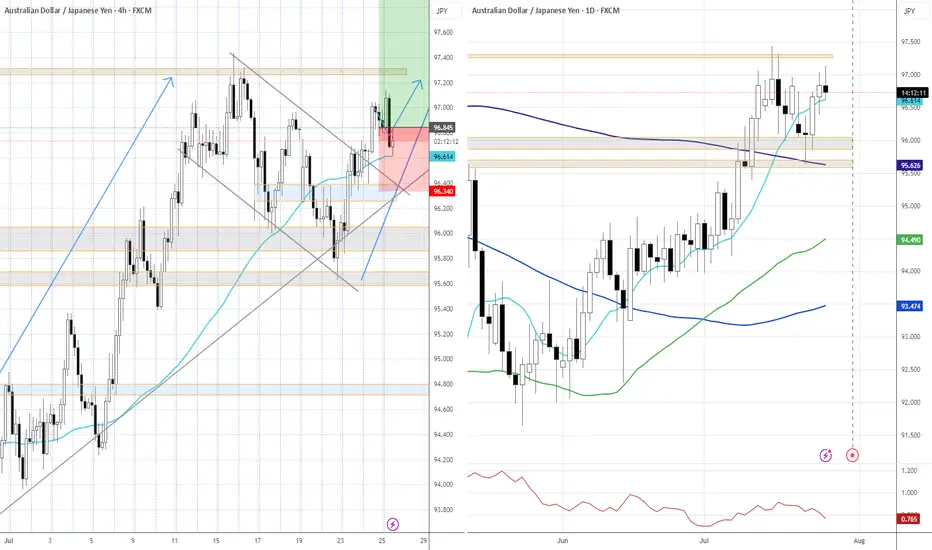
AUDJPY 24.07.2025+~ RBA is relatively hawkish
+~ Political uncertainty around JPY
+~ Positive trade deals anticipation
*Swing trade; giving a room for a reasonable pullback; will potentially look to scale in at the resolve of a newly-formed structure.