Gold to continue downward trendXAUUSD 1H chart post-CPI data: Current trend suggests a drop to 3,282 from 3,349.54. Watch support at 3,341-3,349; a break below could confirm. #Gold #Trading #XAUUSD #CPI
Fundamental Analysis

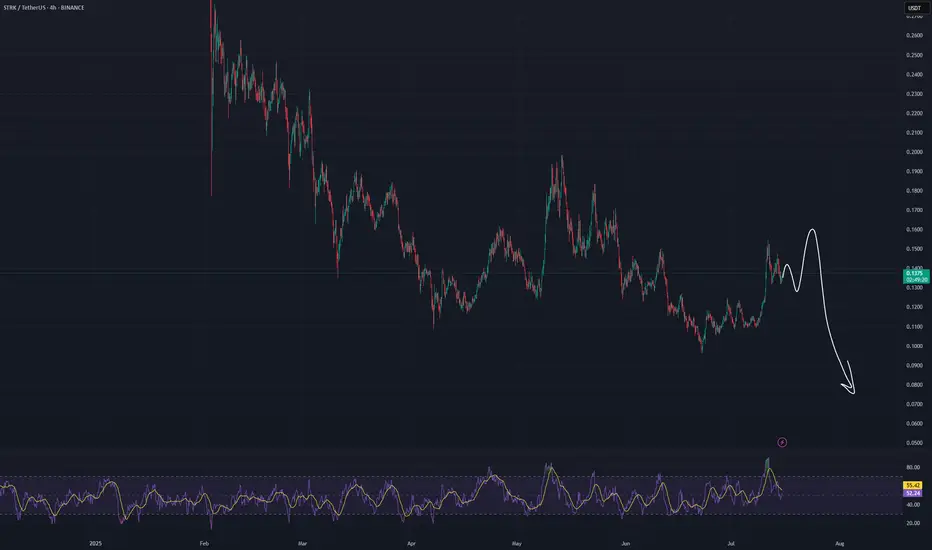
#STRK/USDT - SHORTI expect a decrease in the asset within a month.
(Not an investment recommendation).
GBP/USD still under pressure despite slightly weaker US core CPIThe US dollar, which had gained ground last week, was under a bit of pressure earlier today. And following a mixed inflation report, the greenback spiked before returning to pre-CPI levels. The inflation report hasn’t changed market’s perception about the likely path of interest rates.
US CPI comes in mixed
June’s CPI rose 0.3% MoM and 2.7% YoY—hotter than the prior 2.4% and above the 2.6% consensus. However, core CPI was a touch weaker, rising 0.2% m/m instead of 0.3%, while the y/y rate was 2.9% as expected.
The mixed CPI report means concerns that inflation may persist longer haven’t changed. The Fed may still delay or reduce the scope of any rate cuts, even if a September move is still on the table.
Adding to the dollar’s appeal, President Trump floated steep tariffs—35% on some Canadian goods and up to 30% on imports from Mexico and the EU—if deals aren’t reached by August 1. These protectionist signals and Trump’s expansive fiscal stance could further stoke inflation, supporting the greenback if confidence in US monetary policy holds.
Pound under pressure
Sterling has had a rough start to the week, extending last week’s 1% drop in GBP/USD before rebounding slightly earlier today. The pound's slide follows a run of soft UK economic data, boosting expectations for a Bank of England rate cut—likely in August. On Friday, data confirmed a second consecutive monthly contraction in the UK economy, driven by a worsening manufacturing slump. This has added to speculation that weakening growth and a stronger pound could help ease imported inflation, especially ahead of Wednesday’s UK CPI release.
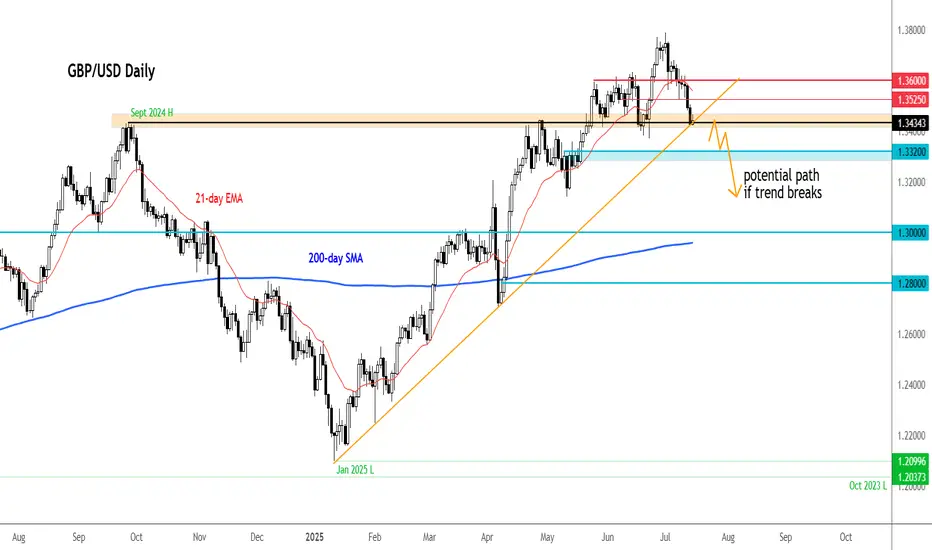
Technical picture and key data ahead for GBP/USD
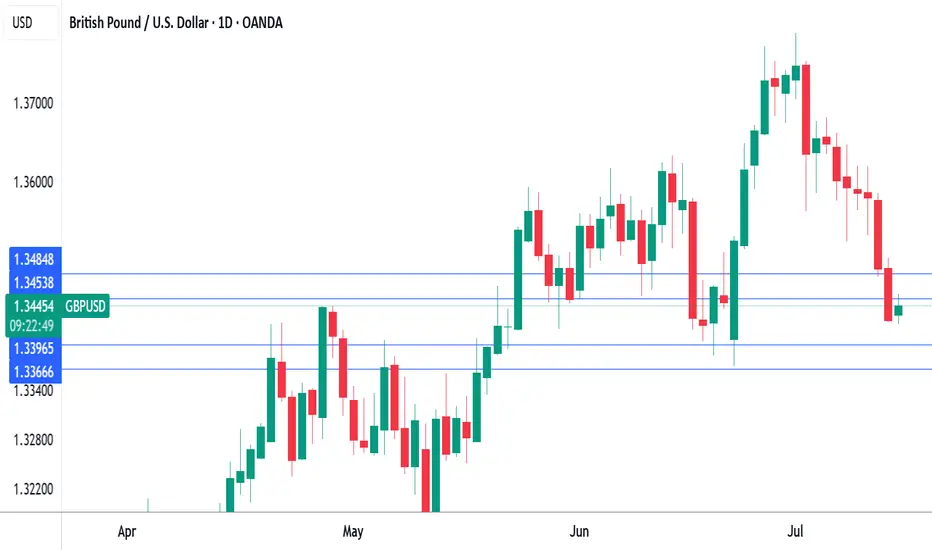
GBP/USD has broken below important support zones (1.3630 and 1.3530–1.3550), now turned resistance. It is currently testing the 1.3434 level, aligned with a key trendline. A breakdown here could open the door to deeper losses toward 1.3370 and potentially the low 1.30s.
Two major data points will guide the pair this week:
• UK CPI (July 16): A soft print would likely reinforce rate cut bets.
• US Retail Sales (July 17): After a May decline, a rebound could highlight US resilience and strengthen the dollar further.
By Fawad Razaqzada, market analyst with FOREX.com
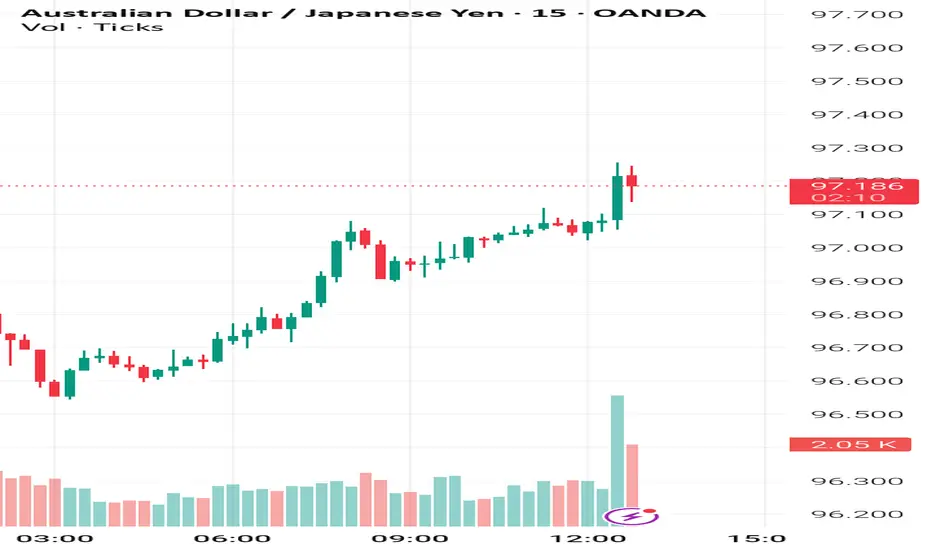
AUD JPY long. Entry: 97.13The market appears to like the month on month below forecast US CPI data.
The JPY is currently the weakest, I've therefore entered a straightforward 'risk on' AUD JPY catalyst trade.
It's a 20 pip stop loss with 30 pip profit target.
The risk to the trade is if the market changes its mind, or simply negative sentiment at the US open.
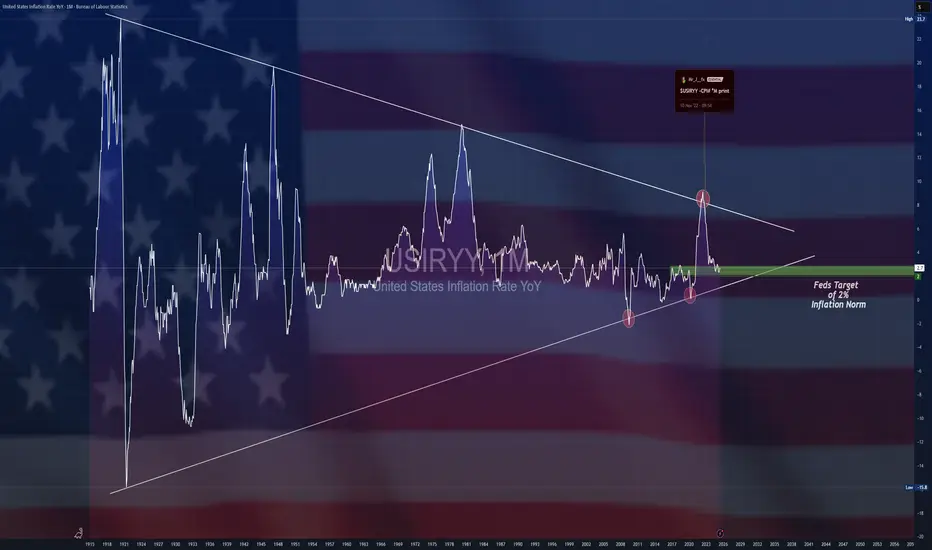
$USIRYY -U.S Inflation Rate Seen Rising for 2nd Month (June/2025ECONOMICS:USIRYY
June/2025
source: U.S. Bureau of Labor Statistics
- The annual inflation rate in the US likely accelerated for the second consecutive month to 2.7% in June, the highest level since February, up from 2.4% in May.
On a monthly basis, the CPI is expected to rise by 0.3%, marking the largest increase in five months.
Meanwhile, core inflation is projected to edge up to 3% from 2.8%. Monthly core CPI is also anticipated to climb 0.3%, up from 0.1% in May, marking its sharpest increase in five months.
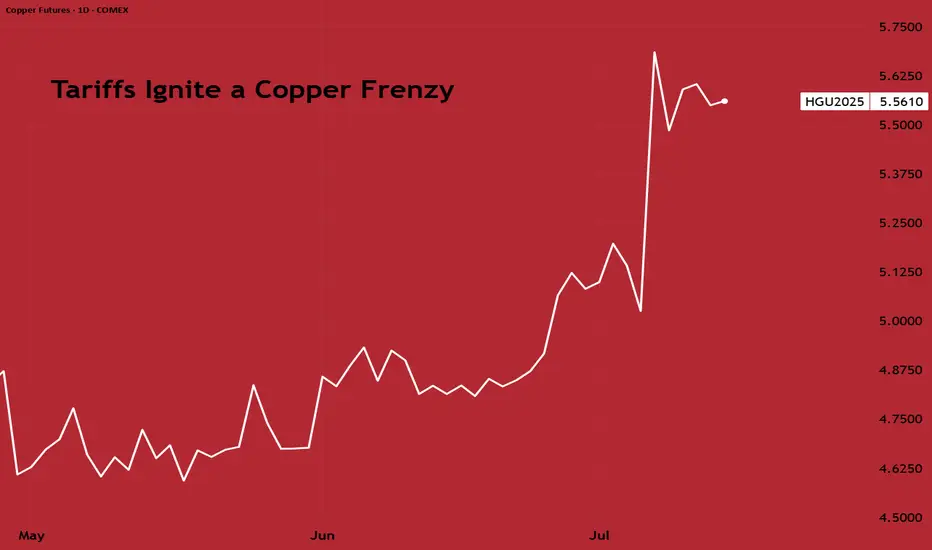
Tariffs Ignite a Copper FrenzyCOMEX copper has surged to a record premium over London Metal Exchange (LME) copper over the past few weeks, reflecting a lucrative arbitrage as traders rush metal into the U.S. ahead of looming import tariffs.
President Donald Trump’s announcement of a 50% tariff on U.S. copper imports (effective August 1, 2025) has dramatically disrupted the global copper market. U.S. futures are now trading at a significant premium of $2,600 per metric ton over LME prices, pulling physical copper into the US from around the world.
As a result, inventories have ballooned in U.S. warehouses while declining sharply elsewhere. COMEX (CME) stockpiles have surged to exceed the combined copper inventories of LME and SHFE (Shanghai), indicating massive stockpiling in the U.S.
Correspondingly, LME warehouse stocks have fallen to multi-year lows, fuelling a steep backwardation (near-term prices trading above far-dated futures) as available supply in London shrinks. LME–tracked inventories have declined by roughly 60% so far in 2025.
Source: Bloomberg
This tariff-induced distortion is also evident in trade flows. Analysts estimate the U.S. imported around 881,000 tons of copper in the first half of 2025, roughly double its underlying consumption, as buyers rushed to secure cheaper metal before tariffs hit.
Once the tariff is implemented and these stockpiles start being utilised, U.S. imports are expected to plunge and weigh on global copper prices later this year.
Going forward, clarity on the tariff’s scope regarding any exemptions for key suppliers like Chile or Canada will determine if COMEX Copper sustains a large premium.
CHINA'S PIVOT FROM HOARDING TO DRAINING
While the U.S. has been hoarding copper, demand in China, the world’s largest consumer, presents a mixed picture. On the one hand, China’s property construction sector remains sluggish, and manufacturing activity has only tentatively improved.
Earlier in the year, Chinese copper inventories surged to multi-year highs; an unusual build likely driven by weak consumption and precautionary stockpiling. However, this trend has since reversed sharply. Chinese copper stockpiles peaked around 377,000 mt in March before plunging to 126,000 mt by end-June.
This drawdown suggests that, despite macroeconomic headwinds, China’s copper usage remained resilient. Grid companies and manufacturers continued buying copper at high levels, even as consumer sectors slowed.
Source: Crux Investor
Copper demand in China is coming from strategic industries: State Grid investment soared nearly 20% YoY until May 2025, and manufacturing of electric vehicles and appliances remains a bright spot.
Owing to reduced demand in construction, though, the net effect for near-term demand remains somewhat on the softer side, but it is still far from collapsing.
Any further government stimulus for infrastructure or housing in H2 2025 could quickly translate into a bump in copper demand, given the low inventories now in China.
LONGER-TERM UPSIDE THROUGH SUPPLY CHALLENGES
Beyond the immediate cross-currents, the medium-to-long-term outlook for copper is fundamentally bullish, owing to the significant constraints on the supply side.
Many of the world’s largest copper mines are ageing, with declining ore grades and operational challenges.
In Chile (the top copper-producing country), Codelco’s output hit a 25-year low in 2023 amid falling grades and project delays. The state-owned giant is striving to boost production in 2025, but first-quarter 2025 output was essentially flat (+0.3% YoY), and was hampered by unforeseen disruptions like heavy rains and a nationwide power blackout.
Similarly, Anglo American, another major producer, has warned of lower production. Anglo expects its copper output to drop to 690–750 thousand tons in 2025, down from 773k in 2024, due to lower ore grades and water restrictions at its Chilean operations.
Due to the massive wedge between demand and supply dynamics, analysts have predicted the copper market to slip into a substantial deficit next year, even sans tariffs.
The recent tariff saga, creating all the noise, would exacerbate near-term tightness, and would lead to U.S. consumers drawing down global supply. This sets the stage for sharper shortages later.
Supply from recycling is also expected to take a hit due to the trade friction between China and US.
Source: Bloomberg
In response to the tariffs, China could cut back imports of US scrap copper. This would, in effect, reduce China's exports of refined copper, with less refined copper entering the global supply consequently.
This further strengthens the case for prolonged upward price pressure.
HYPOTHETICAL TRADE SET-UP:
For investors, the divergent short- and long-term forces in copper open several strategy avenues. In the very near term, prices may remain volatile or even pull back once U.S. imports pause, with others having increased access to the metal.
However, any such dip would present a buying opportunity given copper’s strong fundamentals. A straightforward bullish strategy is to establish a long position in copper futures, taking advantage of any weakness.
For example, one could go long the CME Copper futures (March 2026 expiry) to express a positive view on copper into next year.
Source: CME QuikStrike
Open interest for this contract lies just under 30,000, with volume as on 11/Jul clocking 3095.
The hypothesis is that after a period of consolidation, copper prices will resume an uptrend as the market shifts focus from temporary inventory builds to the looming supply deficit. Indeed, the term structure is also signalling tighter conditions down the line; while nearby copper prices spiked on the tariff news, longer-dated futures have also firmed as traders anticipate future scarcity.
Source: CME QuikStrike
With that in mind, a possible trade setup is outlined below:
● Entry: $5.68 per pound
● Target: $6.20 per pound
● Stop Loss: $5.37 per pound
● Profit at Target: $13,000 ((6.20 – 5.68) = 0.52 x 25,000 pounds/contract)
● Loss at Stop: $ 7,750 ((5.37 – 5.68) = -0.31 x 25,000 pounds/contract)
● Reward-to-Risk: 1.7x
The same view can also be expressed through CME Micro Copper futures, which offer smaller notional positions and more flexibility. Each Micro contract is priced in USD per pound and represents 2,500 pounds of copper, compared to 25,000 pounds for the standard contract.
As history shows, the “electrifying metal” tends to reward those who can weather short-term volatility in pursuit of its long-term uptrend.
MARKET DATA
CME Real-time Market Data helps identify trading set-ups and express market views better. If you have futures in your trading portfolio, you can check out on CME Group data plans available that suit your trading needs tradingview.com/cme .
DISCLAIMER
This case study is for educational purposes only and does not constitute investment recommendations or advice. Nor are they used to promote any specific products, or services.
Trading or investment ideas cited here are for illustration only, as an integral part of a case study to demonstrate the fundamental concepts in risk management or trading under the market scenarios being discussed. Please read the FULL DISCLAIMER the link to which is provided in our profile description.
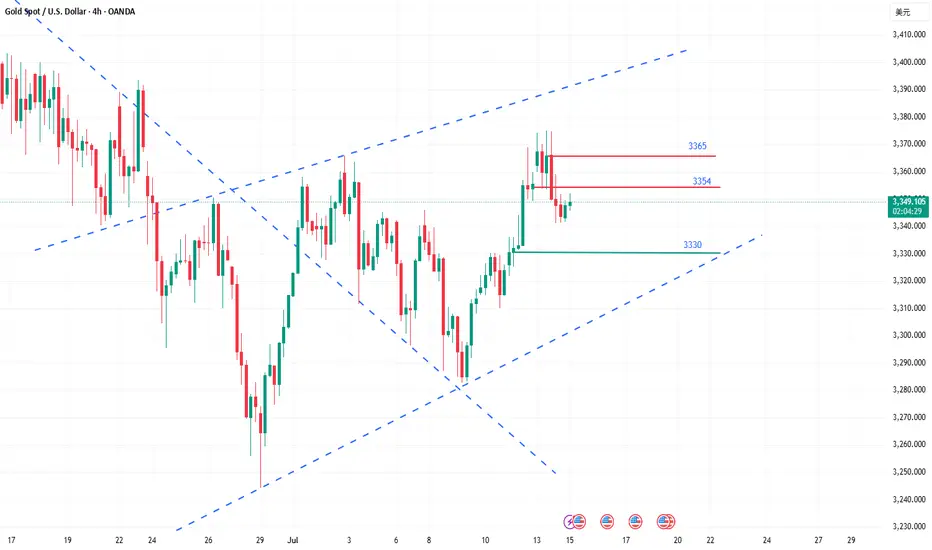
How to grasp the key trading points of gold?Yesterday, gold tested the 3375 line several times but failed to break through effectively. The selling pressure on the market was obvious, and the price immediately fell back, reaching a low of around 3341. The daily line closed with a long upper shadow, indicating that the bullish momentum has weakened and the short-term market has entered an adjustment phase. From the perspective of the 4-hour cycle, the continuous negative trend has led to the gradual closing of the Bollinger Bands, and the middle track position has temporarily gained support, but the overall market is volatile and weak. Today, we will focus on the 3354 watershed. If the rebound fails to effectively stand at this position, the pressure on the upper side will still be strong, and there is a risk of a short-term decline.
Key technical positions: upper resistance: 3365, 3354, lower support: 3340, 3330. In terms of operation rhythm, it is recommended to deal with it with a high-selling and low-buying, oscillating approach, and maintain flexible adjustments.
The operation suggestions are as follows: You can choose to short in the 3360-3365 area, with the target around 3350 and 3340; if the rebound is blocked below 3354, you can also enter the short order in advance. It is recommended to enter and exit quickly in the short-term weak market; strictly control the stop loss to avoid risks caused by sudden changes in the market.
The current market is obviously volatile, so don't blindly chase the rise and fall. It is particularly important to operate around the key pressure and support areas. The grasp of the rhythm will determine the final profit, and steady trading is the kingly way.
GBPUSD Pauses After Hitting First Target Amid USD-Driven TurbuleGBPUSD Pauses After Hitting First Target Amid USD-Driven Turbulence
Following our previous analysis, GBPUSD reached its first downside target and is currently experiencing a brief pause.
The U.S. has begun sending letters to multiple trading partners, stirring market uncertainty. This diplomatic disruption is strengthening the USD, giving it a tactical edge.
Should GBPUSD correct back toward 1.3600, there's potential for renewed downside movement in the coming days—particularly if market clarity improves.
🎯 Next key targets:
1.3435
1.3330
You may find more details in the chart!
Thank you and Good Luck!
PS: Please support with a like or comment if you find this analysis useful for your trading day
Disclosure: I am part of Trade Nation's Influencer program and receive a monthly fee for using their TradingView charts in my analysis.

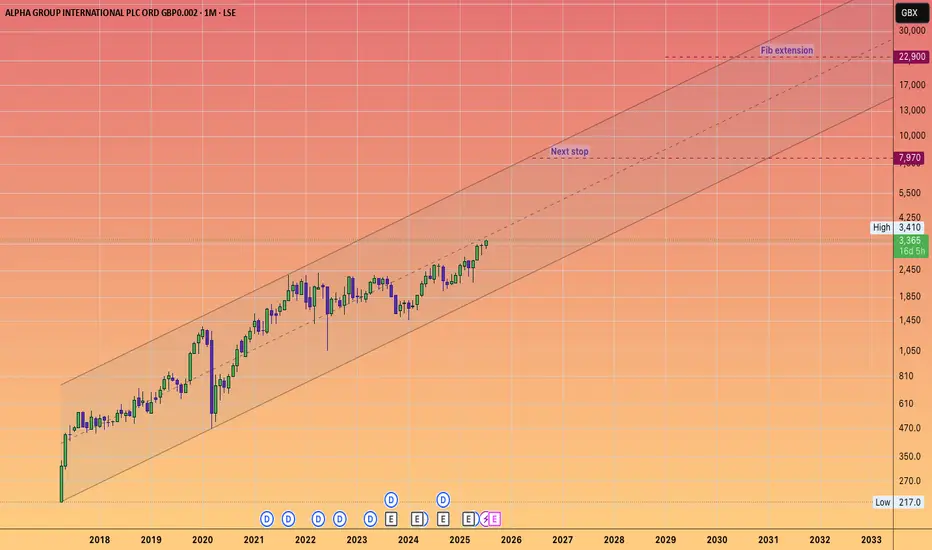
ALPHA GROUP INTERNATIONAL will keep its momentum going!#ALPHA is a fintech company that offers currency risk management and payment solutions.
With a price-to-earnings ratio of approximately 12,
it signifies a solid investment for a growth-oriented fintech firm that is increasing its earnings by about 20 to 25% annually.
In light of the #UKX breaking through and reaching new highs, and beginning to accelerate towards my long-standing projections that the FTSE would hit 5 figures, ALPHA appears to be a unique opportunity in the UK markets, which, as we know, are relatively sparse compared to the USA.
Given the inability to purchase shares of #Revolut, it is likely that capital will flow into this ticker.
Gold Faces Strong Rejection Below $3,365 – Bearish Wave Ahead?Gold is currently trading around $3,359, showing signs of exhaustion after climbing from the $3,248 low. The chart illustrates a textbook scenario of channel rejection after testing the upper boundary of the descending wedge and failing to break above the $3,365–$3,392 resistance zone. Price is now hovering just below the diagonal black trendline, indicating a potential lower high formation and setting up for another bearish wave.
📌 Key Technical Highlights
Resistance Zone: $3,365–$3,392
This area marks the confluence of the black long-term trendline, the top of the descending purple channel, and the previous high at $3,392.
Price attempted a "Possible Retest" as annotated on the chart and is now starting to pull back—showing signs of bearish rejection.
Bearish Scenario (Blue Arrows):
Multiple downward arrows show likely bearish paths if the current resistance holds.
Key short-term targets:
$3,337, $3,320, $3,303, Strong support at $3,293–$3,248
Further downside may test extension levels toward $3,220–$3,200 by early August if momentum builds.
⚠️ Bearish Confirmation Criteria
Failure to close above $3,365 (black trendline)
Breakdown below $3,337 followed by $3,320
Strong selling pressure supported by fundamentals (e.g. USD strength, Fed hawkish stance)
✅ Invalidation / Bullish Outlook
A decisive breakout and close above $3,392.73 would invalidate the bearish structure.
In that case, targets would shift toward:
$3,412, $3,434, $3,490 (long-term trendline intersection)
However, today's U.S. CPI (Consumer Price Index) release adds a layer of volatility and potential trend disruption, making this a high-risk trading day.
📊 CPI News Impact – What to Watch
High CPI (Stronger than forecast):
- Increases expectations of further Fed tightening → strengthens USD → bearish for gold
- Likely scenario: sharp drop toward $3,337 → $3,320 → $3,293
Low CPI (Weaker than forecast):
- Signals disinflation → weakens USD → bullish for gold
- Possible breakout above $3,365 → retest of $3,392 → if broken, target $3,412 and $3,434
Neutral or as expected CPI:
- Likely leads to whipsaw — fakeout on both sides
- Caution advised — wait for candle close confirmations post-news
Note
Please risk management in trading is a Key so use your money accordingly. If you like the idea then please like and boost. Thank you and Good Luck!

Pound under pressure ahead of US, UK inflation reportsThe British pound has edged up higher on Tuesday. In the European session, GBP/USD is trading at 1.3453, up 0.21% on the day. Earlier, GBP/USD touched a low of 1.3416, its lowest level since June 23.
All eyes will be on the UK inflation report for June, which will be released on Wednesday. Headline CPI is expected to remain unchanged at 3.4% y/y, as is core CPI at 3.5%. Monthly, both the headline rates are expected to stay steady at 0.2%.
Has the BoE's battle to lower inflation stalled? The BoE was looking good in March, when inflation eased to 2.6%, but CPI has rebounded to 3.4%, well above the BoE's inflation target of 2%. Services data has been especially sticky, although it dropped to 4.7% in May, down from 5.4% a month earlier.
At 3.4%, inflation is stuck at its highest level since February 2024 and that will complicate plans at the BoE to renew interest rate cuts in order to kick-start the weak UK economy. The central bank has lowered rates twice this year and would like to continue trimming the current cash rate of 4.25%. The Bank meets next on Aug. 7 and Wednesday's inflation data could be a significant factor in the rate decision.
In the US, if June inflation data rises as is expected, fingers will quickly point to President Trump's tariffs as finally having an impact. Recent inflation reports have not shown a significant spike higher due to the tariffs, which were first imposed in April. However, the tariffs may have needed time to filter throughout the economy and could be felt for the first time in the June inflation reading.
The Fed meets next on July 30, with the markets pricing in a 95% chance of a hold, according to CME's FedWatch. For September, the odds of a rate cut stand at 59%. Today's inflation report could cause a shift in these numbers.
GBP/USD tested resistance at 1.3454 earlier. Above, there is resistance at 1.3484
1.3396 and 1.3366 are the next support levels
THE BULLISH CASE FORE BUYERS FUMDAMEMTAL ANALYSIS
Key Drivers for the Bullish Outlook:
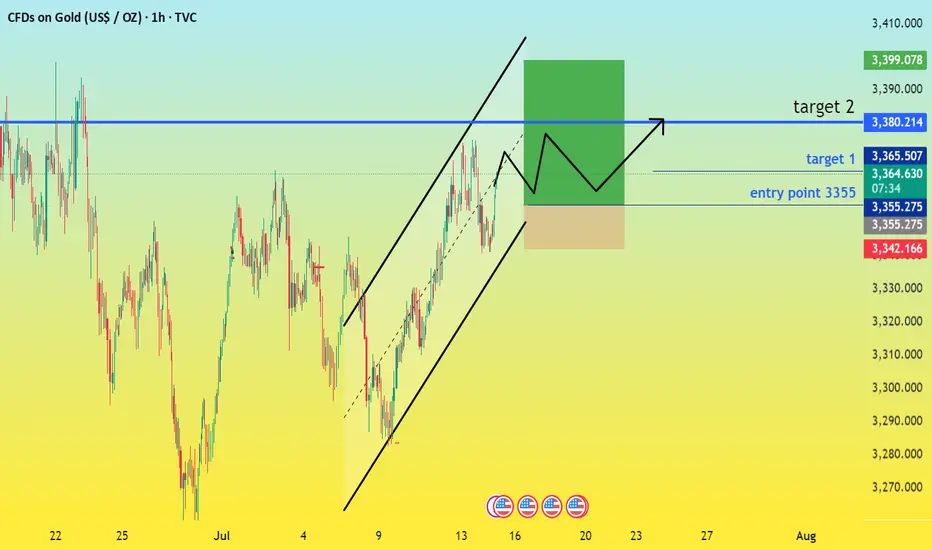
Strong Technical Support and Breakout Potential: Recent price action indicates a robust underlying strength. Gold has demonstrated resilience around the $3331-$3335 zone, which is acting as a strong demand area. Furthermore, a "Break of Structure" (BOS) above $3340 has been confirmed, signaling bullish control. If gold can decisively break and close above the immediate resistance level of $3360-$3364, it opens the path for significant gains. Analysts are eyeing targets of $3380 and potentially $3406 (1.272 Fib extension)
With gold currently trading around $3364, the signals are pointing towards an attractive buying opportunity for discerning investors. A confluence of technical indicators and underlying market fundamentals suggests that the yellow metal is poised for further upside.
Persistent Geopolitical and Economic Uncertainty: Gold's traditional role as a safe-haven asset shines brightest during times of uncertainty. Current global dynamics, including ongoing trade tensions (e.g., renewed US tariffs), geopolitical risks, and concerns about potential economic downturns, continue to fuel demand for gold. This "risk-off" sentiment directs capital towards the precious metal, bolstering its price.
Central Bank Accumulation: Central banks worldwide have been consistent and significant buyers of gold. This trend is expected to continue throughout 2025 and beyond, with projections of around 900 tonnes of central bank buying in 2025. This sustained institutional demand provides a strong floor for gold prices and underscores confidence in the metal as a reserve asset.
Potential Entry Points and Targets:
"Buy the Retest" Strategy: A highly attractive entry point is around $3335. This zone aligns with multiple bullish confluences, including a bullish order block, Fair Value Gap (FVG), and the 38.2% Fibonacci retracement level. A stop-loss below $3327 would manage risk effectively, with initial targets at $3355 and $3380. This offers a favorable risk/reward ratio.
Breakout Long: For more aggressive traders, a decisive break and close above $3360 could trigger a long position, targeting $3380 and potentially $3406.
Deeper Pullback: In case of a deeper market shakeout, the $3313-$3315 zone (61.8% Fib + deeper demand) presents another robust buying opportunity.
$CNGDPYY -China GDP Growth Slows Less Than Expected (Q2/2025)ECONOMICS:CNGDPYY
Q2/2025
source: National Bureau of Statistics of China
- China’s economy expanded 5.2% yoy in Q2 2025, easing from 5.4% in the prior two quarters and marking the softest pace since Q3 2024.
Still, the latest reading narrowly beat estimates of 5.1%, supported in part by Beijing’s policy measures amid a fragile trade truce.
Growth momentum in H2 is projected to weaken further, due to headwinds from trade tensions, deflation risks, and a prolonged property slump.

Remains Below 1.3700 Ahead of CPI Data from the US and CADUSD/CAD Remains Below 1.3700 Ahead of CPI Data from the US and Canada
USD/CAD continues to decline ahead of inflation data from both the US and Canada.
The US inflation rate is expected to rise to 2.7% year-over-year in June, up from 2.4% recorded in May.
Meanwhile, Canada’s CPI is forecasted to increase by 1.9% year-over-year in June, up from 1.7% in May.
USD/CAD is trading around 1.3690 during the European session on Tuesday, following two days of gains. The pair is declining as the US dollar (USD) continues to weaken ahead of the June CPI data from the US. The inflation figures will provide new insights into the Federal Reserve's (Fed) monetary outlook.
📉 Market Outlook for USD/CAD – Possible Drop on CPI Release
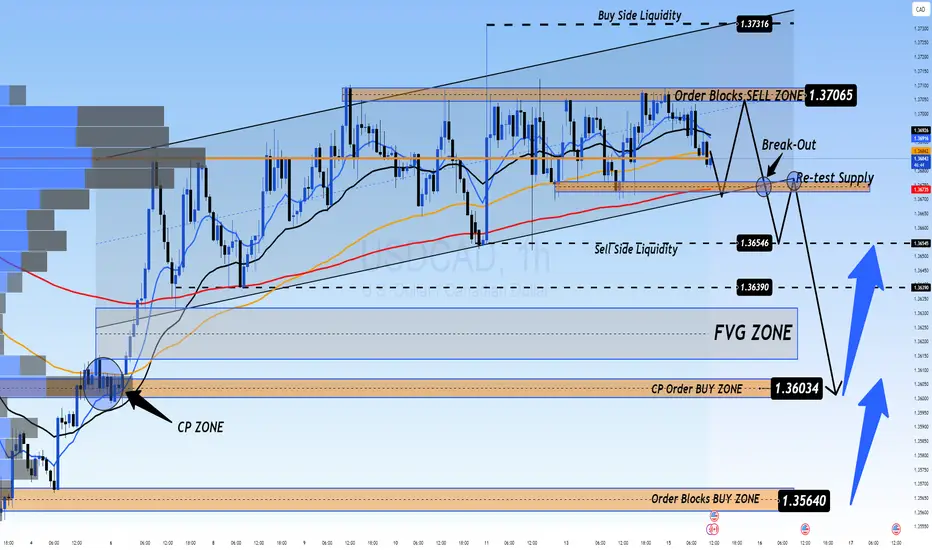
The USDCAD is still in a downtrend, and a sharp drop could occur with today’s CPI data release. Currently, there are two Buy Side Liquidity zones above and Sell Side Liquidity below, with the price balanced around the VPOC zone, which will soon decide the direction after the CPI announcement today.
Market liquidity still holds a FVG below, and with CPI data expected to favor USD, this could trigger a sharp drop towards this liquidity zone, possibly nearing CP OBS at 1.3600, followed by a potential rebound.
If price breaks CP zone, it may head toward a strong OB zone near 1.35xxx. Therefore, caution is advised when monitoring these OB zones.
🎯 Trading Strategy for Today
🟢 BUY ZONE: 1.36000
SL: 1.35500
TP: 1.36500 → 1.37000 → 1.37500 → ????
💬 What are your thoughts on USD/CAD ahead of the CPI data release? Do you expect a strong bounce or a continued decline? Share your views and join the conversation below!
👉 Follow for more updates and insights, and join the community to discuss real-time market moves!
EURGBP Analysis : Bullish Setup + Support & Reversal Zone Ahead🔍 Overview:
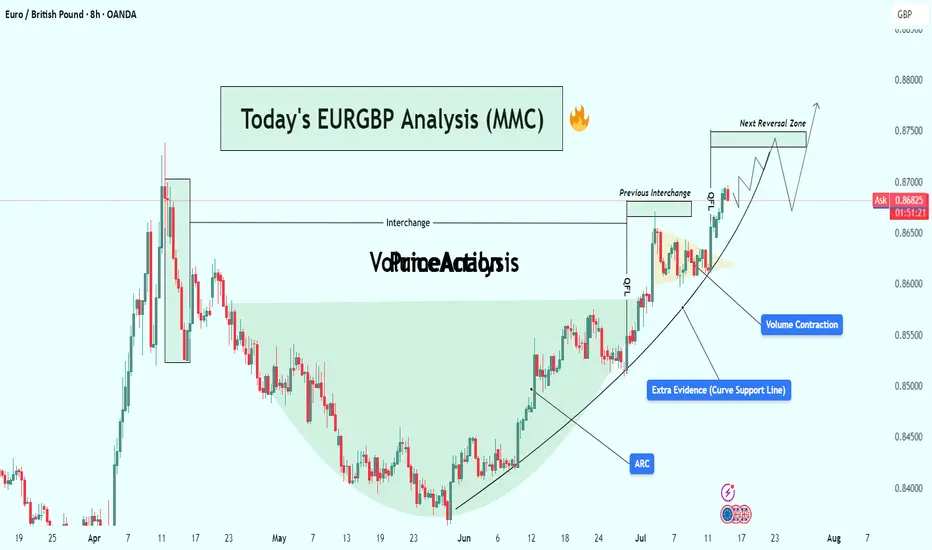
This analysis explores a well-developed Mid-Market Cycle (MMC) pattern playing out on the EUR/GBP 8H chart. The price action has transitioned from accumulation to markup, forming a classic cup-shaped recovery structure supported by a parabolic ARC curve. With strong volume contraction, historical interchange zones, and clean breakouts, this setup indicates bullish momentum heading into the next reversal zone.
Let’s walk through each component in detail and build the case for this trade setup.
🧩 1. MMC Cycle Framework
The chart structure aligns with the MMC (Mid-Market Cycle) model:
Phase 1 – Accumulation:
From April to late May, price formed a rounded bottom resembling a "cup" — a known sign of smart money accumulation. The downward momentum stalled, and sellers were gradually absorbed by larger participants.
Phase 2 – Breakout & Expansion:
Early June saw price breaking out of this base, beginning an aggressive uptrend supported by rising structure. This marks the transition to the markup phase of the MMC.
Phase 3 – Pullback & Continuation:
Price pulled back slightly into previous resistance (now turned support), forming a bullish continuation triangle and breaking out again. A textbook MMC continuation.
🧠 2. Technical Confluences
✅ A. ARC Support Curve
The curved support line (ARC) acts as dynamic demand.
Price has bounced multiple times off the curve, reinforcing its strength.
ARC patterns often signal increasing bullish acceleration, reflecting market psychology as traders gain confidence with each higher low.
✅ B. Interchange Zones
The concept of Interchange refers to zones where support becomes resistance or vice versa.
This chart features two key interchange levels:
First interchange formed after the April high.
Second interchange was retested and held cleanly after the breakout.
These areas indicate institutional interest, and their successful retests confirm trend continuation.
✅ C. Volume Contraction
Volume has been shrinking during the markup, which is counterintuitive but strategic.
In Wyckoff theory, this shows absorption of supply — institutions deliberately suppress volatility to accumulate before the next breakout.
Once the contraction ends, explosive moves often follow.
🎯 3. Target Zone: Next Reversal Area
Price is now heading into a clearly defined resistance zone around 0.87400–0.87500.
This level was respected in prior price history (April peak) and may trigger short-term selling or distribution.
The chart shows a possible liquidity grab scenario at the reversal zone, followed by a corrective move (mini bearish ABC).
📈 4. Price Projection & Scenarios
Bullish Case (High Probability)
Breakout Above 0.87500: Triggers a major leg upward.
Potential extension targets:
0.87850 (Fibonacci projection)
0.88200 (next higher timeframe resistance)
Bearish Case (Short-Term Pullback)
Rejection at Reversal Zone:
A corrective leg toward the ARC or prior interchange.
Ideal re-entry for buyers near:
0.86400–0.86600 zone
Or curve retest near 0.86000
🧭 5. Trade Strategy
🔹 Entry Options:
Breakout Entry: Above 0.87500 on strong candle + volume.
Retest Entry: On dip toward ARC curve or interchange.
🔹 Stop-Loss Ideas:
Below ARC line (~0.86000)
Below last bullish engulfing (~0.86250)
🔹 Targets:
TP1: 0.87500
TP2: 0.87850
TP3: 0.88200 (longer-term swing)
💡 6. Trader Psychology in This Chart
This chart represents a controlled bullish structure — a hallmark of smart money participation. Here’s why:
The rounding base was methodically built without sudden volatility.
Each breakout was followed by healthy retests (no fakeouts).
Volume stayed low during markups, reducing retail confidence and allowing institutional loading.
The ARC curve reflects increasing confidence and participation — buyers consistently stepping in on higher lows.
📌 Conclusion
This EUR/GBP setup is a textbook MMC/ARC structure with multiple confirmations:
Smart accumulation
Curve support respected
Volume and structure aligned
Clear next resistance zone
Whether you’re swing trading or monitoring for breakout scalps, this is a high-quality setup worth tracking. Be ready to act at the reversal zone, as it will either confirm continuation or offer a lucrative retest entry.
🔔 Follow for More:
I post regular MMC, structure-based, and Smart Money trade setups. Drop a like, comment your thoughts, or ask questions below!
Big Data Incoming — XAUUSD in Focus!
Core inflation data drops at 6 PM IST and traders are watching closely 👀
📈 Forecast says inflation is heating up — if actuals are higher, expect:
💵 USD strength ⬆️
🥇 Gold (XAUUSD) down ⬇️
💣 Volatility to spike!
🔥 Trade with logic, not emotion. Protect your capital. Let the market react — we react to the reaction 🧠📊
#XAUUSD #ForexNews #InflationReport #GoldAnalysis #CoreInflation #USData #TradingMindset #SmartMoneyMoves #ForexLife #PriceActionTrader #MacroMoves #TradingPsychology #NewsEventTrading #ReelForTraders #ReelTradingUpdate #GoldSetup #USDStrength

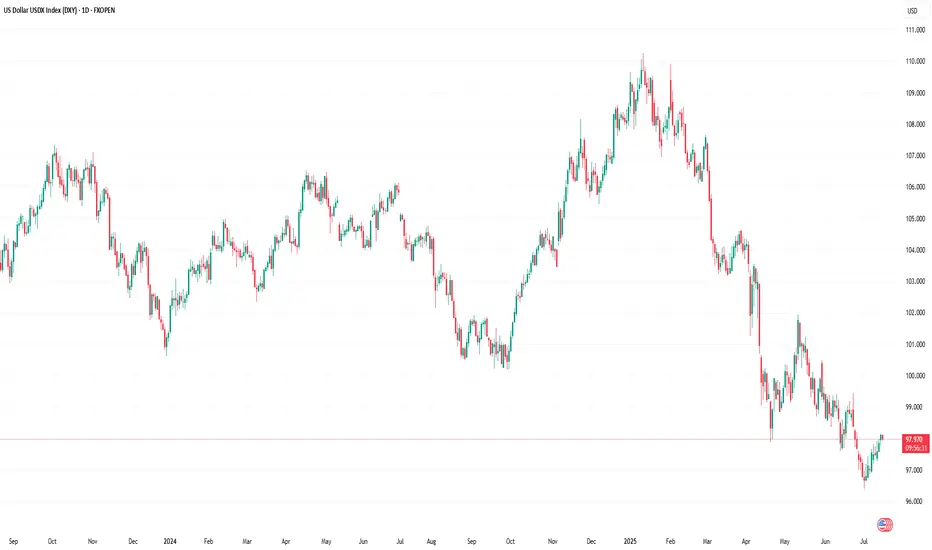
A Closer Look at the Role and Recent Volatility of the (DXY)A Closer Look at the Role and Recent Volatility of the US Dollar Index (DXY)
We don’t even need to say that the US Dollar Index (DXY) is one of the most influential benchmarks in global currency markets. The index, which measures the value of the US dollar against a basket of six major currencies, experiences heightened volatility and presents potential opportunities.
Understanding the DXY: A Macro Lens on the Dollar
The DXY tracks the relative strength of the US dollar versus a weighted currency basket including the euro, Japanese yen, British pound, Canadian dollar, Swedish krona, and Swiss franc. Although the euro comprises nearly 58% of the index, the DXY reflects broad USD strength or weakness across global markets, not just against a single currency.
Traders and analysts use the DXY as a key macro indicator—to track policy divergence between central banks, to hedge USD exposure, and to assess broader market sentiment. Rising DXY levels often signal tightening US policy or global risk aversion, while declines may reflect weakening growth expectations, dovish Fed policy, or geopolitical stress. In volatile environments like 2025, the DXY serves as a real-time barometer of global confidence in the US economy and dollar-based assets.
Recent Price Swings: Tariffs & Policy Uncertainty Shake the Dollar
Since April, the US Dollar Index has faced one of its most volatile stretches in years, driven by a convergence of Federal Reserve policy uncertainty and new trade tariffs announced by President Trump.
April: “Liberation Day” Tariffs Trigger Market Shock
On 2 April, the announcement of sweeping “Liberation Day” tariffs—10% on nearly all imports, with higher duties on selected countries—jolted currency markets. The DXY fell over 2% in a single day. In the following weeks, the index continued to decline as business confidence deteriorated and early signs of recession risk emerged.
May–June: Policy Headwinds Compound Dollar Weakness
As the tariff package took effect, the dollar extended its slide—marking a ~10% drop from its late‑2024 peak, the worst first-half performance in over 50 years. Investors reassessed US growth prospects amid the pressures of trade friction. The Fed responded with a hawkish pause, while President Trump publicly urged for rate cuts, further muddying the policy outlook and pressuring the dollar.
July: Uncertainty Builds
By early July, the DXY had fallen below 97, tallying an approximate 11% year-to-date decline. Analysts cite a “perfect storm” of expanding fiscal deficits, erratic trade decisions, and growing doubts over US policy credibility as key reasons for the dollar’s fall from favour.
Why DXY Matters Now More Than Ever
The DXY has become a real-time gauge of market confidence in US policy stability. The dollar’s sharp decline in 2025 underscores how fragile that confidence can be in the face of aggressive trade measures and uncertain monetary direction.
The introduction of Trump’s tariffs has raised structural concerns among investors:
- Growth expectations have been cut due to higher input costs and supply chain friction.
- The so-called safe-haven appeal of the USD has eroded, with flows shifting to the euro, Swiss franc, and gold.
- Foreign demand for dollar assets has softened, as fears of a prolonged trade conflict and fiscal indiscipline mount.
In this climate, the DXY has evolved into a barometer for geopolitical tension, inflation fears, and investor sentiment towards US leadership.
Bottom Line
The DXY is not just a tool for dollar specialists—it's a key reference for any trader dealing with macro-sensitive instruments. As the global rate environment continues to shift and the US economy shows mixed signals, the DXY may become one of the most revealing indicators to watch and trade in the second half of 2025.
This article represents the opinion of the Companies operating under the FXOpen brand only. It is not to be construed as an offer, solicitation, or recommendation with respect to products and services provided by the Companies operating under the FXOpen brand, nor is it to be considered financial advice.
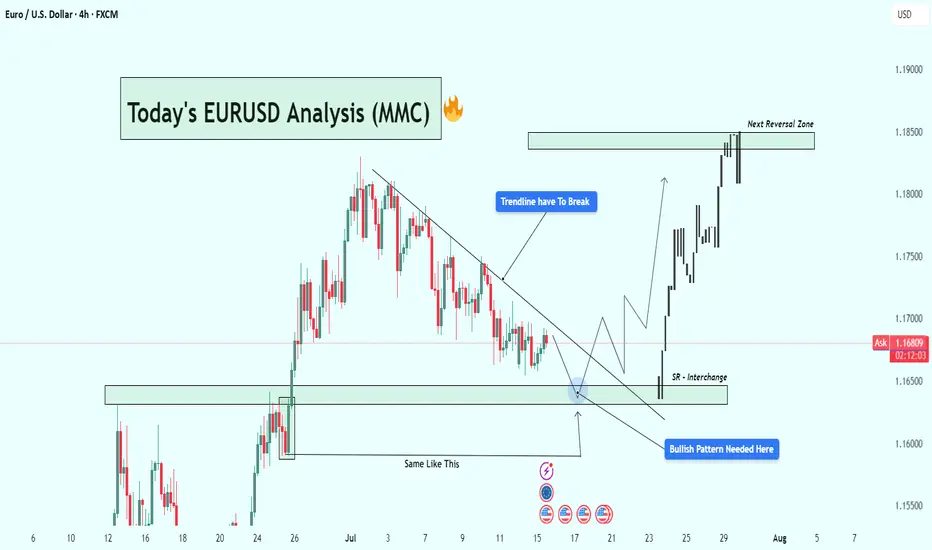
EURUSD Analysis : Eyes on Bullish Breakout Setup + Target🧭 Current Market Context:
The EURUSD pair is currently trading near 1.16765 on the 4H timeframe, displaying classic accumulation behavior at a key Support-Resistance Interchange Zone (SR Flip). After an extended bearish correction from the previous swing high, price has started compressing in a descending structure underneath a well-respected trendline. This tightening range near a historic support zone suggests that a major breakout could be on the horizon.
🧠 Technical Confluences:
🔹 1. Descending Trendline - Bearish Control Line:
The trendline drawn from the July highs has acted as a clear resistance line, rejecting multiple bullish attempts to break higher.
Price has failed to close above it on the 4H chart, showing sellers are still in control—but momentum is fading.
A breakout of this line is a crucial confirmation of buyer strength returning.
🔹 2. SR Flip Zone - Interchange Area:
This zone previously acted as resistance, capping the rally in June.
After price broke above it, the same area now acts as support, confirming its role as an SR flip zone—a textbook demand level.
Smart money often steps in at these interchange areas to accumulate long positions.
🔹 3. Re-accumulation Phase (Smart Money Behavior):
Market structure is showing a rounded bottom formation, hinting at possible absorption of sell-side liquidity.
Price action is compressing into the support zone, reducing volatility—a signal that a reversal or breakout is near.
The previous similar move ("Same Like This") from late June led to a strong bullish impulsive wave—this historical behavior adds confidence in the current bullish outlook.
🔹 4. Potential Bullish Pattern:
Price needs to develop a bullish reversal pattern (e.g., inverse head & shoulders, bullish engulfing, or a sweep of the low with rejection).
Only then will the setup be validated. This is not a blind buy zone, but a zone of interest for high-probability longs if price confirms.
🧨 Trade Plan Scenarios:
✅ Scenario 1 - Confirmation Breakout:
Wait for a clean breakout above the descending trendline.
Enter on breakout + retest structure.
Target the next major reversal zone at 1.18500.
🐢 Scenario 2 - Early Long Entry:
Enter on bullish confirmation (engulfing, pin bar, etc.) at the SR Interchange zone.
Stop loss below the support box.
Ride early for better R:R if the breakout confirms.
❌ Invalidation:
A clean breakdown below 1.1600 with momentum will invalidate the bullish bias.
In that case, reevaluate based on new structure.
📊 Projected Path:
If the trendline breaks, expect a bullish rally toward the next major resistance zone (1.18500).
That zone has historically acted as a major reversal and profit-taking level for bulls, and we expect price to react again if tested.
🔍 Macro View (Optional Insight):
USD may show weakness due to macro data (CPI/FED talks), helping EURUSD lift.
Eurozone data stability could further fuel demand for EUR.
📌 Final Thoughts:
This EURUSD setup is forming at a high-value area, backed by technical structure, historical behavior, and smart money positioning. If the price reacts positively from this zone and breaks the descending trendline, it could trigger a bullish leg toward 1.18500, offering a rewarding risk-to-reward opportunity for both swing and short-term traders.
Stay patient. Let the market confirm the direction before execution. 📈
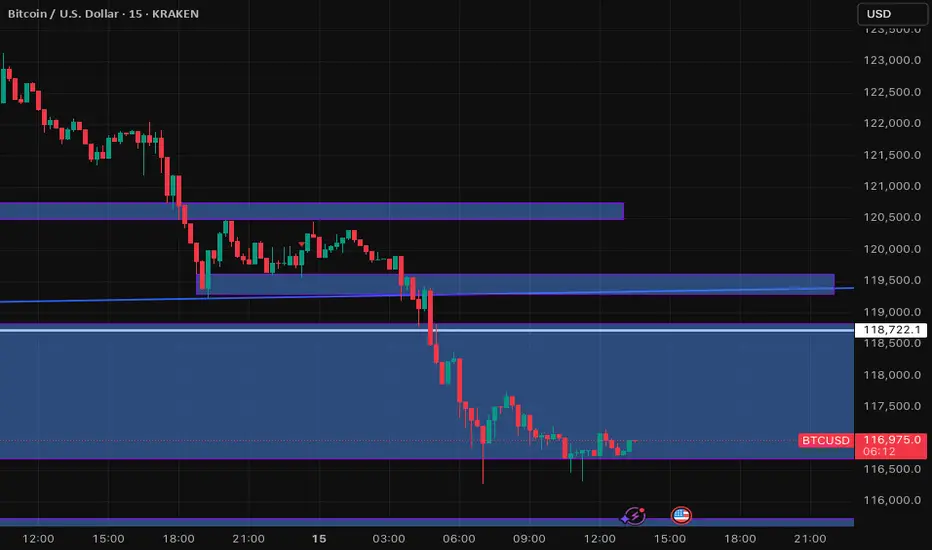
BTC/USD: Multi-Timeframe Breakdown & Retest of Key Demand ZoneThis multi-timeframe analysis for BTC/USD highlights a significant bearish breakdown from prior support levels and a rising trendline. Price has entered and is currently consolidating within a major demand zone around 116,675 - 118,828.8. The analysis focuses on the current price action at this critical support, looking for either a confirmed bounce for a retest of broken resistance, or a decisive breakdown for further downside. Key observations include the strong bearish impulse, the breakdown of a long-term trendline, and the current consolidation at a multi-timeframe demand area. The upcoming 4-hour candle close/open at 16:30 (after 4hr) is a critical time for potential volatility and confirmation of direction.
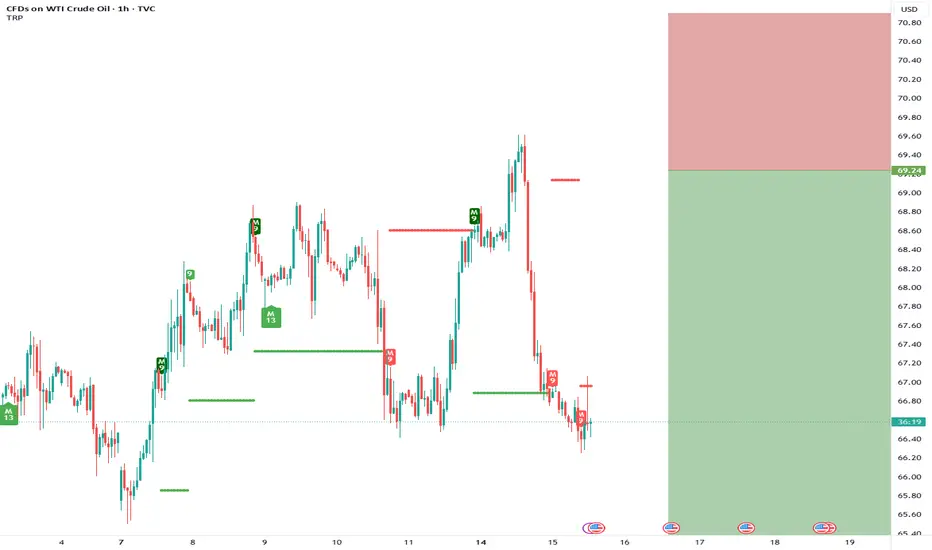
I’m short USOIL🛢️ USOIL is WTI Crude Oil, the oil that powers our world.
I’m short USOIL 📉
Too much oil is flooding the market while demand slows down.
Would you take this trade? 🤔
GOLD → Consolidation ahead of CPI. Chances for growth?FX:XAUUSD Gold is consolidating amid a correction in the dollar ahead of important news. Consumer price index data is due later today. The market is stagnant and will not move prematurely.
On Tuesday, gold rose slightly amid profit-taking ahead of the US CPI release. Investors are waiting for a signal from inflation: weaker data could strengthen bets on a Fed rate cut and support gold, while strong inflation would strengthen the dollar and put pressure on the metal. The situation is exacerbated by Trump's new tariff threats and his criticism of the Fed chair. Let me remind you of Trump's pressure on regulators regarding inflation and interest rate cuts.
Technically, gold is trading above the previously broken “symmetrical triangle” consolidation. Bulls are trying to hold their ground above 3340-3350. Focus on the current range of 3340-3373
Resistance levels: 3373, 3394
Support levels: 3350, 3340
Favorable news for gold could boost interest in the metal, which would generally lead to growth. However, there is a factor of unpredictability, and against this backdrop, gold may test support at 3350-3340. If the bulls manage to keep the price above this zone, we may see growth in the medium term. Otherwise, the price may drop to 3310-3280.
Best regards, R. Linda!

TRON the next rally for an AltcoinTRON seems to be the next ALt Coin Crypto that is ready to rally with the Crypto Summer kicking in with Bitcoin and Ethereum.
So this one looks exciting for upside.
Here are SOME fundamentals for upside first.
🏛 1. Institutional Money Flows
Big players are backing TRON with institutional-scale adoption, fueling network demand and price strength
🔗 2. SkyLink Launch
The new SkyLink protocol lets users earn yield on tokenized Treasuries, boosting excitement around TRX utility
💱 3. USDT Powerhouse
TRON has minted over $22 billion USDT in H1 2025—cementing its role as a stablecoin hub
Here are the technicals.
Cup and Handle
Price> 20 and 200MA
Target 3,861
Disclosure: I am part of Trade Nation's Influencer program and receive a monthly fee for using their TradingView charts in my analysis.

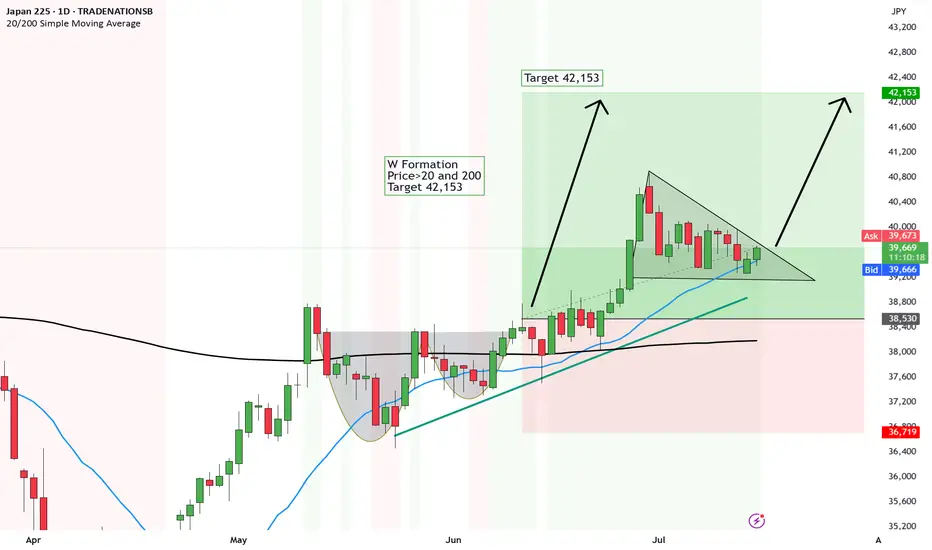
Bit of a delay - New Falling Wedge ready to break upJapan like Hong Kong is showing strong signs of growth.
We first had the breakout above the Cup and Handle and now we are awaiting the breakout above the Falling Wedge...
There are some strong signs of upside fundamentally...
💼 1. Solid GDP & corporate profits
Japan’s economy grew about 2.7% annualized in Q1—beating estimates—and corporations are reporting stronger earnings growth
🌐 2. Foreign buying spree
Foreign investors have poured into Japanese stocks for weeks—13 of the last 14—with inflows fueled by attractive valuations and yen hedging
🤖 3. AI & chip boom
Tech and chip firms tied to AI are leading the charge, pushing market gains and drawing investor attention
💸 4. Cheap & reform-driven
Japanese equities trade at a discount (~15x forward P/E), and ongoing corporate governance reforms are boosting investor confidence
Here are the technicals
W Formation
Price>20 and 200
Target 42,153
Disclosure: I am part of Trade Nation's Influencer program and receive a monthly fee for using their TradingView charts in my analysis.