Fundamental Analysis

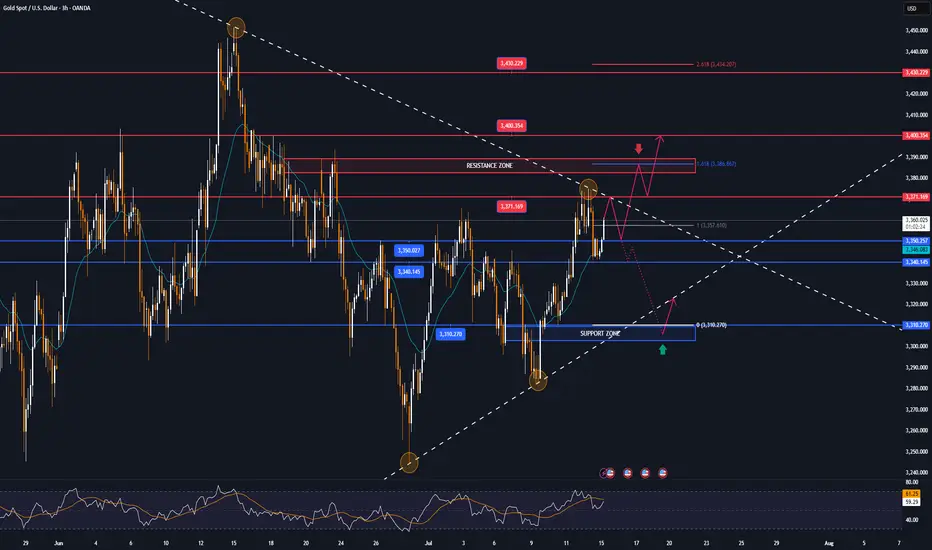
GOLD → Consolidation. Long squeeze before growth to 3400FX:XAUUSD has broken through resistance at 3353-3357 since the session opened, and bulls are currently trying to keep the market in the buying zone. Should we expect a long squeeze before growth?
Gold is in local consolidation after breaking through a key level. The price is still in the consolidation phase formed during a week-and-a-half correction. The price reached a three-week high of $3,374 on Monday but fell after the EU's conciliatory statements. Investors are awaiting US inflation data and Chinese GDP figures as they assess the prospects for a Fed rate cut. Heightened geopolitical and trade tensions are keeping demand for safe-haven assets high.
Technically, gold has entered a local buying zone, but there is a fairly complex resistance zone above it, and consolidation is needed to break through it. Such patterns could include a retest of support and a liquidity grab before growth.
Resistance levels: 3373, 3394
Support levels: 3357, 3353, 3345
There is a possibility of a retest of eql 3353 in a long squeeze format and a return to resistance at 3373 for a breakout. I also do not rule out a retest of the key level of 3345. The global trend is bullish, with the price locally in a fairly wide range, with an emphasis on the support zone of 3345-3355. If the bulls can hold this zone overall, the market will have a good chance of rising to 3400-3450
Best regards, R. Linda!

Watch Hyperliquid Surge 18% to $46 Key Resistance LevelHello,✌
let’s dive into a full analysis of the upcoming price potential for Hyperliquid 🔍📈.
KUCOIN:HYPEUSDT is trading within a reliable daily ascending channel and is currently near its lower boundary, where a strong daily support zone has formed. This setup suggests a potential upside of at least 18%, with a target around $46 , which aligns closely with a key trendline. 📈
✨ Need a little love!
We pour love into every post your support keeps us inspired! 💛 Don’t be shy, we’d love to hear from you on comments. Big thanks , Mad Whale 🐋

Gold/XAUUSD Analysis Breaks Bullish Channel – Targeting 3400+🟨 Market Context:
Gold (XAU/USD) has recently completed a significant technical move that signals the potential start of a strong bullish continuation phase. After a period of consolidation inside a descending channel, price has broken above key resistance levels and is showing firm buyer strength across the board.
🔍 Technical Structure Breakdown:
🔹 Descending Channel (Consolidation Phase)
For several sessions, gold was confined within a well-defined descending channel, which typically indicates a temporary correction in a broader bullish trend. This phase served as a liquidity-building zone where smart money accumulated long positions.
🔹 Breakout & Retest Confirmation
The breakout above the upper boundary of the channel was clean and impulsive, confirming bullish intent. This breakout aligned perfectly with a previous demand zone (now retested as support), adding strong confluence.
Key Breakout Zone: $3,330–$3,340
Retest Action: Price pulled back to test the breakout zone, respected it, and printed a bullish reversal.
This behavior confirms the “breakout–retest–continuation” pattern—highly reliable in trending markets.
🔹 SR Interchange – Key Pivot Zone
The level around $3,340 served a dual role:
Previously acted as resistance within the channel.
Now acting as support post-breakout (SR flip).
This interchange area is significant because it reinforces the idea that bulls are now defending this level aggressively.
🔹 Bullish Pattern Confirmation
A bullish price pattern has formed exactly at the SR zone and near the trendline. This double confluence (pattern + level) provides high-probability trade setups and confirms the entry point for buyers.
🔹 Ascending Trendline Support
An emerging bullish trendline is now guiding the move upward, confirming that the market has shifted its short-term trend. Every bounce on this trendline reinforces bullish structure and validates higher-low formations.
🎯 Price Targets & Expectations:
✅ Previous Target Zone:
Around $3,375, already tapped and respected.
This shows that gold is following technical targets with precision.
🎯 Next Bullish Target:
$3,400 – $3,410 zone stands as the next supply region.
This area is a major psychological resistance and aligns with historical reaction points.
🧠 Trading Insight & Strategy:
With current price action and momentum, buying dips remains the optimal approach, provided the price stays above the SR Interchange zone.
🔽 Entry Zone: $3,345 – $3,350
📈 Targets:
TP1: $3,375 (partial exit)
TP2: $3,400–$3,410 (final target)
❌ Invalidation Zone (Stop Loss): Below $3,330
Breaking below this would invalidate the breakout structure and possibly signal a false breakout.
📌 Summary:
✅ Clear breakout from descending channel
✅ Retest of previous demand and SR flip zone
✅ Bullish pattern confirmed on key support
✅ Ascending trendline intact
🎯 Next logical move: $3,400+
The gold market is giving strong bullish cues, and this setup could be a textbook example of “buy the breakout, ride the trend.”
Stay sharp, trade smart, and keep your risk in check. 👑

AVAX/USDT - H4 - Wedge Breakout (29.06.2025)The AVAX/USDT pair on the H4 timeframe presents a Potential Buying Opportunity due to a recent Formation of a Wedge Breakout Pattern. This suggests a shift in momentum towards the upside and a higher likelihood of further advances in the coming Days.
Possible Long Trade:
Entry: Consider Entering A Long Position around Trendline Of The Pattern.
Target Levels:
1st Resistance – 21.77
2nd Resistance – 24.35
🎁 Please hit the like button and
🎁 Leave a comment to support for My Post !
Your likes and comments are incredibly motivating and will encourage me to share more analysis with you.
Best Regards, KABHI_TA_TRADING
Thank you.

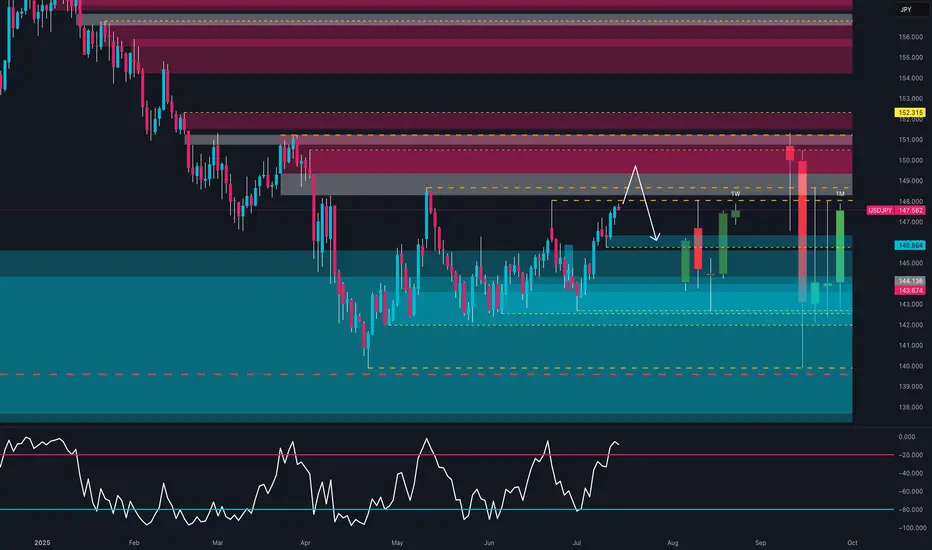
USDJPY – Tactical Short in Weekly Supply or Bullish Breakout?COT & MACRO FLOW (Commitment of Traders)
USD INDEX
Non-commercials still biased short: Longs 16,208 vs Shorts 20,194 (slightly improved, but still negative).
Commercials remain net long, but the open interest is declining → no strong conviction from smart money.
JPY
Non-commercials added significantly to their short exposure (+6,751), while cutting longs (-4,432).
Commercials also cut long exposure heavily (-20,405).
The structure shows institutional bias is clearly bearish on JPY.
Conclusion: JPY weakness confirmed by both commercial and non-commercial flows. USD slightly weaker, but JPY is weaker → supports USDJPY bullish bias.
SEASONALITY (JULY)
USD/JPY tends to be weak in July across most historical averages (5y, 10y, 15y, 20y).
July is historically bearish for USDJPY, especially in the second half of the month.
This seasonality contrasts with COT flows → mixed bias.
RETAIL SENTIMENT
60% of retail traders are SHORT → supports contrarian long view.
Retail volume shows imbalance in positioning, another contrarian bullish signal.
📈 TECHNICAL ANALYSIS (DAILY CHART)
Price is testing a key weekly FVG zone between 148.4 and 149.2.
RSI has re-entered the overbought region, suggesting potential exhaustion.
Price bounced from the monthly bullish order block (143.5–144.0).
A clear move above 149.50 could invalidate short setups.
🧩 TRADE IDEA (SETUP)
Watch for price to retest 148.4–149.50 zone and react.
RSI divergence + seasonality could offer a short opportunity with confirmation (e.g. engulfing on Daily/H4).
If price breaks above 149.5 with volume → look for continuation to 152.00.
✅ FINAL BIAS
Macro and institutional flows remain in favor of USDJPY longs, but:
Seasonality turns bearish in the second half of July
Price is reaching strong resistance
Retail sentiment supports the long thesis
→ Tactical Short from 149-150 only with confirmation. Otherwise, long continuation above 150.
XAUUSDGold is likely to correct to the price level of 3350. After that, we should wait for the reaction of buyers and sellers in this price range.

TURBO/USDT - H4 - Wedge Breakout (29.06.2025)The TURBO/USDT pair on the H4 timeframe presents a Potential Buying Opportunity due to a recent Formation of a Wedge Breakout Pattern. This suggests a shift in momentum towards the upside and a higher likelihood of further advances in the coming Days.
Possible Long Trade:
Entry: Consider Entering A Long Position around Trendline Of The Pattern.
Target Levels:
1st Resistance – 0.005173
2nd Resistance – 0.005994
🎁 Please hit the like button and
🎁 Leave a comment to support for My Post !
Your likes and comments are incredibly motivating and will encourage me to share more analysis with you.
Best Regards, KABHI_TA_TRADING
Thank you.

$MOODENGThis BYBIT:MOODENGUSDT.P trade right here is so annoying to me such that I set a good and clear Target but the market choose not to pick my target.
I had set my target TP at 0.21331 while the market only got to 0.21224. Just a pip move upward could have hit my TP and I’m good.
Unfortunately, I wasn’t active to see this play only to return later and see it back to entry.
Now it’s supposed to be a new trade but here am I, waiting for old trade to close.
Meanwhile, the current market price(CMP) is still a good entry for this trade with same TP and SL.
Enjoy the ride back up with me
#NFA #DYOR
Gold Price Analysis July 15Continued uptrend after touching the 3345 buy zone
As analyzed at the beginning of the week, gold price has touched the buy zone around 3345 and continues to maintain the bullish wave structure, heading towards the 3400 resistance zone.
Currently, if gold breaks the 3373 mark, the uptrend is likely to be further strengthened. At that time, it is not advisable to trade against the trend, especially when the buyers completely control the market.
However, in case gold falls below the 3343 support zone (the resistance level in yesterday's US session), the current uptrend may be temporarily interrupted. At that time, the market will need to form a new momentum to establish the next trend.
🔑 Important price zones:
Support: 3343 – 3330 – 3313
Resistance: 3373 – 3387 – 3400
📌 Trading strategy:
Hold BUY order at 3345, expected target 3400
Activate SELL order if there is a clear price rejection signal at 3373 or 3387 (with confirmation of selling pressure)
SELL at 3400 if the strong resistance zone reacts clearly
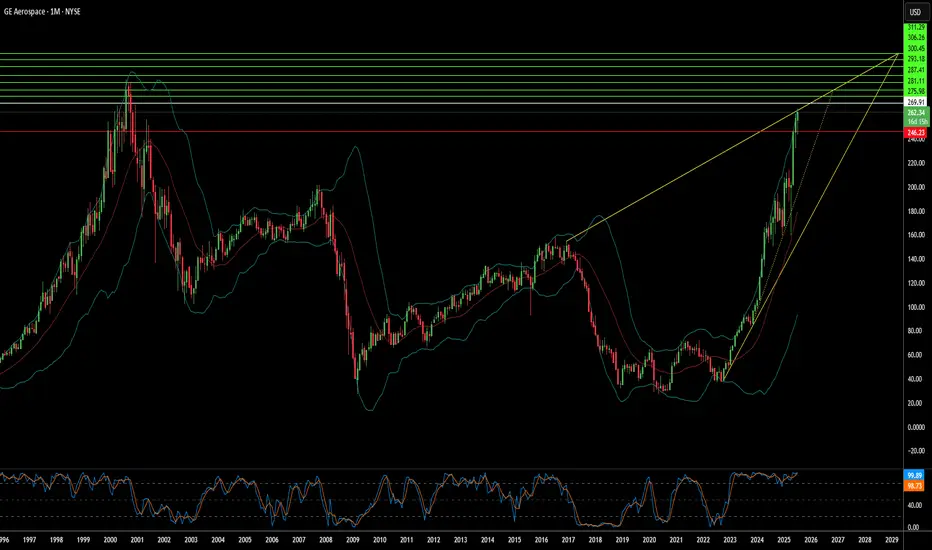
Soaring High: What Fuels GE Aerospace's Ascent?GE Aerospace's remarkable rise reflects a confluence of strategic maneuvers and favorable market dynamics. The company maintains a dominant position in the commercial and military aircraft engine markets, powering over 60% of the global narrowbody fleet through its CFM International joint venture and proprietary platforms. This market leadership, coupled with formidable barriers to entry and significant switching costs in the aircraft engine industry, secures a robust competitive advantage. Furthermore, a highly profitable aftermarket business, driven by long-term maintenance contracts and an expanding installed engine base, provides a resilient, recurring revenue stream. This lucrative segment buffers the company against cyclicality and ensures consistent earnings visibility.
Macroeconomic tailwinds also play a crucial role in GE Aerospace's sustained growth. Global air travel is steadily increasing, driving higher aircraft utilization rates. This directly translates to greater demand for new engines and, more importantly, consistent aftermarket servicing, which is a core profit driver for GE Aerospace. Management, under CEO Larry Culp, has also strategically navigated external challenges. They localized supply chains, secured alternate component sources, and optimized logistics costs. These actions proved critical in mitigating the impact of new tariff regimes and broader trade war tensions.
Geopolitical developments have significantly shaped GE Aerospace's trajectory. Notably, the U.S. government's decision to lift restrictions on exporting aircraft engines, including LEAP-1C and GE CF34 engines, to China's Commercial Aircraft Corporation of China (COMAC) reopened a vital market channel. This move, occurring amidst a complex U.S.-China trade environment, underscores the strategic importance of GE Aerospace's technology on the global stage. The company's robust financial performance further solidifies its position, with strong earnings beats, a healthy return on equity, and positive outlooks from a majority of Wall Street analysts. Institutional investors are actively increasing their stakes, signaling strong market confidence in GE Aerospace's continued growth potential.
IS USD STRENGTH BACK? or IS IT JUST A PULLBACK?All the information you need to find a high probability trade are in front of you on the charts so build your trading decisions on 'the facts' of the chart NOT what you think or what you want to happen or even what you heard will happen. If you have enough facts telling you to trade in a certain direction and therefore enough confluence to take a trade, then this is how you will gain consistency in you trading and build confidence. Check out my trade idea!!
www.tradingview.com

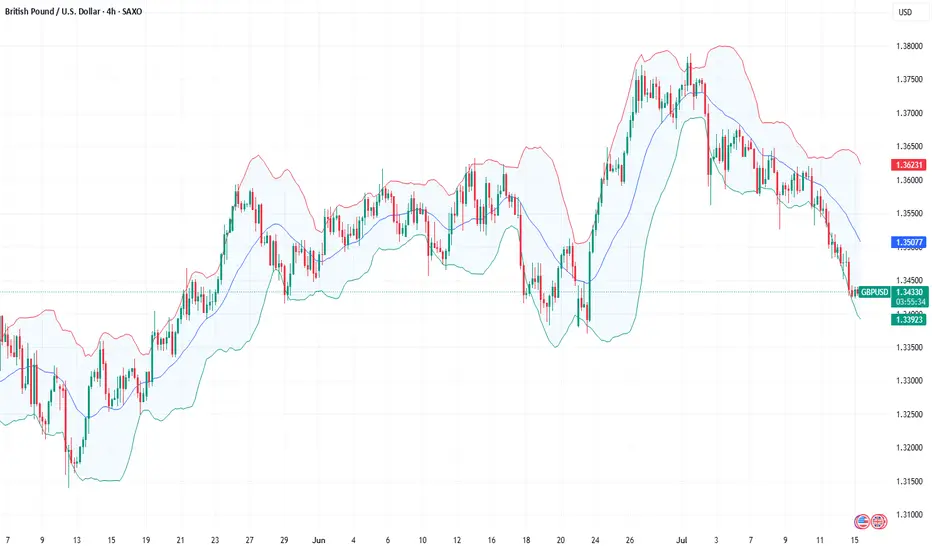
Fundamental Market Analysis for July 15, 2025 GBPUSDEvents to watch today:
15:30 EET. USD - Consumer Price Index
23:00 EET. GBP - BOE Governor Andrew Bailey Speaks
GBPUSD:
Sterling is on the back foot—the rate has dropped toward 1.34500—after the U.S. announced sweeping 30‑percent tariffs on goods from the EU and Mexico, triggering capital flows into dollar assets. The pound was further pressured by lacklustre GDP figures: the U.K. economy expanded by only 0.1 % q/q in Q2, bolstering expectations that the Bank of England could cut rates as early as August.
Exclusive for our readers – a 202% bonus on deposits of $202 or more! Give the promo code BTC202 to customer support and start trading with TRIPLED capital.
On the U.S. side, traders await the June CPI print, which is expected to show inflation quickening to 2.7 % y/y. Combined with a resilient labour market, such a reading could deter the Fed from an early policy pivot and lend the dollar extra support. The yield gap and diverging policy trajectories accentuate the downward bias in GBPUSD.
Political risk is likewise working against the pound: talks between London and Brussels on a ‘steel package’ are stalling, and Governor Andrew Bailey’s recent warnings about labour‑market softness underline the BoE’s dovish tilt. As long as the backdrop remains unchanged, the pair can slide toward 1.3350; a rebound above 1.34800 would likely require an unexpectedly soft U.S. inflation print.
Trading recommendation: SELL 1.34500, SL 1.34800, TP 1.33500
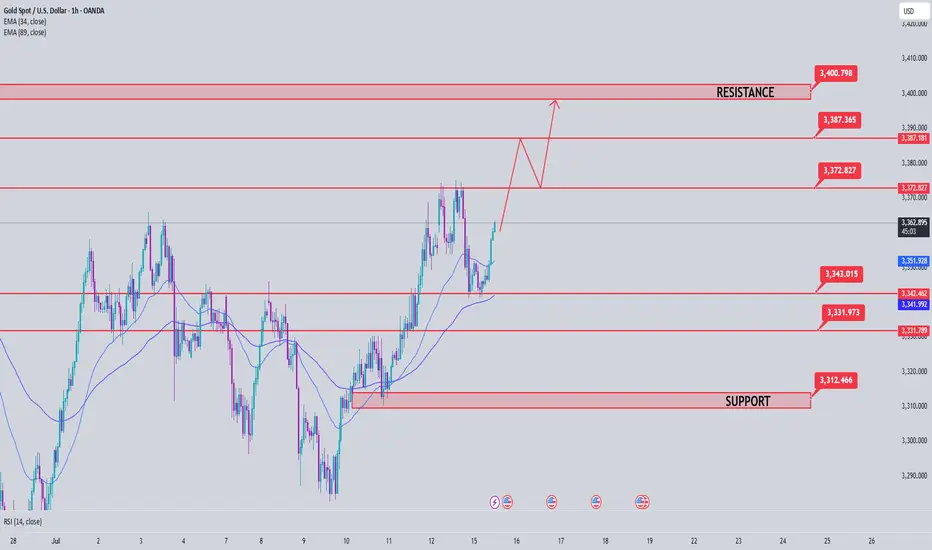
GOLD again targets $3,371, new bullish cycle conditionToday (Tuesday, July 15), in the Asian market, the spot OANDA:XAUUSD maintained a slight recovery trend, currently at around 3,360 USD/ounce.
The spot OANDA:XAUUSD rose to a 3-week high on Monday, but quickly fell back and finally closed lower. Trump's open attitude towards trade negotiations has improved the market's risk-on sentiment and negatively impacted gold, a safe-haven asset. But gold still has a lot of potential risks for price increases, and personally, the fundamental trend for gold has not changed.
The US Bureau of Labor Statistics will release its June Consumer Price Index (CPI) report today (Tuesday).
According to a Reuters survey, economists expect the US CPI to increase year-on-year in June to 2.7% from 2.4% the previous month, while the core CPI is expected to increase year-on-year to 3% from 2.8%.
The survey also showed that the US CPI is expected to increase 0.3% month-on-month in June, and the core CPI is also expected to increase 0.3% month-on-month.
According to the Chicago Mercantile Exchange's "FedWatch Tool", the market believes that the Fed is unlikely to cut interest rates in July and the probability of keeping interest rates unchanged in September is about 30%.
If the US core CPI rises by 0.4% or more in June, this could prompt market participants to reassess the possibility of a rate cut in September. In this case, the US Dollar could hold steady and push gold prices lower. On the other hand, if the data is lower than expected, gold will become more attractive while a weaker Dollar will be positive for gold prices.
Technical Outlook Analysis OANDA:XAUUSD
After gold reached the resistance target of attention to readers in the weekly publication at 3,371 USD, which is the location of the 0.236% Fibonacci retracement, it fell slightly but is now recovering positively.
Currently, gold is trading in the range of 3,360 USD, the price action above the lower edge of the long-term rising price channel with support from the EMA21, gold is now likely to continue to retest the 0.236% Fibonacci retracement level.
If gold breaks above $3,371 it will be eligible for a new bullish cycle, with the target then being around $3,400 in the short term, more so than $3,430.
On the other hand, the RSI is pointing up, maintaining activity above 50, and this should be considered a positive signal in terms of momentum. It shows that there is still a lot of room for growth ahead.
However, as of now, gold is still neutral in terms of trend, with conditions gradually tilting towards the possibility of price increase.
Along with that, the notable positions will be listed as follows.
Support: $3,350 – $3,340 – $3,310
Resistance: $3,371 – $3,400 – $3,430
SELL XAUUSD PRICE 3390 - 3388⚡️
↠↠ Stop Loss 3394
→Take Profit 1 3382
↨
→Take Profit 2 3376
BUY XAUUSD PRICE 3304 - 3306⚡️
↠↠ Stop Loss 3300
→Take Profit 1 3312
↨
→Take Profit 2 3318
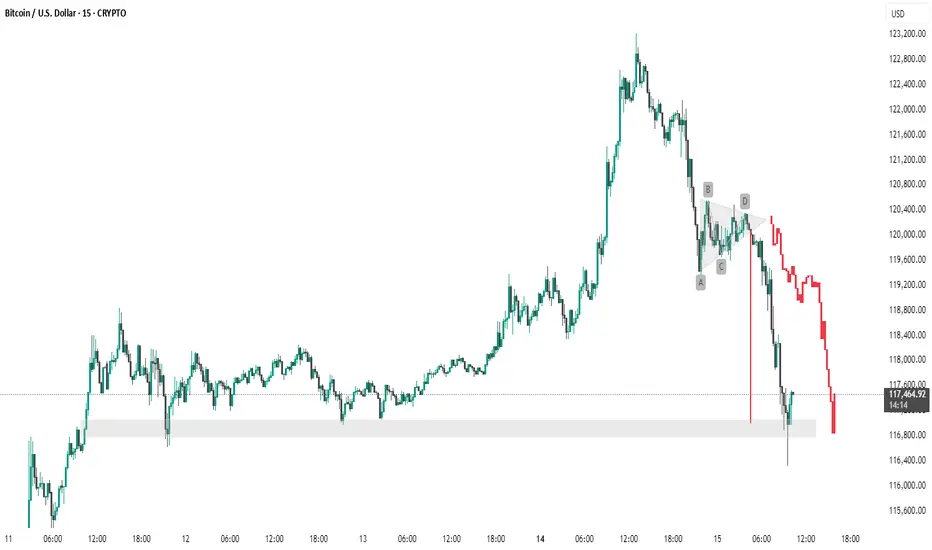
ROS #Repeat of structureROS #Repeat of structure
The chart you've provided is a 15-minute candlestick chart of **Bitcoin (BTC) / USD**, showing a recent price action pattern followed by a significant drop. Here are the **key points** identified on the chart:
**Key Support Zone**
* Highlighted in **light gray** at the bottom.
* Range: **\~116,800 to \~117,500 USD**
* This zone has acted as **support multiple times** (seen around July 11–12 and now again on July 15).
* Price **bounced** off this area during the most recent dip, but the current candle is testing it again.
---
**Chart Pattern: Bearish Triangle (ABCD Structure)**
Marked by the labels **A, B, C, D**, forming a **descending triangle**, typically a **bearish continuation pattern**:
* **A to B:** Sharp drop (initial leg down).
* **B to C:** Rebound, but fails to reclaim highs.
* **C to D:** Tightening price action inside the triangle.
* After **D**, there’s a **breakdown**, leading to heavy selling.
---
**Breakdown and Sharp Decline**
* Price **breaks below the triangle support** with a long red candle.
* Massive sell-off continues, pushing BTC below **\$118,000**.
* The current price is around **\$117,481**, hovering near the key support zone.
---
**Trend Observation**
* Before the triangle, there was a **strong uptrend** leading up to \~\$123,000.
* The triangle acted as a **distribution zone** before the **reversal** began.
* The trend has shifted from **bullish** to **bearish** post-pattern.
---
🔍 Summary of Key Levels:
| Level Type | Price Range |
| ---------------- | ------------------- |
| Resistance (Top) | \~\$123,000 |
| Breakdown Point | \~\$120,400 |
| Support Zone | \~\$116,800–117,500 |
thanking u
Doge can be a great long position Altcoins are about to start going up. And the Dogecoin has a strong resistance ahead. It can be a 1:9 or higher RRR.
*This is not a financial advise and is just an experimental idea.

Important News for EURUSDYesterday, EURUSD continued moving sideways as the market waits for upcoming news.
Today at 1:30 PM London time, U.S. inflation data will be released.
This report has a strong impact and is likely to set the next direction for the pair.
It’s advisable to reduce your risk and avoid opening new positions before the news comes out.
The goal is to follow the trend once it resumes!

GBPUSD downtrend continuesOANDA:GBPUSD is trading in a bearish channel heading towards the important support zone of 1.340. This is the bottom support zone of last month so there is a lot of buying pressure in this zone. Any recovery of GBPUSD is considered a good opportunity to enter a SELL signal to the target. When the price breaks 1.361, the downtrend will really break.
Support: 1.340
Resistance: 1.355-1.361
SELL Trigger: rejection 1.355 with bearish confirmation
SELL zone 1.361 (Strong Resistance zone)
Target: 1.340
Leave your comments on the idea. I am happy to read your views.
USD/JPY short: Clash of the TitansHello traders
I entered into a short GBP/JPY position last week after the contraction in GBP Industrial, manufacturing production and GDP. The United Kingdom is also struggling with their own version of the Big Beautiful Bill. The difference is of course that there is no Republican Congress there who is willing to throw their constituents under the bus by cutting Medicaid.
The technical side of USD/JPY is vanilla but the fundamental side is a whole other enchilada.
The sweeping tariffs from Liberation Day MAY become a moot market mover if the Federal Court of Appeals side with the International Trade Court after July 31st. It does not mean that all tariffs will become null and void. My previous IDEA elaborates a little on this.
The Israel/Gaza conflict is still simmering and has just been turned up a notch after an American/Palestinian was beaten to death by West bank settlers. Tragic.
There is no certainty how Iran may still retaliate against the USA after the nuclear site strikes.
The BIG one: President Donald J Trump is finally standing up to Vladimir Putin by announcing the shipment of Patriot missiles to Ukraine. This is a major milestone and turning point for President Trump who was previously under the impression that he can manage Foreign Policy by cozying up to the Russian and North Korean strongmen. Welcome to the real world. Putin, Xi Jinping and Kim Jong Un have been scheming behind your back to support the war against Ukraine.
This is the point where the fictional Dutch boy who used his finger to prevent a leaking dike to prevent a flood might be you, President Trump.
The safety and security of the entire Western World rests on your shoulders at this precise point in time. If Russia conquers Ukraine, it will only be a matter of time before the next European Sovereign country becomes a target. Should this happen, it will also serve as a proxy for the Chinese invasion of Taiwan. And North Korea invading South Korea. Bit of a stretch but not impossible.
Against this background, moving funds into the traditional safe havens of JPY, CHF and Gold make senses and I contend that BTC has joined the list.
Super long dated JPY 40Y bonds have also ticked up in anticipation of upcoming elections and conflicting policies.
The American people definitely do not have the desire or political will to enter into another war BUT it is maybe time for us to become the International Order Sheriff again. Towards this end, I am finally willing to call you my President and Commander in Chief, DJT.
Please be the Titan who does not pick on his own citizens and stand up to the real danger on our planet. Godspeed.

XAUUSD Trade Plan | 15 July 2025After observing the recent low breakdown and a clear liquidity grab, we saw a strong direction confirmation breakout. This suggests that the market is likely to continue its upward momentum.
🔄 Breakdown/Seller Trap triggered the reversal
🔹 Last Important Low respected
📈 Breakout confirms bullish direction
✅ Plan:
I’ll be watching for a pullback into the grey demand zone (highlighted area) for a potential long entry.
🕵️♂️ No FOMO — I’ll only enter after price shows clear bullish behavior in this zone.
🎯 Target: 3,365.89 resistance
📍 Entry Zone: Grey box (based on previous structure)
Let me know your thoughts — are you also watching this zone?
#XAUUSD #GoldAnalysis #LiquidityGrab #SmartMoneyConcepts #PriceAction #TradingPlan #TradingView

Major LowI'm buying puts expiring on October 31st, All Hallow's Eve.
I'll give price room to keep melting up to 666 at the farthest, that is my stop level. If we breach that price, then just know that tech is unstoppable and Artificial Intelligence is the Mark of the Beast.
If the market doesn't drop here, then the sky is the limit.

$CRV Macro Bearish PlayWe had an inverse cup and handle at .6266 that broke down to .50 and didn't meet its target (.40-.42 area). Instead, we consolidated at .50 to expand the smaller inverse cup neckline to .5503. This move up from .50 to .73 (currently) is a slighty over extended handle. If we continue higher but fail to establish support @ .8231, the next bearish structure is a double top with its peaks finding resistance around .82-.86 and neckline @ .5385. The rest is self-explanatory in the chart.

RGTI Heading to $17+ Good evening trading family
So currently due to price action it appears we are on our way to 17 dollar target however we expect a little bit of a correction at the 15 range.
However worst scenario if we go below 11 dollars be prepared for a sinker down to 8.
Trade Smarter Live Better
Kris/ Mindbloome Exchange
