Ripple and XRP 2025-2026 Outlook: Institutional Adoption, ETF M While most investors rely on chart patterns and historical indicators to guide their decisions, the real edge lies in forward-looking analysis. While trading patterns provide valuable insight for short-term volatility-based investing, understanding roadmaps and projected outcomes paints a far clearer picture of an asset's long-term potential—and helps investors anticipate when price changes are likely to occur. In the world of crypto—where social sentiment can be engineered and narratives drive short-term price swings—it's critical to focus on roadmaps, regulatory movements, and institutional integration.
Utility-based crypto like XRP gains value not just from speculation, but from the outcomes it delivers: seamless cross-border payments, compliance infrastructure, and financial interoperability. This article explores what's already unfolding and what's expected to reshape the XRP landscape through the end of 2025 and into early 2026.
This is not financial advise, just my viewpoint... While some of these events may not happen, they are speculated as ongoing with completion dates stated.
Conservative Price Range Estimate: $6.00 by January 2026 ( My personal view, could be more, could be less.. do your own research)
July 2025: Regulatory Foundation and Institutional Signaling
ProShares XRP Futures ETF Launch (July 18): While a futures ETF doesn’t create real XRP demand, it establishes institutional access and boosts trading legitimacy. XRP saw a 5% short-term lift on the news.
Ripple Applies for a National Bank Charter (July 2): Ripple seeks a U.S. national trust bank license and Federal Reserve master account, aiming to custody RLUSD reserves directly and offer banking services. This move would make Ripple the first crypto-native bank regulated at the federal level.
BNY Mellon Partners on RLUSD Custody: The stablecoin RLUSD will be backed by assets held with BNY Mellon, significantly enhancing institutional trust.
Congressional Crypto Week (July 14-18): Multiple pro-crypto bills including the GENIUS Act and CLARITY Act are set for vote. If passed, they will clarify stablecoin frameworks and digital asset classifications.
July set the tone for XRP’s transition into institutional finance. With the launch of a ProShares XRP futures ETF, investor interest saw a legitimate on-ramp into regulated markets. Ripple’s application for a national bank charter and its RLUSD custody deal with BNY Mellon signal a serious bid for integration with the U.S. financial system. Meanwhile, Congressional attention to crypto regulation during “Crypto Week” builds the political and legal scaffolding Ripple needs to operate as a licensed banking entity.
August 2025: Finalizing Frameworks
OCC Public Comments Close (Aug 1): Comment period on Ripple’s bank charter ends, allowing regulatory evaluation to begin.
SEC ETF Template Finalization Expected: New rules and disclosures for spot crypto ETFs could be released, paving the way for streamlined XRP spot ETF approvals.
Progress on Crypto Legislation: The GENIUS and CLARITY Acts may pass both chambers, offering Ripple and XRP a compliant and recognized framework under U.S. law.
In August, the public commentary on Ripple’s bank application closes, beginning a phase of federal evaluation. The SEC is expected to clarify spot ETF guidelines this month, which would streamline XRP ETF approvals. Combined with likely legislative wins in Congress, August is expected to deliver the regulatory clarity Ripple needs to unlock deeper capital flows and onboarding from cautious institutions.
September 2025: Institutional Inroads
Franklin Templeton XRP Spot ETF Approval: With public comments completed in July, the SEC is expected to rule on Franklin’s ETF by late September. Approval would create true XRP demand from asset managers.
Ripple Bank Charter Decision Expected: Based on standard OCC timelines, a decision could land in September, granting Ripple official trust bank status.
Bank Adoption of RippleNet: New U.S.-based banks are expected to onboard RippleNet and RLUSD, pending charter clarity.
September may mark one of XRP’s most pivotal months. The expected approval of the Franklin Templeton spot XRP ETF introduces real XRP demand from traditional financial platforms. Ripple’s bank charter decision is anticipated, which, if approved, formalizes Ripple as a regulated trust bank. Institutions watching from the sidelines could begin onboarding RippleNet and adopting RLUSD as a digital settlement instrument.
October 2025: Full Financial Integration
Federal Reserve Master Account Approval: If the bank charter is approved, Ripple may gain direct Fed access, reducing friction in cross-border liquidity operations.
Hidden Road Acquisition Finalized: Ripple’s $1.25B purchase of the prime-brokerage platform expands XRP Ledger's reach into institutional DeFi.
Crypto Regulatory Acts Signed Into Law: Expected signing of the GENIUS and CLARITY Acts into federal law establishes Ripple and RLUSD as compliant players.
October represents a leap from planning to execution. If Ripple secures a Federal Reserve master account, it gains direct access to U.S. payment rails—dramatically reducing cross-border friction. The finalization of Ripple’s acquisition of Hidden Road builds new institutional bridges to DeFi. With the GENIUS and CLARITY Acts likely signed into law, Ripple’s operations become formally protected under U.S. legislation.
November 2025: Global Payment Infrastructure Alignment
SWIFT ISO 20022 Final Cutover (Nov 22): RippleNet becomes a competitive ISO-native alternative as legacy systems complete their migration.
Banking Partnerships Expand: With charter and Fed access, expect Ripple to announce new integrations across both U.S. and global banks.
November marks the global synchronization point. SWIFT’s ISO 20022 cutover transitions legacy finance into the same language RippleNet already speaks. This timing could prompt a new wave of partnerships from U.S. and international banks looking for compliant, faster alternatives. The technical alignment removes a final excuse for not adopting Ripple’s infrastructure.
December 2025: Stablecoin Acceleration
RLUSD Volumes Surge: With the infrastructure in place, stablecoin transactions over XRPL and Ethereum are expected to see significant enterprise use.
New Spot ETF Filings: Firms like Bitwise, 21Shares, and WisdomTree may file or receive approvals, expanding XRP's ETF market share.
Year-End Analyst Price Targets Raised: Institutional research desks may revise XRP targets upward, citing infrastructure, compliance, and volume data.
With legal clarity and infrastructure live, RLUSD adoption is expected to surge in December. Stablecoin flows through Ethereum and XRPL should grow significantly, showcasing XRP’s value in facilitating enterprise-grade financial transactions. Analysts are expected to raise XRP price targets based on these integrations and actual volume, setting up a strong year-end momentum.
January 2026: DeFi and XRP Ledger Scaling
Hidden Road Tooling Goes Live: DeFi integrations through institutional APIs create new XRP use cases.
RippleNet Usage Reporting: Post-charter metrics likely show increasing XRP volumes in institutional corridors.
New U.S. Legislative Proposals: Follow-on legislation could further streamline crypto regulation, with bipartisan support likely to continue.
January begins with tangible growth. Ripple’s DeFi strategy via Hidden Road goes live, giving institutions plug-and-play access to XRP-based liquidity protocols. Early usage metrics post-charter will offer proof of adoption. With bipartisan momentum behind crypto legislation still building, 2026 could see an even deeper alignment of XRP within regulated finance.
Strategic Outlook
The convergence of banking infrastructure, spot ETF exposure, and regulatory clarity may push XRP into a sustained growth arc. If Ripple secures its charter and Fed access while ETFs go live, XRP could see institutional capital inflows, utility-driven velocity, and price discovery not seen since its early 2018 surge.
Estimated Price Range (Base Model): $5.00 to $6.50 by January 2026
Key Watchpoints:
OCC and Federal Reserve decisions
Spot ETF trading volumes
RLUSD transaction data
Adoption by banks and brokers
XRP's next chapter is not just about price—it's about becoming a foundational asset for regulated global finance.
Fundamental Analysis
Viking Holdings (VIK) – Sailing Ahead in Luxury TravelCompany Snapshot:
Viking NYSE:VIK is a premium cruise operator targeting affluent retirees and “active agers”, offering adult-only ships and experiential itineraries designed for high-value travelers seeking enrichment and comfort.
Key Catalysts:
Premium Brand with Pricing Power 💰
Unlike many peers, Viking has avoided deep discounting, maintaining premium pricing—a testament to brand equity and customer loyalty, protecting margins amid inflationary pressures.
Exceptional Demand & Occupancy 📈
Occupancy rates consistently above 90% reflect both high demand and strong operational execution, boosting revenue per cruise and signaling long-term customer retention.
Tailwinds from Demographic Trends 👴🏻👵🏻
Viking is uniquely positioned to benefit from the global growth in affluent aging populations, who prioritize experience-driven travel over material consumption.
Investment Outlook:
Bullish Entry Zone: Above $46.00–$47.00
Upside Target: $75.00–$76.00, powered by brand strength, margin durability, and demographic-driven demand.
🛳️ As a leader in luxury cruising, Viking is charting a long-term growth course anchored in loyalty, premium experiences, and generational travel trends.
#VikingCruises #VIK #LuxuryTravel #ExperientialTourism #CruiseStocks #ActiveAgers #RetirementBoom #TravelDemand #PremiumBrand #ConsumerDiscretionary


HK50 Index Robbery Plan – Bulls in Control, Load Up🚨💸💥**HK50 MONEY HEIST ALERT – Thief Trading Style Entry Plan!**💥💸🚨
"Swipe the Trend, Rob the Risk – The Hong Kong Vault is Open!"
🌍🌎Hey there, Global Money Movers, Heist Planners & Market Robbers!🕵️♂️💰
Welcome to another high-stakes operation brought to you by the Thief Trading Style – where strategy meets chaos, and profits are earned with precision. 🏴☠️📊
🎯 Mission Brief: HK50 Index Robbery – Long Entry Blueprint
Based on our exclusive blend of technical & fundamental analysis, the HK50 (Hong Kong Index) is entering the Loot Zone – bullish bias detected and price action confirming a strategic long opportunity. Here's how we execute the plan:
🔓 ENTRY – The Vault is Open!
🎯 Strike anywhere near recent swing lows/highs on the 15m or 30m timeframe.
💡 Ideal Entry Zones: Closest bullish structure or reversal support.
📌 Tip: Set alerts at key reaction zones – timing is the true thief’s edge.
🛑 STOP LOSS – Escape Hatch Point
🛡️ SL placed below nearest swing low on the 4H timeframe (~23640.0).
💡 Adjust based on your risk tolerance, lot size, and trade stacking.
🏁 TARGET – The Getaway Route
🎯 TP zone: ~25200.0
🚀 Optional: Use Trailing SL to maximize robbery exit on spikes or trap fails.
💬 “Escape before target” if market sentiment flips or volatility surges.
🧲 Scalper Alert: Ride the Bull Only!
💵 Scalping allowed on buy side only.
If you’ve got capital power – go direct. Otherwise, join the swing thieves and ride with momentum. 📈💣
🧠 Why Bullish? | Heist Justification
📊 Current momentum supported by:
🔎 Technical Trend Reversal Patterns
📉 ATR exhaustion near previous downside levels
📰 Positive Macro, Global Cues, & Institutional Sentiment
👉 For the full scoop – combine this with:
📰 COT Data & Market Sentiment
🌐 Intermarket & Geopolitical Outlook
📈 Index-Specific & Seasonal Cycle Studies
Stay ahead, rob smart! 💼💼
⚠️ Risk & News Alert – Don’t Get Caught!
🔔 Avoid entries during major news drops!
✅ Use trailing stop-losses on running trades.
🚷 Protect your loot at all costs – market volatility is the real SWAT team! 🚓
💥Support Our Robbery Crew!
📢 Smash the Boost Button 💣💥 to support the Thief Trading Style revolution!
Together, we rob with discipline, plan with clarity, and exit with satisfaction.
💰Let’s stack profits, not just candles. 📈🤑
📝 Disclaimer:
This is a high-level market outlook, not financial advice. Adjust based on your capital, risk tolerance, and analysis. Always monitor your trades and adapt to the ever-changing market landscape.
Follow for more Heist Plans – this is just the beginning! 🕶️🔐
**See you at the next vault…**🚁💼📈
#ThiefTrading #HK50 #MarketHeist #IndexAnalysis #BullishBreakout #SmartMoney #ScalpersWelcome #SwingTrading #TechnicalAnalysis #RiskReward #TradingViewElite #ProfitWithStyle

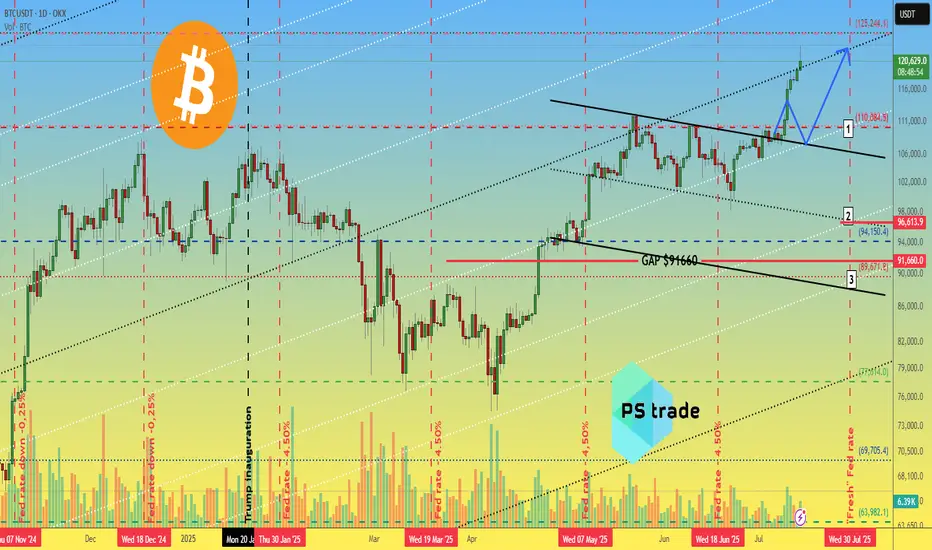
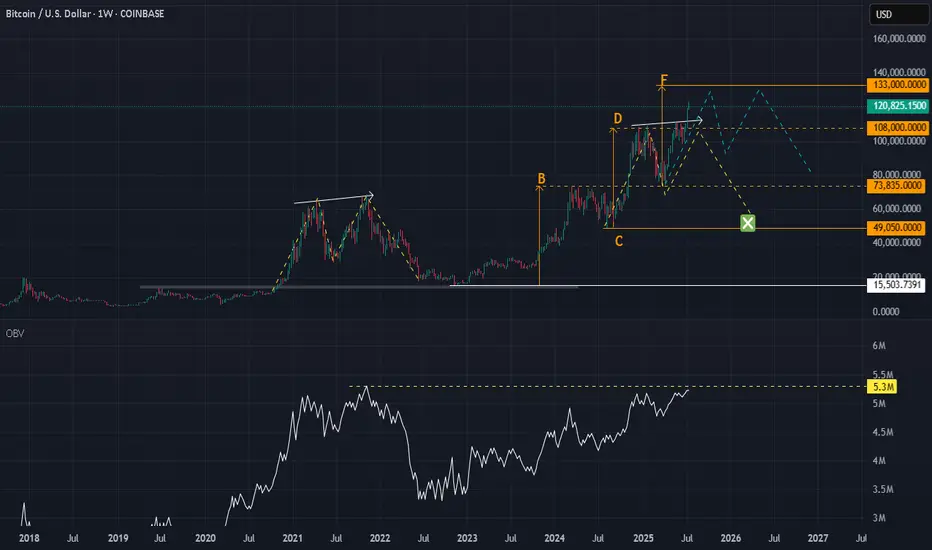
Bitcoin BTC price analysis📈 Two weeks have passed since the previous analysis of the OKX:BTCUSDT chart, and the market has decided to go with the 1️⃣ scenario.
Less than 3% remains to reach $125,000, and the price could easily get there by inertia, but that's a minor detail.
CRYPTOCAP:BTC is updating its ATH, and total liquidations on the crypto market over the past 24 hours are “only” $750 million, of which almost $450 million is accounted for by #Bitcoin.
Weak, very weak... Previously, longs were liquidated for $2+ billion, and it was reported that the actual amount of liquidations was significantly higher due to the fact that the exchanges' data was not fully disclosed. (For the sake of objectivity, at that time, the lion's share of liquidations was accounted for by altcoins, but now this is not the case).
◆ During this time, Trump introduced new tariffs — the market was “on a roll” — it swallowed it and didn't even notice the news.
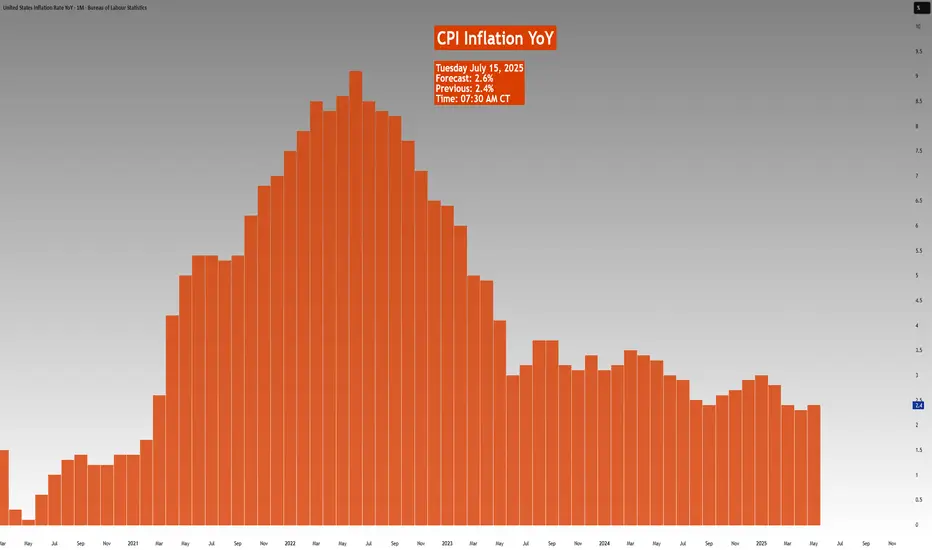
◆ Tomorrow, July 15, the US CPI will be announced — the forecast is for inflation to rise from 2.4% to 2.6% (although there are rumors that the situation in the US economy is much worse and this may "come to light" tomorrow).
◆ July 16 - PII announcement - these indicators may act as a “cold shower” to bring the market out of its euphoria.
◆ From July 14 to July 18, the US Congress is considering three key crypto laws, including the GENIUS Act. Major players consider this a powerful driver. Perhaps the current growth has already “played out” and priced in expectations for news.
🪐 And this trading week will end on 18.07 with the start of Mercury retrograde, even the US Congress is postponing all important matters, and you still don't believe in it ))
🖐 Long positions are certainly beneficial, appropriate, and in line with the trend at present, but it is advisable to hedge them with stops, because as mentioned above: the price is rising, and there are few liquidations. During the previous decline in the cryptocurrency market, there were significantly more liquidations of long positions, and they may wish to repeat this.
And with the #BTCUSD price correction, there will be a fixation: some will have profits, and some will have losses in stablecoins, which would then be logical to reinvest as capital in altcoins. First in something more voluminous and less risky, and in the last stage, they will pump everything in a row)
But until then, we still need to survive and preserve our deposits.
So, in your opinion: correction to one of the levels:
1️⃣-$110k 2️⃣-$97k 3️⃣-$90k
or
is everything written above complete nonsense, and the market growth has only just begun to “take off”?
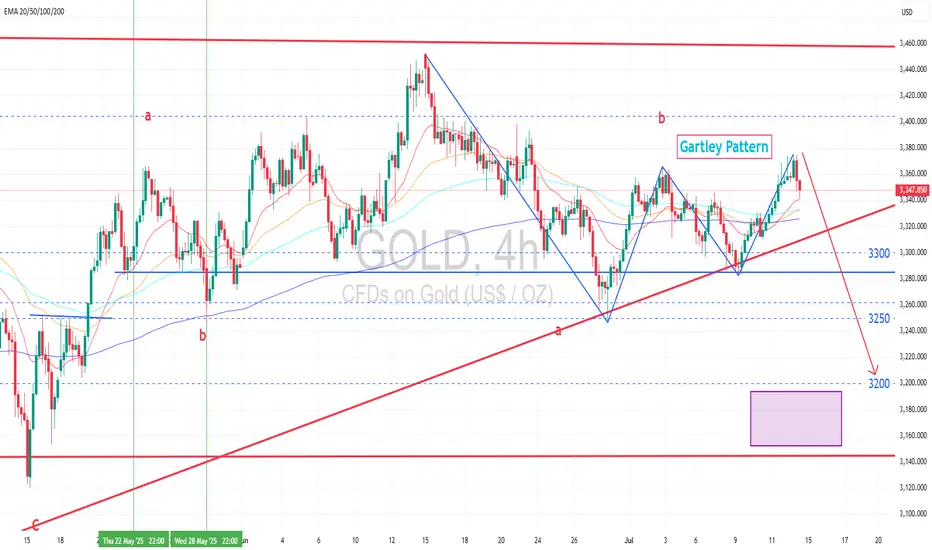
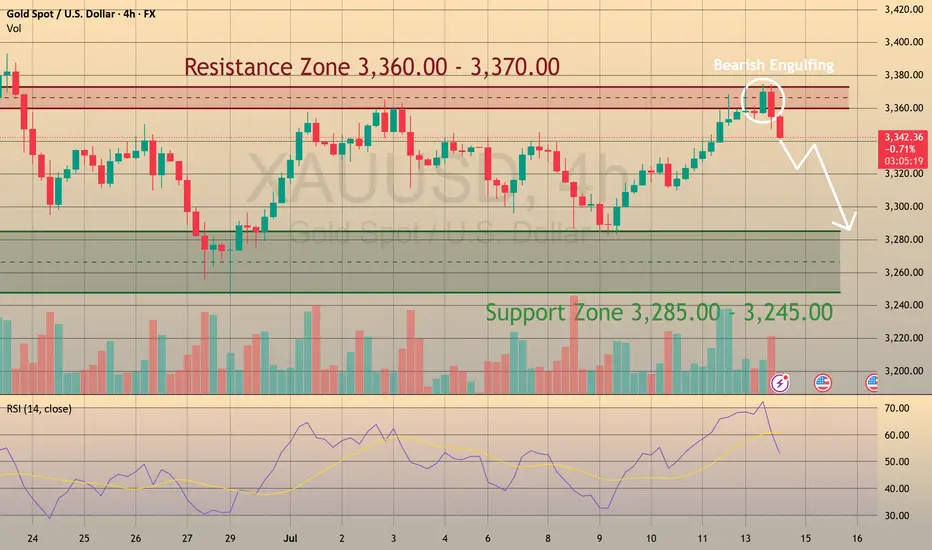
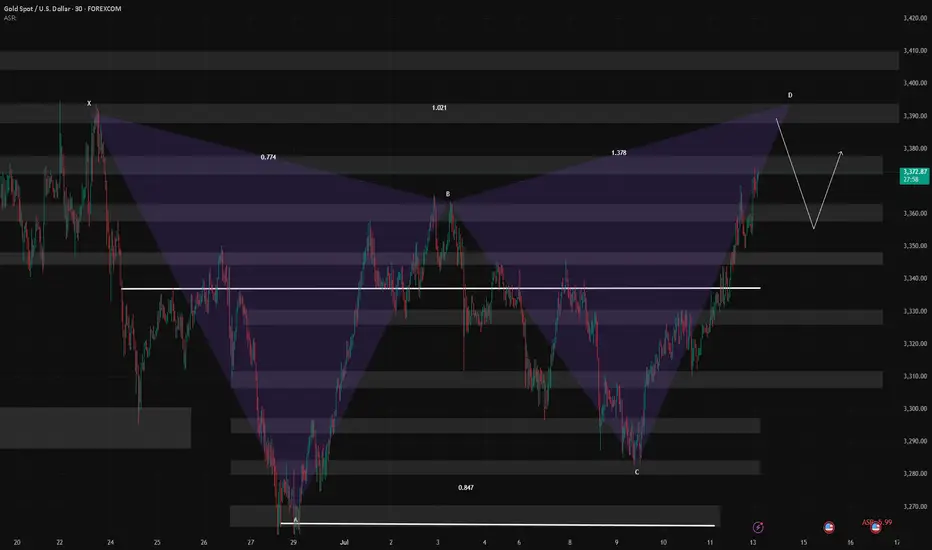
Gold price has completed a Gartley pattern and is now in legGold price has completed a Gartley pattern and is now in leg C of a corrective wave.
Gold appears to start a downtrend following the completion of a Gartley pattern . This move suggests a potential bearish reversal, with the current decline likely marking the start of a sustained move to make a significant lower low, rather than a short-term pullback.
The price of gold peaked at 3375, which is at the key 61.8% Fibonacci retracement level. A reversal to start a new downtrend is therefore possible.
In terms of Elliott Wave theory, this can be counted as the completion of sub-wave c of wave B of a bearish corrective wave. Therefore, this downtrend is likely to see a lower low than the trough made on July 9th and the downtrend might last for 1-2 weeks.
This decline is likely starting from to a profit-taking sell-off on rebound.
During this period, the US dollar, which appears to be recovering at least in the short term, could add further pressure on the gold price.
US CPI data, set for release tomorrow (July 15), is widely expected to show an increase. A stronger inflation reading would likely prompt the Fed to delay rate cuts, reinforcing its hawkish stance and dampening speculative appetite for gold.
Over the next 1–2 months, the Fed is unlikely to take action as per a cautious stance due to tariffs, which may leave gold prices directionless in the near term due to the absence of clear monetary signals.
Analysis by: Krisada Yoonaisil, Financial Markets Strategist at Exness
EUR/CAD: Quant-Verified ReversalThe fundamental catalyst has been triggered. The anticipated strong Canadian CPI data was released as expected, confirming the primary driver for this trade thesis. Now, the focus shifts to the technical structure, where price is showing clear exhaustion at a generational resistance wall. 🧱
Our core thesis is that the confirmed fundamental strength of the CAD will now fuel the technically-indicated bearish reversal from this critical price ceiling.
The Data-Driven Case 📊
This trade is supported by a confluence of technical, fundamental, and quantitative data points.
Primary Technical Structure: The pair is being aggressively rejected from a multi-year resistance zone (1.6000 - 1.6100). This price action is supported by a clear bearish divergence on the 4H chart's Relative Strength Index (RSI), a classic signal that indicates buying momentum is fading despite higher prices.
Internal Momentum Models: Our internal trend and momentum models have flagged a definitive bearish shift. Specifically, the MACD indicator has crossed below its signal line into negative territory, confirming that short-term momentum is now bearish. This is layered with a crossover in our moving average module, where the short-term SMA has fallen below the long-term SMA, indicating the prevailing trend structure is now downward.
Quantitative Probability & Volatility Analysis: To quantify the potential outcome of this setup, we ran a Monte Carlo simulation projecting several thousand potential price paths. The simulation returned a 79.13% probability of the trade reaching our Take Profit target before hitting the Stop Loss. Furthermore, our GARCH volatility model forecasts that the expected price fluctuations are well-contained within our defined risk parameters, reinforcing the asymmetric risk-reward profile of this trade.
The Execution Plan ✅
Based on the synthesis of all data, here is the actionable trade plan:
📉 Trade: Sell (Short) EUR/CAD
👉 Entry: 1.6030
⛔️ Stop Loss: 1.6125
🎯 Take Profit: 1.5850
The data has spoken, and the setup is active. Trade with discipline.

"Ethereum Is The New Bitcoin" - Tom Lee ETH / Stablecoins Are the ChatGPT of Crypto
Stablecoins are exploding in adoption — just like ChatGPT took over AI and Ethereum is the engine driving that revolution. In this post, we break down 10 reasons why Tom Lee is extremely bullish on Ethereum and why it could be the single most important digital asset in the future of finance . If you're sleeping on ETH, this might be your wake-up call.
Top 10 Bullish Points from Tom Lee on Ethereum:
• Ethereum is the backbone of stablecoins , which Tom Lee compares to the “ChatGPT of crypto” due to their viral adoption and massive utility.
• Over 51% of all stablecoins operate on Ethereum , contributing to around 30% of the network’s total fees.
• Ethereum network fees could 10x as stablecoin usage grows from $250 billion to $2 trillion.
• Ethereum is positioned to lead the tokenization of real-world assets , including stocks and real estate.
• ETH could reach $10,000 if asset tokenization becomes a mainstream financial practice.
• Ethereum has a regulatory edge in the U.S. , making it the preferred platform for compliant financial innovation.
• A $250 million ETH treasury strategy is underway , aiming to use Ethereum as a long-term reserve asset.
• Institutions will buy and stake ETH to secure stablecoin networks, making ETH the “next Bitcoin.”
• Ethereum dominates the crypto ecosystem , with nearly 60% of activity including DeFi, NFTs, and dApps built on its chain.
• HODL ETH for long-term growth , as its utility, demand, and institutional support continue to rise.
Conclusion:
Ethereum isn’t just a Layer 1 blockchain — it’s becoming the core financial infrastructure for the digital age . As stablecoins expand and institutions enter, ETH could be the most asymmetric opportunity in crypto right now.
📢 Drop a like, leave your thoughts in the comments, and don’t forget to follow for more powerful macro + crypto insights. 👍👍

Big Week for Markets: U.S. CPI Tomorrow – What It Means for GoldThis week is packed with news, but the main focus is the U.S. CPI report dropping tomorrow.
🗓 Key Event: U.S. CPI Report
📍 July 15, 2025 | 12:30 p.m. UTC
The CPI report measures inflation and heavily influences the Fed’s rate decisions. Last month’s CPI came in at 2.4% vs. 2.5% expected, following 2.3% vs. 2.4% in April. While it seems inflation is rising, the bigger picture shows stable annual inflation in the 2.3%–3.0% range, keeping things under control—likely the reason Trump is pressuring Powell to cut rates.
Market expects June CPI to be 2.7%.
🤔 Possible Scenarios:
1️⃣ CPI > 2.7%: Bullish for DXY 📈. The stronger the print, the bigger the spike, but I see this scenario as less probable.
2️⃣ CPI < 2.7%: Bearish for DXY 📉. We may see a USD dump, though likely shallow since CPI could still be higher than previous months.
✨ What About Gold?
I don’t expect a major reaction in gold:
✅ Higher CPI? Gold often benefits as an inflation hedge.
✅ Lower CPI? Also supportive for gold as it weighs on the USD.
🔍 Technical Outlook:
Gold has been trading within a triangle since April 22, forming lower highs and higher lows. We may currently be in Wave D (Elliott Wave), aiming toward the triangle’s upper boundary slightly above $3,400 resistance. After that, Wave E may develop – but that’s a story for another post.
EURusd long position 14/07/2025English : According to our analysis, we anticipate a bullish scenario.
Morocan Darija : kanchofo d'apres l'analyse dyalna antsanaw tlooo3
ATENTION : I only share my ideas, not signals

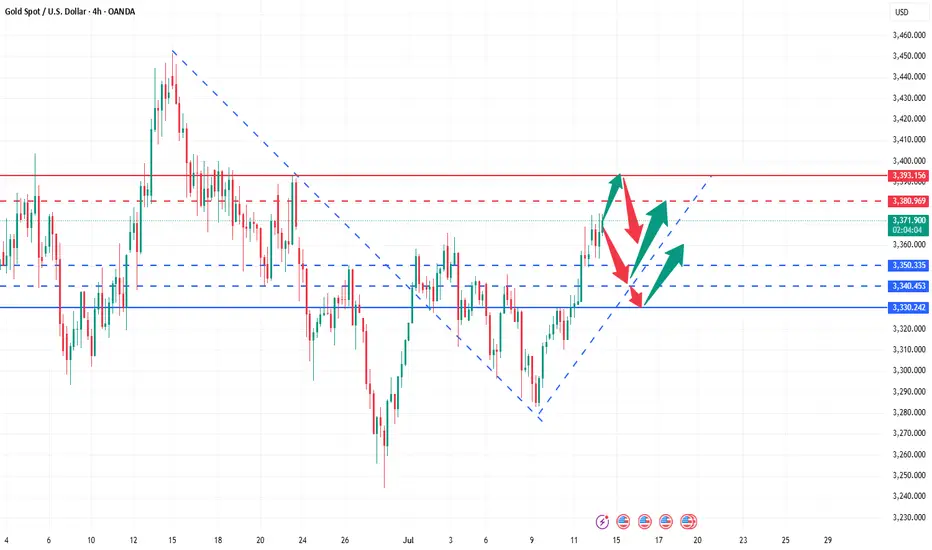
Gold rises strongly, aiming for a new high!Last Friday, gold continued to rise strongly, breaking through 3320 in the Asia-Europe session and accelerating its rise. The European session broke through the 3340 mark continuously. The US session broke through 3369 and then fell back. The daily line closed with a big positive line. It broke through the high for three consecutive days and returned to above 3360. The unilateral bullish pattern was re-established. Today, the gold price jumped high and broke through 3370 and then fluctuated at a high level. Although it rushed up, the strength was limited. It must be adjusted after a short-term retracement before it can continue to rise. Therefore, in terms of operation, we continue to maintain the main idea of retreating and multiplying. Pay attention to the 3340-3345 area for short-term support during the day, and look at the 3330 line for strong support. If it does not break, it will continue to be a good opportunity to buy low and do more. Taking advantage of the trend is still the current main tone. As long as the daily level does not break 3330, the bullish structure will not be destroyed.
🔹Support focus: 3340-3345, key support level 3330
🔹Resistance focus: 3380-3393 area
1️⃣ If the price falls back to 3340-3350, a light long position will be intervened, with the target of 3365-3370. A strong breakthrough can see a new high;
2️⃣ If the price rises to 3380-3393 and is under pressure, a short-term short position adjustment can be tried, with a short-term target of around 3360.
The specific real-time points and position arrangements will be updated at the bottom. Interested friends are advised to pay attention to my strategy tips in a timely manner and seize every opportunity reasonably.
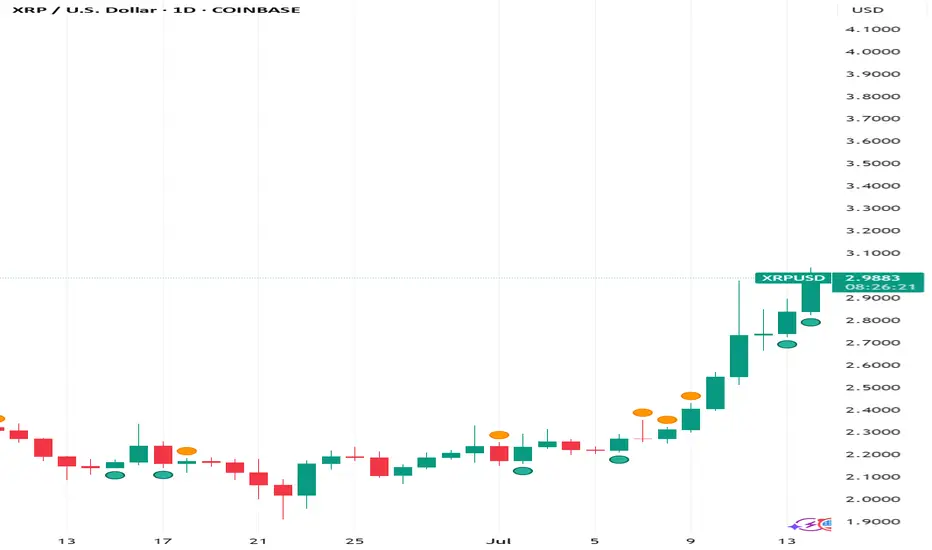
XRP SHOOTS UP TO $3! 🌠 Wow, we'll, we've done it. We've hit $3 once again. Before I start this idea just want to give my thanks for tuning in, appreciate it.
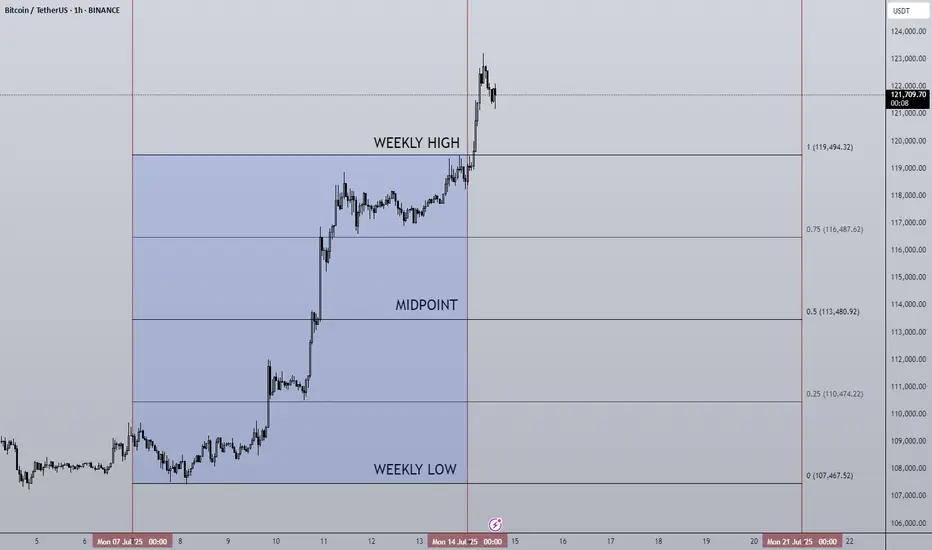
🌠 This month has been pretty incredible for Ripple to say in the least from the BNY-Mellon Custodian Deal to Trump's Media company filing for a crypto Blue Chip ETF of which included the likes of XRP. With all the news and positive sentiment around XRP and Bitcoin which itself has hit a new All-Time-High hitting $123,000! Below I'll add a Bitcoin chart for reference:
🌠 To say in the least it's been a golden month for Crypto and Digital Assets. And one important thing to note is that as of today the Fedwire Funds Service is set to go live with the ISO 20022 standard starting July 14, 2025. The implementation will replace Fedwire's dated (FAIM) format with the ISO 20022 message format with the change happening over a single day.
🌠 For those that don't know ISO 20022 is a global messaging standard for financial transactions meant to reduce cost and fraud alongside automate transactions and reduce transactional costs. What this means for XRP is that it could become a much bigger player in cross-border payments now through RippleNet as XRP is one of the selected assets for the ISO 20022 standard.
🌠 ISO 20022 and global institutions will start utilizing XRP and it's ability to process transactions seemingly instantly and efficiently while significantly cutting down on cross border and transaction costs making it a considerably solution for banks and financial institutions. After all, if your objective is to make money, and you can make more money while cutting down on costs and making transactions, record keeping much simpler, then why not? Especially in an age where everyday things are continuously advancing and improving nobody want's to be left behind. Especially the big financial players.
🌠 Curious to see if prices can hold and keep pushing but just going off technical, we already know $3 is a tough point. At $3 just over 95% of XRP holders are in profit which makes a good reason for many to sell and take profit but with all the news and ISO now really kicking in we may not see as much selling, especially as holders are more confident and less likely to be swayed in letting go of their XRP. So it'll definitely be interesting to see how things play out.
🌠 Main thing will be Bitcoin, even if XRP holders hold I can't guarantee the same for Bitcoin, especially should it start to reverse, we know how financial institutions play taking advantage of the news. Just be cautious and set some price level alerts whether your trading XRP or Bitcoin.
🌠 In the long run things look very good regardless of what happens in the next week or two so keep that in mind. I'll be watching XRP to see if we can continue and break $3 but in my experience, with these impulse waves we usually see a big move up followed by some retracement as traders look to test support and liquidity so the waters may turn choppy but again like I said, we're here focused on the long term, whatever happens happens. We'll still be here for that but nonetheless the main objective is the longterm. $3 may seem like a lot but it's nothing compared to what XRP has in store.
🌠 This week is also 'Crypto Week' for lawmakers in DC as U.S lawmakers get ready to potentially pass changes in the regulatory setting when could push even more institutional demand further adding to the hype and optimism the crypto space has been running with as of lately.
🌠 Have to run but thanks as always for tuning in, really appreciate it and hope everyone is doing well! thanks as always and all the best till next. Feel free to keep posted and follow for more as always.
Best regards,
~ Rock '

Good opportunity to wait for recovery and buy GoldOANDA:XAUUSD Confirmation of breaking Key level 3330 on Friday has formed an Uptrend in Gold. Reaction at GAP 3368 is obvious in an uptrend. Gold trend is favoring buying to 3388 and 3400 next week.
Support: 3345-3331
Resistance: 3387-3400
BUY Trigger: Retest and Reject support 3345
BUY Trigger: 3331 ( Strong support zone)
Target: 3400
SELL Trigger: rejection 3387 with bearish confirmation
Leave your comments on the idea. I am happy to read your views.

BTCUSD : b-e-c-a-r-e-f-u-lMaybe price is just trying to buy back what was sold previously.
Of course, now at a higher price.
By the look of it, there isn't any new 'supply'.
Do you think price can move higher if there is NO supply - no one 'selling'?
Good luck.
AUDUSD: Short Setup Ahead of Key Data OANDA:AUDUSD
AUDUSD is hovering near a rising trendline, with price action compressing and signaling a potential downside break in the coming sessions.
Just above, the 0.65900 resistance zone has capped recent rallies, and the pair’s failure to clear this level strengthens the case for a reversal.
Later today, we will see Westpac Consumer Confidence data for Australia, which could act as a catalyst for a sharp move. A weaker-than-expected print would likely pressure the Aussie further.
📋 Entry Checklist:
✅ Testing rising trendline, signaling potential breakdown
✅ Strong resistance at 0.65900 holding rallies
✅ Key consumer sentiment data could trigger volatility
📈 Trade Plan:
🔻 Sell Entry: 0.65600
❌ Stop Loss: 0.66200
✅ Take Profit: 0.65000
(Tap 👉 Trade Now 👈 on mobile to copy SL & TP easily)
📰 Fundamental Snapshot:
The Reserve Bank of Australia (RBA) surprised markets by holding rates steady at 3.85%, diverging from expectations of a potential cut. The RBA remains cautious amid persistent inflation risks driven by high labor costs and weak productivity, suggesting rates may stay restrictive longer.
Governor Michele Bullock highlighted that inflation could remain above forecasts, while Deputy Governor Andrew Hauser emphasized monitoring global uncertainties, including U.S. tariff developments, reflecting the RBA’s sensitivity to external headwinds impacting growth and trade.

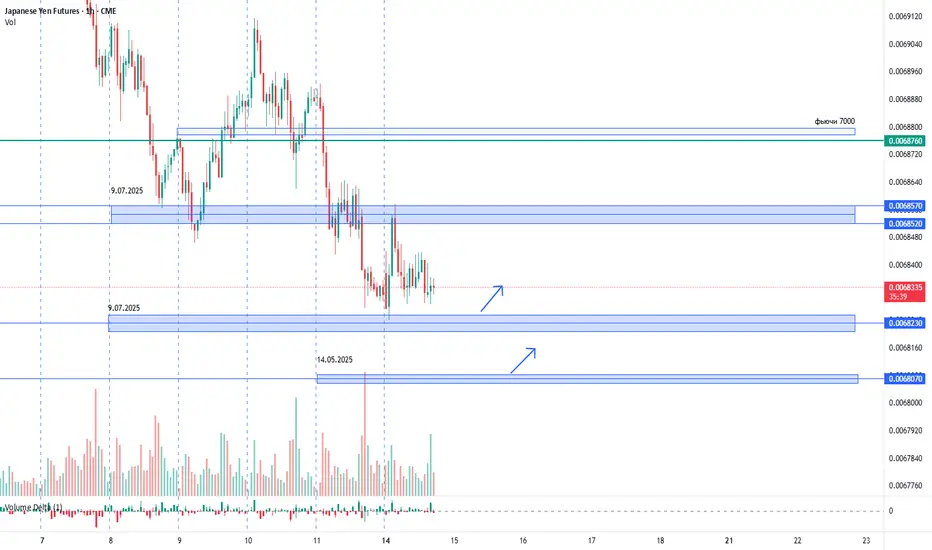
USDJPY. 14.07.2025. The plan for the next few days.The nearest interesting resistance zones have already been worked out at night and have given a good reaction. Let's mark the others where we can expect a reaction. It's not certain that there will be a major reversal, but I believe we will see a correction that can be monetized. We are waiting for a reaction and looking for an entry point.
The post will be adjusted based on changes.
Don't forget to click on the Rocket! =)
Weekly Macro Brief: Chinese Economic Data, US Inflation, Tariff CME_MINI:ES1! CME_MINI:NQ1! COMEX:GC1! CME:BTC1! CME_MINI:RTY1! COMEX:SI1! CME_MINI:MNQ1! NYMEX:CL1! CME_MINI:M6E1! CBOT:ZN1! CME_MINI:MES1!
Highlights this week include Chinese economic data points, UK CPI, US CPI, PPI, and Retail Sales. Inflation data is key, as it comes ahead of the Fed's meeting on July 30th, 2025.
Market participants, including institutional investors and futures brokers like EdgeClear, will be scrutinizing these data points closely to monitor global growth and underlying inflation pressures.
Fed speakers are scheduled throughout the week. With increasing calls for Fed Chair Powell voluntary resignation and impeachment, the US administration desiring lower rates, the Fed’s independence and credibility to carry out its dual mandate is at risk. It will be interesting to monitor who folds first. Last week’s FOMC minutes revealed a divided Fed on the interest rate outlook, affirming its June dot plot.
On the fiscal policy front, we are already witnessing a shift in global trade policies, with many nations making concessions to negotiate trade deals with the world’s largest economy. In our analysis, the inflation impact of tariffs may not show up until Q4 2025 or early 2026, as tariff threats are mostly used as a lever to negotiate deals. While effective tariff rates have increased, as Trump reshapes how tariffs are viewed, cost pass-through to consumers will be limited in Q3 2025, as companies’ front-loaded inventory helps mitigate the risks of increased tariff exposure.
So, what we have is an interesting development shaping up where, while inflation may rise and remain sticky, it is yet to be seen whether slowing consumer spending will weaken enough to the point where companies have to start offering discounts, which would nullify the tariff risk to the end consumer and result in companies absorbing all tariffs. This scenario will see reduced earnings margins leading into the last quarter and early 2026. However, it will materially reduce risks of higher inflation.
In summary, the complex interplay between tariffs, inflation, and consumer behavior presents critical considerations for traders. EdgeClear, as a dedicated futures broker, remains focused on equipping clients with the insights needed to help navigate this evolving macroeconomic environment.
Overnight Data Recap:
• Chinese Trade Balance (CNY)(Jun) 826.0B (Prev. 743.6B)
• Chinese Trade Balance USD* (Jun) 114.77B vs. Exp. 109.0B (Prev. 103.22B)
• Chinese Imports YY* (Jun) 1.1% vs. Exp. 1.3% (Prev. -3.4%)
• Chinese Exports YY* (Jun) 5.8% vs. Exp. 5.0% (Prev. 4.8%)
Key Economic Releases:
• MON: EU 90-Day Retaliatory Pause Ends
• TUE: OPEC MOMR, Chinese House Prices (Jun), Retail Sales (Jun), GDP (Q2), EZ Industrial Production (May), German ZEW (Jun), US CPI (Jun), NY Fed Manufacturing (Jul), Canadian CPI (Jun)
• WED: UK CPI (Jun), EZ Trade (May), US PPI (Jun), Industrial Production (Jun)
• THU: Japanese Trade Balance (Jun), EZ Final HICP (Jun), US Export/Import Prices (Jun), Weekly Claims, Philadelphia Fed (Jul), Retail Sales (Jun)
• FRI: Japanese CPI (Jun), German Producer Prices (Jun), US Building Permits/Housing Starts (Jun), Uni. of Michigan Prelim. (Jul)
China GDP / Retail Sales/ Housing (TUE):
• Q2 GDP is expected to slow to 5.1% Y/Y (vs 5.4% in Q1) and 0.9% Q/Q.
• Retail sales have been resilient, but industrial production and investment show signs of weakness; deflation and labor market concerns persist.
• Property prices continue to decline, fueling stimulus speculation; policymakers remain cautious, with only modest easing expected (LPR and RRR cuts in Q4).
US CPI (TUE)
• June CPI expected at +0.3% M/M headline and core, suggesting a modest rebound from May’s subdued figures.
• Inflation impact from tariffs seen as temporary; Fed officials maintain a cautious stance with possible rate cuts only if price pressures stay benign.
• Markets are pricing near-zero odds for a July rate cut, but still expect two 25bps cuts by year-end in line with Fed guidance.
US Retail Sales (THU):
• Headline June retail sales expected flat M/M; ex-autos expected to rise +0.3%, showing signs of consumer stabilization.
• BofA data shows mild spending rebound, though discretionary service spending continues to weaken, especially among lower-income households.
• Spending strength remains concentrated in higher-income cohorts; weakness in wage growth limits broader consumption momentum.
US Trade Tensions – Tariffs & Negotiations:
• Trump announced 30% tariffs on EU and Mexican goods effective August 1st, separate from sector-specific tariffs.
• Trump stated the EU is engaging in talks and South Korea is also pursuing a trade deal.
Mexico Response:
• President Sheinbaum expects a deal before August 1st but reaffirmed Mexican sovereignty is non-negotiable.
• Mexico’s Economy Ministry is negotiating to protect domestic firms and workers, aiming for an alternative resolution.
EU Response:
• European Commission President von der Leyen warned that 30% tariffs would disrupt key transatlantic supply chains.
• The EU will extend suspension of countermeasures until early August but is prepared to respond proportionally if needed.
• The EU prefers a negotiated solution and dropped plans for a digital tax, seen as a concession to US tech interests.
• Separately, the EU is drafting a broad corporate tax on firms with turnover above EUR 50 million to support its budget.
14/07/25 Weekly OutlookLast weeks high: $119,494.32
Last weeks low: $107,467.52
Midpoint: $113,480.92
NEW BTC ATH!
This is what we've all been waiting for, BTC breaks through resistance at $110,000-112,000 to set a the highest weekly close ever ($119,086). Thanks to a further $2.27B net inflows via BTC ETFs, the passing of the "big beautiful bill" flipping from a more deficit reduction stance by the US to an environment perfectly suited to risk on assets. Things are looking good for Bitcoin.
This week already in the Asia session BTC has broken above the weekly high to hit $123,100. Despite this incredible rally BTC.D has been falling since Thursday of last week. To me this signals altcoins have started to play catch up and we've seen that with ETH breaking $3000 (+14% relative to BTC).
I would like to see BTC consolidating here above the weekly high while altcoin majors break their choppy rangebound environments and shift to a trending environment just as BTC had last week.
There are also major data releases this week:
Tuesday CPI
Wednesday PPI
Thursday Euro CPI
Thursday US Initial Jobless Claims
I do not expect these data releases to have a major effect on the markets in their current state due to the risk appetite we've seen in both crypto and equities, such shallow pullbacks prove the demand is there to absorb and sell-side pressure for now.
Now is an excellent time to back strong projects with great fundamentals that are breaking out from downtrends/ranges in both their USD & BTC pairs, as BTC.D drops alts can print some great returns. Beta plays of ETH & SOL can offer higher returns than the majors themselves in these market conditions too.
Good luck this week everybody!
Live Setup for ES NY am session (14 July, 2025)MY bias: I expect price to make move lower at NY am session and target 6,259 price level.

XAU/USD Weekly Update — July 14, 2025⌛Timeframe:
.
📆 Date: July 14, 2025
.
🎯 Weekly Bias: Mildly Bullish — elevated risk, cautious momentum
🔎 Market Overview:
🛡️ Safe‑haven demand surging:
Renewed 30% tariffs on EU, Mexico, Canada have pushed investors into gold, lifting prices to a 3-week high.
📉 Weak USD & inflation hedge:
A softer U.S. dollar, under pressure from dovish Fed speculation, continues to support gold. A predicted September rate cut further boosts gold’s appeal.
🏦 Central bank accumulation:
Q1 2025 saw record demand from central banks (≈244 tonnes), with many reallocating reserves toward gold for geopolitical and de-dollarization reasons.
📈 YTD performance standout:
Gold is up ~27% this year, leading other assets. Bullish technical indicators like tightening Bollinger Bands and sustained MACD support continuation.
🌀 Market Sentiment:
🔽 Exchange reserves continue dropping:
Indicative of increased HODLing and lower upcoming sell pressure.
🧠 Sentiment firmly bullish:
Analysts highlight risk‑off bias; gold remains favored amid trade tensions.
🤝 ETF inflows & institutional buying:
Strong flows through gold ETFs and central bank buying reflect ongoing structural support.
🔧 Technical Analysis:
📊 Weekly Movement: +1.9% weekly gain, now at $3,367.
✅ Key Levels:
🔻 Resistance: $3,374 → $3,400
🔺 Support: $3,350 → $3,331
🟢 Signals: Mild bearish RSI divergence hints at short-term pause
🟢 Weekly Bias: Mildly Bullish — momentum favored, but caution amid technical divergence.
.
.
.
⚠️ Risk Reminder: For educational purposes only — not financial advice. Utilize prudent risk management.
👍 If this update helps, hit like, comment your view, and follow for timely XAUUSD alerts!

7/14: Sell High, Buy Low Within the 3400–3343 Range for GoldGood morning, everyone!
At the end of last week, renewed trade tariff concerns reignited risk-off sentiment, prompting a strong rally in gold after multiple tests of the 3321 support level. The breakout was largely driven by fundamental news momentum.
On the daily (1D) chart, the price has fully reclaimed the MA60 and broken above the MA20, signaling an emerging bullish trend. The key focus for this week includes:
Monitoring whether MA20 holds as support on any pullbacks
Watching the 3400 resistance zone for signs of exhaustion or continuation
From a 30-minute technical perspective, gold is currently trading within a short-term resistance band of 3372–3378, with a stronger resistance zone between 3387–3392. Key support levels are:
Primary support: around 3358
Secondary support: 3343–3332 zone
Given the recent increase in volatility due to geopolitical and macroeconomic headlines, flexible intraday trading is recommended within the 3378–3343 range, while broader trades can be framed around the 3400–3325 zone, still favoring a sell-high, buy-low approach.
Lastly, as we move into the mid-year period, I may have more personal commitments, and strategy updates could be less frequent. I appreciate your understanding, and as always, feel free to leave a message if you have any questions or need trading guidance—I’ll respond as soon as I can.
XAUUSD Golds Back To 3374Hello Traders! Quick read on Gold.. We are back down to the low of the day and looking for an upwards move for the rest of today and tomorrow.
A nice batch of demand that has not been tested yet and looking for the buyers to load back their positions.
Long Position
TP: 3374
1-2 Day Trade

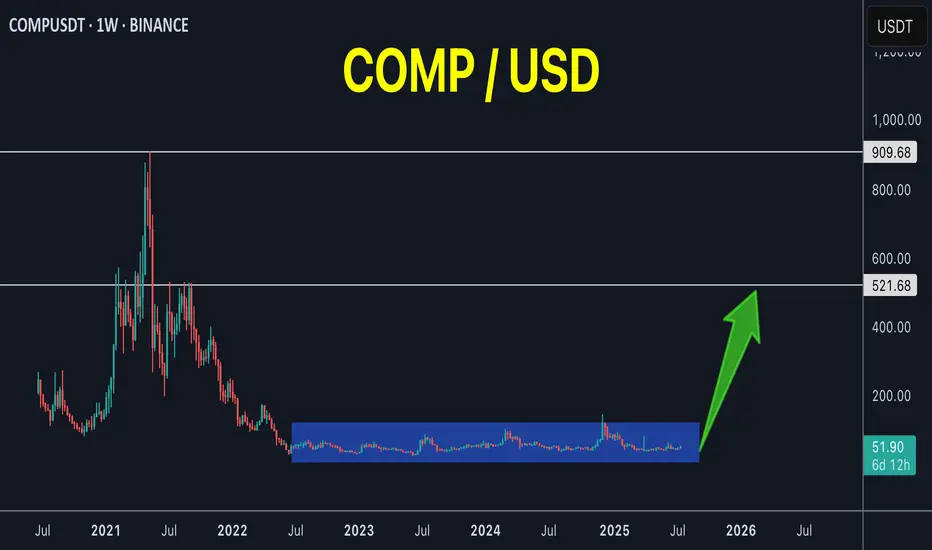
COMP 3 years of accumulation!COMP / USDT
3 years of accumulation and volume start to enter again
Just imagine if it breaks out from this long accumulation, the target will be very high but first we must breakout this accumulation box
Best of wishes