Long NSRGY on weekly time frameI like this company on a fundamental level. besides technical analysis. I think there will be a flood to dividend names soon if/when interest rates go down. bond yield should drop as well and investors want some passive income. Who better to go to then the company that owns the world lol. But on a serious note, this company is over a century old and has weathered many storms, I believe that this could be a bargain for long term investors as well. On the technical side, we have brok the down trend with a new high, I believe this pull back to previous resistance is healthy and needed for a stronger push to 110 and up. Also, check out the RSI, we have not seen a strong RSI on the weekly since 2021, where we had this same type pull back and then bounce up. Goodluck, I will be trading shares on this, SL with a break and hold under support, TP, no clue yet.
Fundamental Analysis

BITCOIN → Market manipulation. Chance for growth to 110KBINANCE:BTCUSDT , as part of a correction triggered by negative news from the US regarding tariffs, is testing liquidity in the support zone. There is a chance of recovery to 110K.
Bitcoin is reacting with a decline to fundamentally negative data on tariffs from Trump. Technically, the price is facing support and forming a false breakdown, the purpose of which was to capture liquidity. This could lead to a recovery within consolidation in an uptrend, but again, there are conditions...
Countries that have received notification of tariffs are responding positively to cooperation (if this trend continues, Bitcoin could receive a local bullish driver).
The market perceives this as positive, and after liquidity is captured, the price could recover to the resistance of the trading range.
Resistance levels: 108230, 109690
Support levels: 107500, 106500
Bulls are trying to hold the local interim bottom at 107500. There is a reaction to the false breakdown of support. The focus is on 108230; if the market can break through this level, we will have a chance to grow to 110K.
Best regards, R. Linda!

Long NKE on pull back after break?Nke just woke investors back up with their recent forecast after earnings. This push has temporarily broken the down trend on the daily time frame and it is holding the break on the weekly. We now have a healthy-looking retest with the rsi on the daily time frame above 50 signaling a bounce is coming. I mapped out some take profits. I am still a little worried about the company itself based on my own fundamental analysis. But physiologically i believe many people don't want to miss out on a brand name like Nike at such a discount, if it bounces here, I think it will be huge. Probably a short squeeze. I will not hold this trade up to next earnings though, as i said I don't really love the fundamentals. I think NKE is losing market share rapidly. Anyways sorry for the grammar but here are my thoughts, good luck. oh, and stop loss with a clear break and hold under this bounce spot, maybe 68-69?

XAUUSD Pre-FOMC SMC Setup This is a Smart Money Concept (SMC) based bullish setup on XAUUSD (Gold) ahead of the upcoming FOMC statement release. The idea builds on internal liquidity grabs, break of structures (BOS), and refined entry from a high-probability H1 bullish order block.
🧠 Price Action Narrative:
Price formed multiple Market Structure Shifts (MSS) and Breaks of Structure (BOS) following a mitigation of the higher H1 OB.
The final BOS to the upside was preceded by a sweep of short-term sell-side liquidity (marked as “$$$”), confirming bullish intent.
Price tapped into a refined H1 Order Block (OB) at ~3295.552, which also aligns with a previously unmitigated demand zone.
Clean reaction seen with strong bullish momentum pushing toward the next H1 Supply Zone (H1 SP).
🧩 Key SMC Zones:
H1 OB Entry Zone: ~3295.552
H1 SP Target Zone: 3318–3324
Invalidation Below: 3283.643 (OB low)
🕓 FOMC News Impact:
The FOMC statement in 15 minutes adds volatility potential. The bias remains bullish unless price invalidates the H1 OB. However, news-driven momentum could:
Accelerate the move into the H1 SP zone.
Induce a liquidity sweep before the actual push.
Temporarily fake out and then return to internal structure.
🎯 Trade Management Considerations:
Risk should be adjusted accordingly due to upcoming high-impact news.
Aggressive TP near the H1 SP.
Conservative traders may want to monitor how price reacts at MSS or internal resistance zones.

XAUUSD – Watching the 3318 Resistance for Potential Reversal
Currently monitoring Gold (XAUUSD) after a short-term bullish push toward the 3318 resistance zone. This area is significant due to:
Confluence with the upper Bollinger Band
Previous horizontal resistance level
Loss of momentum shown on MACD and other lower timeframes (15m–1h)
Price action is slowing as we approach the overbought territory. If price fails to break above 3318 and prints a clear reversal candlestick (e.g., pin bar or bearish engulfing) on the 1H chart, I’ll be looking for a short setup.
Disclaimer:This analysis reflects my personal view and is shared for educational purposes only. It does not constitute financial advice or a recommendation to enter any trade. Always do your own research and manage your risk accordingly. ⚠️
APA APA has been struggling financially for a while and has been trading in this downward channel just reaching the top border. Consistent rejections have been apparent especially as it approaches the 0.618 golden zone on our Fibonacci retracement.
Macro outlook there is a strong consensus that oil prices are going to see a decline continue for the rest of the year. The sheer supply of oil is already outstripping demand leading to storage of oil globally which is not only costly but has increased costs for companies. S/D analysts at goldman predict 4x in supply over the forthcoming year leading to lower oil prices.
APA will most likely struggle under these conditions, therefore im looking to sell

Alibaba (BABA) – Bearish Setup FormingNYSE:BABA
A descending triangle is forming on the chart, with strong resistance around $118 and horizontal support near $102. The structure suggests a potential breakdown, targeting a move of ~−9.8%.
Key observations:
• Price rejected from the descending trendline multiple times
• Stochastic turning down from the overbought zone
• RSI below 50 – room for further downside
• Bollinger Bands show compression, possibly preceding a breakout
📉 Business context:
Alibaba is facing ongoing challenges in its core business. Competition in the e-commerce and cloud sectors has intensified, import/export tariffs are putting pressure on margins, and regulatory oversight from Chinese authorities remains strict. These headwinds may weigh on investor sentiment and stock performance.
My short scenario:
If the price breaks below the $111–$110 zone with volume confirmation, I expect a move toward $102–$100.

Cable One | CABO | Long at $130.82Cable One NYSE:CABO is a leading broadband communications provider under the Sparklight brand, offering high-speed internet, cable TV, and phone services across 24 U.S. states.
Book Value: $315.50.
Positive:
Strong liquidity: Quick ratio 1.47 (above industry avg ~1.0).
Undervalued vs. industry (1.91x).
Large customer base: ~1.1M customers, 2.8M data subscribers.
Stable revenue: Broadband focus in non-metropolitan markets.
Insiders buying over $1 million in share recently while also being awarded options.
Recent change in leadership.
Negatives:
Medium-high bankruptcy risk: Altman Z-Score 1.36 (below industry ~2.5).
High leverage: D/E 1.78 (above industry ~1.0).
Weak earnings: Negative margins, declining profitability.
Suspended dividend.
Classify this one as a risky investment, but it is very undervalued at this price and the upcoming decline in interest rates may have a very positive effect on the company's stock (at least short-term: 5 million float, 19% short interest). Regardless, not one to put your life savings into. From a technical analysis perspective, I foresee a potential drop between $115 and $120 in the near-term and rise from there. It all depends on the upcoming earnings, so label this one a "gamble" with high bankruptcy risk.
Regardless of bottom predictions, NYSE:CABO is in a personal buy zone at $130.82 for a swing trade.
Targets into 2027:
$190.00 (+45.2%)
$250.00 (+91.1%)

China's PPI slides, Australian dollar steadyThe Australian dollar is almost unchanged on Wednesday. In the European session, AUD/USD is trading at 0.6532, up 0.03% on the day.
China's producer price index surprised on the downside in June, with a steep 3.6% y/y decline. TThe soft PPI report was driven by weak domestic demand and the continuing uncertainty over US tariffs. The lack of consumer demand was reflected in the weak CPI reading of 0.1% y /y, the first gain in four months. Monthly, CPI declined by 0.1%, following a 0.2% drop in May. There was a silver lining as core CPI rose 0.7% y/y, the fastest pace in 14 months.
The uncertainty over US President Trump's tariff policy continues to perplex the financial markets. Trump had promised a new round of tariffs against a host of countries on July 9 but he has delayed that deadline until August 1.
China, the world's second-largest economy after the US, has taken a hit from US tariffs, as China's exports to the US are down 9.7% this year, However, China has mitigated much of the damage as China's exports to the rest of the world are up 6%. There is a trade truce in effect between the two countries but the bruising trade war will continue to dampen US-China trade.
With no tier-1 events out of the US today, the FOMC minutes of the June meeting will be on center stage. The Fed held rates at that meeting and Fed Chair Powell, who has taken a lot of heat from Donald Trump to cut rates, defended his wait-and-see-attitude, citing the uncertainty that Trump's tariffs are having on US growth and inflation forecasts.his was below the May decline of 3.3% and the consensus of -3.2%. China has posted producer deflation for 33 successive months and the June figure marked the steepest slide since July 2023. Monthly, PPI declined by 0.4%, unchanged over the past three months.

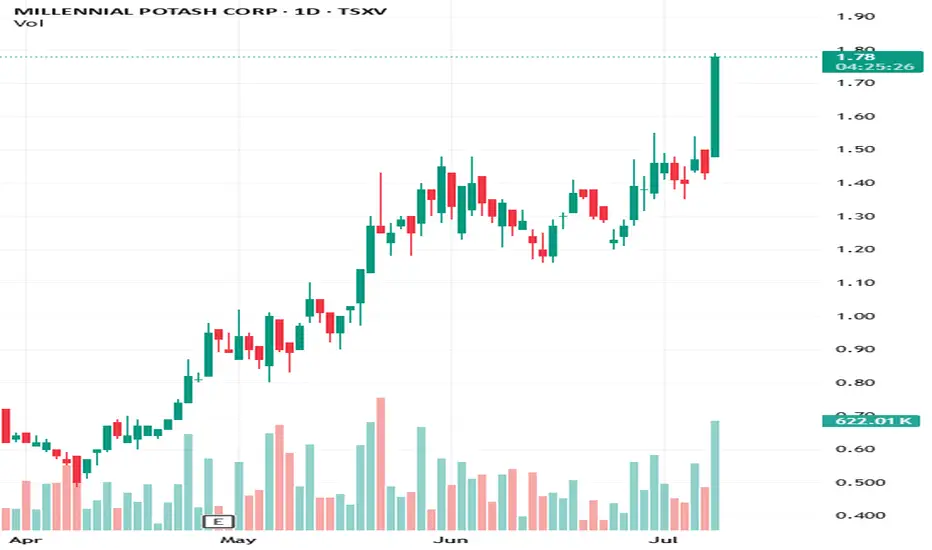
U.S. DFC Invests in $TSXV:MLP Banio Project Millennial Potash Corp. ( TSXV:MLP | OTC:MLPNF ) just announced a major development: the U.S. International Development Finance Corporation (DFC) has committed up to US$3M in project development funding for the Banio Potash Project in Gabon.
This strategic funding supports the upcoming Feasibility Study and was signed in Washington D.C. with the President of Gabon in attendance — a major signal of international and governmental backing.
Why this matters:
Potash = food security. Fertilizer is essential for crop yields, and potash demand in Africa is rising fast.
DFC backing helps derisk the Banio project and positions MLP for future development financing.
The investment arrives as Millennial moves from exploration to development — with second-stage drilling nearing completion.
Gabon's support + U.S. government endorsement puts MLP in a strong geopolitical position for long-term growth.
Follow for updates as the feasibility study unfolds and MLP potentially emerges as a cornerstone player in Africa’s potash supply chain.
7/7/25 - $ses - Still my fav R/R in battery7/7/25 :: VROCKSTAR :: NYSE:SES
Still my fav R/R in battery
- revenue is scaling
- 1Q revenue tripled 4Q last year
- mgmt's speech on last call was "15-25 mm" for 2025
- their software platform is ramping across core (EV/auto) OEMs and basically anyone (tier 1 battery co's)
- if you look at their PnL R&D is 20 mm. that's what they're burning, really. and they will end year w $200 mm in cash
- so when you consider this thing is $100 mm enterprise value...
- revenue is ramping and they're finding PMF and probably one of the most specialized/ interesting tools on mkt for AI-based battery-chemistry discovery
- this thing is dirt chip
- "yes" the sub $1 ticker risks nasdaq compliance
- "yes" lately this has meant reverse split and no-bueno-stock-px-reaction
- but i'd posit here, that any reverse split wouldn't see that death spiral back to $1 mainly b/c of the big cash component, scaling revenue and most co's that do it... do it out of obligation... and their revenue/ cash burn are going the wrong way (this is the oppose)
- while i had to dump NASDAQ:EOSE after digging in
- I come back to these guys as perhaps the more interesting software-capital-light-starting-to-reach-inflection-cash-heavy-balance-sheet plays out there for less than a small fries at MCD
what do you think?
V

Gold Market Mitigates 3280 – Eyes on 3330 PullbackAfter sustaining its bearish sentiment, the gold market mitigates the 3280 zone, creating room for a potential pullback to 3330. Current price action suggests a shift in structure could be forming, anticipating a bullish correction in the short term.follow for more insights , comment and boost idea

Retail trapped. Volume confirmed. Liquidity targeted.🔻 We are in a highly reactive zone where emotional long entries and early short SLs create perfect liquidity magnets.
🔍 Key Levels & Zones:
• Early Short SL Zone → 3337.2
• Retail FOMO Entry Block → 3251.9
• Volume-based Rejection Point → 3392.0 (SL/TP sweep)
• TP1 & TP2 Zones → 3251.9 / 3208.0
• Bonus TP → 3159.9 → Complete sweep of long SLs and demand exhaustion
• Final Trap Exit Zone → 3157.4 — Institutional reload zone
💡 Volume confirms this cycle of:
• Trap > SL hunt > Emotional entry > Volume fade > Dump > Accumulation > Reversal
🧠 This is NOT financial advice. I post to share deeper insight into manipulation mechanics & sniper-level liquidity structure analysis.
If you’re still trading candles, you’re playing retail games. Start seeing the architecture.
🧷#XAUUSD #SmartMoney #LiquiditySweep #VolumeStrategy #TradingPsychology #RetailTrap #SniperMindset

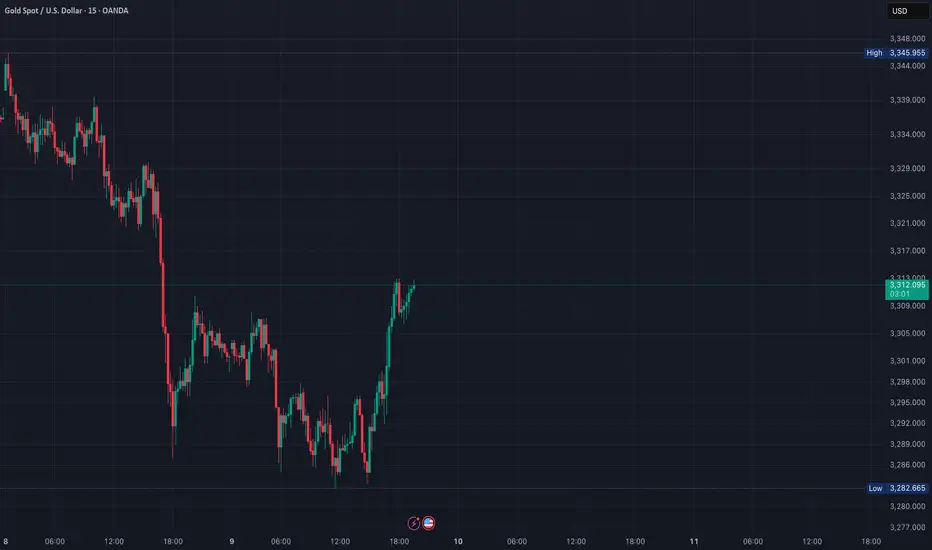
Gold’s Bullish Range Holds – Is This the Dip to Buy?With tensions easing in the Middle East and risk appetite moderating, gold has settled into a bullish daily range. The metal recently broke a key high, confirming its upward momentum, but now appears to be consolidating. The central question is whether gold will break lower for a deeper correction or whether this is merely a pause before the next leg higher.
Reduced geopolitical risk has tempered the “risk-on” rally in gold, but the metal remains firmly within a bullish daily range. This indicates that the underlying bid has not disappeared—only short-term speculative flows have adjusted.
Gold recently breached a protected high—likely a higher high or significant resistance level—reinforcing the prevailing bullish momentum. A pullback into imbalance or demand zones is anticipated; however, if a catalyst emerges, price could resume its advance from current levels, with the 0.328 Fibonacci retracement acting as a strong support.
Meanwhile, the DXY is exhibiting signs of a pullback but lacks the fundamental drivers necessary to sustain a broader rally.

Expecting Gold bullish Movement The chart illustrates a potential bullish reversal setup for Gold XAU/USD on the 15-minute timeframe Price action has recently tested and respected a key demand zone marked as the Kee point around the 32853 level This area acted as strong support with multiple rejections suggesting buyer interest
Following this, the price has started forming higher lows and higher highs indicating the beginning of a bullish structure The large blue arrow suggests bullish momentum is expected to continue, aiming for upside targets
Key Levels
Kee Point Support Zone 3285 Crucial area where the reversal initiated
Target 1: 3316 First resistance level and a potential take-profit zone
Target 2: 3330 Final bullish target if momentum sustains
Outlook
As long as the price holds above the Kee Point, bullish continuation is favored
Breaking and closing above Target 1 could lead to further gains toward Target 2
A break below the Kee Point would invalidate this bullish scenario
This setup presents a potential buying opportunity with defined upside targets contingent on sustained bullish pressure

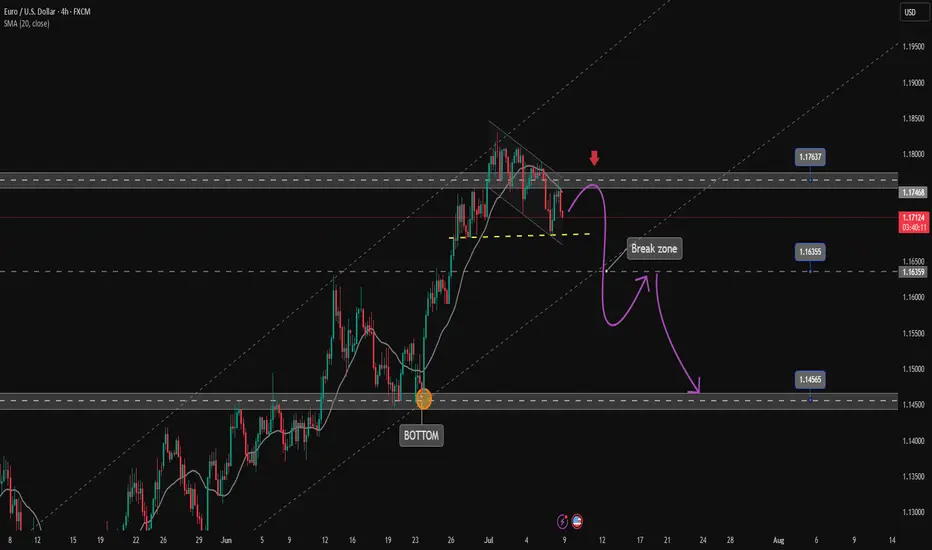
Confirming EURUSD corrective downtrend✏️EURUSD is trading in a downtrend channel. SELL signal is triggered at the current price around 1.172 as the H4 candle failed to break 1.176 and confirmed the Sellers' entry into the market clearly. Target for the downtrend is at 1.145, the Sellers' strength needs to overcome the Break out zone of 1.163 first.
📈 Key level
Support 1.163-1.146
Resistance 1.176
SELL DCA Trigger: Break 1.163
BUY Trigger: The price trades about 1.163.
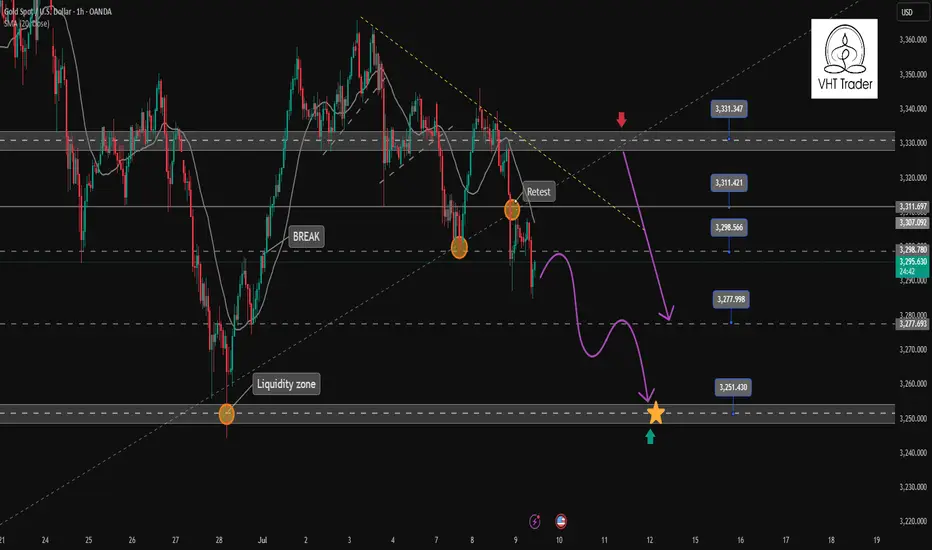
Gold continues downtrend today✏️#GOLD view
Yesterday's D1 candle confirmed the decline in gold prices when the selling pressure returned below the liquidity candle wick. The extension of the downtrend will continue today.
Yesterday's strong support zone 3297 has become today's resistance zone, this is the SELL point today when there is confirmation from the selling side in this zone.
3310 The confluence resistance zone between the trendline and the US Session Resistance is noted in today's SELL strategy. The previous SELL Target 3352 orders pay attention to the reaction at 3377.
📈Key Level
SUPPORT 3277-3250
RESISTANCE 3297-3310-3328
SELL Trigger: Price cannot break 3297
SELL DCA Trigger: Break 3276
Target: 3250
BUY Trigger:PriceTrading above 3276
Leave your comments on the idea. I am happy to read your views.
Where Can Bitcoin Go? Part 8 –(MASSIVE 'Resistance or Breakout')🚀📊 Where Can Bitcoin Go? Part 8 – The Final Test is Near! 🔥🔍
Welcome to Part 8 of “Where Can Bitcoin Go?” – the update of this long-running series. Since mid-2023, not much has changed in the structure. That’s the power of solid technical analysis – levels don’t lie.
🟨 The Setup
Bitcoin is now approaching a third test of a major structural resistance. If you’ve followed my 1-2-3 strategy, you know this is where decisions are made:
✅ Test 1: Rejection
✅ Test 2: Rejection
⏳ Test 3: Now pending… the TERMINAL and DECISIVE 'Breakout or Rejection', and this will change everything.
But here’s the deeper layer:
We’re not just testing one sequence. We now have two separate sets of 1-2 rejections —
🔹 One set from 2021 (the Red 1 and 2)
🔹 And a recent one in 2025 (the white 1 and 2)
This upcoming test is the third rejection attempt on both timeframes, making it a rare and extremely significant technical moment.
📐 Price is now near a critical ascending trendline around $115K–$116K, which has been the gatekeeper to parabolic moves in previous cycles.
🔄 Based on historical halving cycles:
548 days post-halving in 2016 → ATH 2017
565 days post-halving in 2020 → ATH 2021
Halving #4 was in April 2024 → 👀 Could this point to a new ATH by end of 2025?
📊 Probabilities
🔹 83% chance we see the third test before year-end
🔹 57% chance of breakout
🔻 43% chance of rejection
⚠️ And here’s the reality check:
If we see that breakout — the market unleashes itself. We’re talking major pumps, potential follow-through moves, and price discovery into untouched zones like $188K, $197K, and beyond.
But... if we get rejected, it won’t be pretty. We could retest major levels like $66K or worse, and lose momentum that took years to build.
And unfortunately — this isn’t like 18K, or 40K, or even the 79K retest.
Things are much more complicated now.
The sentiment, the structure, the risk profile — they’ve all evolved. We cannot afford to have the same blind bullishness we had in those earlier phases. This is a mature part of the cycle, and it demands discipline over emotion.
💬 What’s your take?
Will Bitcoin finally break through?
Is this just another fakeout in disguise?
Are you feeling this same tension in the market?
Let’s talk structure. Let’s talk price. Let’s talk reality.
One Love,
The FXPROFESSOR 💙
Disclosure: I am happy to be part of the Trade Nation's Influencer program and receive a monthly fee for using their TradingView charts in my analysis. Awesome broker, where the trader really comes first! 🌟🤝📈

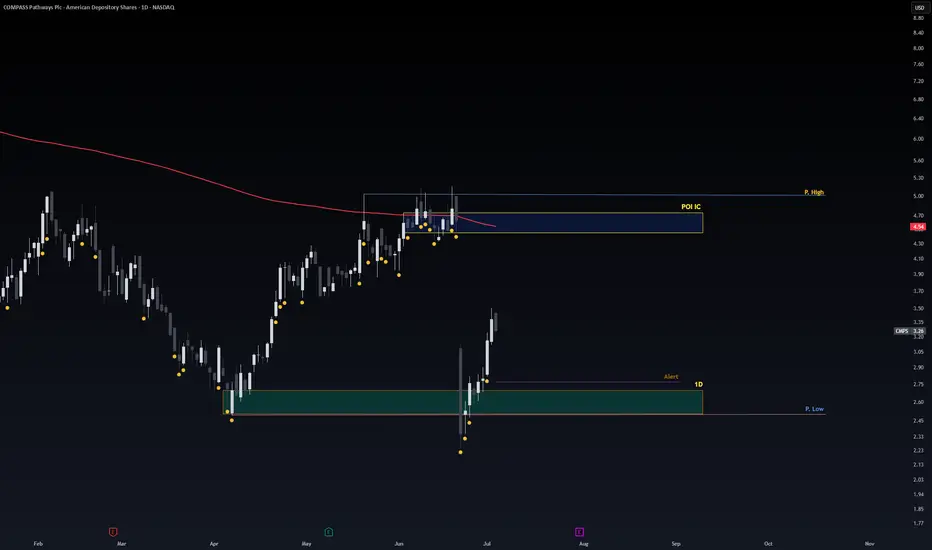
Safe Entry Zone CMPSStock Recovering from steep drop from bad news (which we don't care).
Blue Zone is Sell Zone.
Green Zone is Buy Zone.
since stock already rallied. its Risky to follow we wait price to re-test Green Zone.
Also My Beloved CAthie Wood BEST INVESTOR All Time (based on statics better than Warren Buffet Entire Histroy) Is BUYING!
Note: 1- Potentional of Strong Buying Zone:
We have two scenarios must happen at The Mentioned Zone:
Scenarios One: strong buying volume with reversal Candle.
Scenarios Two: Fake Break-Out of The Buying Zone.
Both indicate buyers stepping in strongly. NEVER Join in unless one showed up.
2- How to Buy Stock:
On 1H TF when Marubozu/Doji Candle show up which indicate strong buyers stepping-in.
Buy on 0.5 Fibo Level of the Marubozu/Doji Candle, because price will always and always re-test the
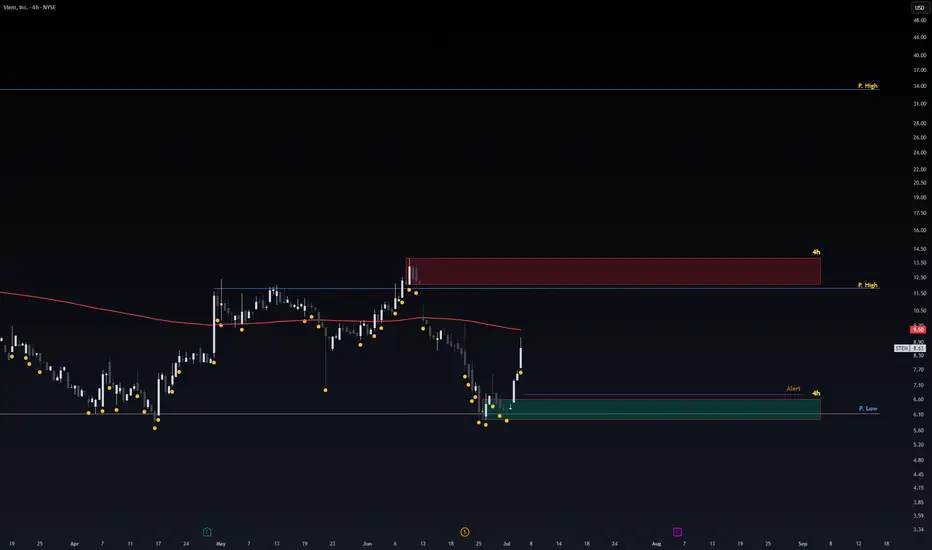
Safe Entry STEMPrice movement consolidating.
Safe Entry Green Zone.
Red Zone is Sell Zone. better watch out for any selling pressure.
P.high Lines Are Good Resitances.
Final Target 33.45$ price level.
better to wait stock and not follow.
Note: 1- Potentional of Strong Buying Zone:
We have two scenarios must happen at The Mentioned Zone:
Scenarios One: strong buying volume with reversal Candle.
Scenarios Two: Fake Break-Out of The Buying Zone.
Both indicate buyers stepping in strongly. NEVER Join in unless one showed up.
2- How to Buy Stock:
On 1H TF when Marubozu/Doji Candle show up which indicate strong buyers stepping-in.
Buy on 0.5 Fibo Level of the Marubozu/Doji Candle, because price will always and always re-test the
Safe Entry CNSNote: Lower TF to 1h or 4h to see better details.
Recently Trump lift chips design prohibition to be sent to china. (Positive to CDNS)
Stock Obvious and clearly at major resistance with such news it expected to open Gap Up.
following the stock would be mistake unless stock open in pre-market with price level similar to close.
better to wait stock to open gap up. Re-test the major resistance.
that would be major support level and safe entry for price to go higher.
Note: 1- Potentional of Strong Buying Zone:
We have two scenarios must happen at The Mentioned Zone:
Scenarios One: strong buying volume with reversal Candle.
Scenarios Two: Fake Break-Out of The Buying Zone.
Both indicate buyers stepping in strongly. NEVER Join in unless one showed up.
2- How to Buy Stock:
On 1H TF when Marubozu/Doji Candle show up which indicate strong buyers stepping-in.
Buy on 0.5 Fibo Level of the Marubozu/Doji Candle, because price will always and always re-test the

Safe Entry OracleStock In Up-Movement.
P.High (Previous High) is Safe Entry.
Note: 1- Potentional of Strong Buying Zone:
We have two scenarios must happen at The Mentioned Zone:
Scenarios One: strong buying volume with reversal Candle.
Scenarios Two: Fake Break-Out of The Buying Zone.
Both indicate buyers stepping in strongly. NEVER Join in unless one showed up.
2- How to Buy Stock (safe way):
On 1H TF when Marubozu/Doji Candle show up which indicate strong buyers stepping-in.
Buy on 0.5 Fibo Level of the Marubozu/Doji Candle, because price will always and always re-test the

Safe Entry Zone CHWYCurrently stock in Ranging Movement.
1h Green Zone is buying Zone.
1h Red Zone is selling Zone.
Price ranging with strong potional of Strong Up-Movement.
Note: 1- Potentional of Strong Buying Zone:
We have two scenarios must happen at The Mentioned Zone:
Scenarios One: strong buying volume with reversal Candle.
Scenarios Two: Fake Break-Out of The Buying Zone.
Both indicate buyers stepping in strongly. NEVER Join in unless one showed up.
2- How to Buy Stock:
On 1H TF when Marubozu/PinBar Candle show up which indicate strong buyers stepping-in.
Buy on 0.5 Fibo Level of the Marubozu Candle, because price will always and always re-test the imbalance.
