Bitcoin Skyrockets as Everyone Now Wants a Piece. What Happened?If you took a few days off last week and went to get coffee this morning, you likely missed Bitcoin torching its all-time high and soaring into the uncharted.
The world’s most popular digital asset took off in an unstoppable rocket ride, smashing records so fast that even the always-wired-in day traders couldn’t keep up.
Bitcoin BITSTAMP:BTCUSD blasted through $122,000 Monday morning after gobbling up sell walls at $120,000 and $121,000 in less than one hour. That’s not a typo.
That’s an actual snapshot of what happens when you mix onchain whale movements, fresh institutional FOMO, and traders rediscovering their appetite for risk. Billions upon billions swirled up and Bitcoin passed $2.3 trillion in market cap (ref: our Crypto Heatmap ).
🙌 Bow Down Before the King
Bitcoin has officially reminded every altcoin who wears the crown when markets go haywire. While some tiny tokens get to pump 100% on hype alone, Bitcoin does it with the weight of its market cap behind it — which now surpasses the GDP of entire countries.
Its dominance share has climbed back above 64%, a level we haven’t seen since the last time crypto Twitter argued whether “flippening” would happen by next Thursday (spoiler: it didn’t, and we mean 2021). And right now, all eyes are pinned on that round, meme-ready milestone: $125,000 or even $150,000.
Why these levels? Because traders love round numbers. They’re clean, symbolic, and if that next ceiling shatters, the chain reaction of liquidated shorts and new leveraged longs can turn an orderly bull run into pure market mayhem.
📈 Institutional Hoarding: The Secret Fuel
If you think this is just retail traders YOLO’ing in from their parents’ basement, think again. Onchain data showed earlier this month that this moon mission was being quietly underwritten by the big boys — institutional funds, overflowing Bitcoin ETFs , and corporate treasuries that once scoffed at Bitcoin as “magic internet money.”
Does this mean Bitcoin is becoming boring? Not quite. It means the foundation for this rally is sturdier than the TikTok-fueled moonshots of yesteryear. Think steady inflows, regulated vehicles, and balance sheets that no longer flinch when they see “digital assets” on a line item.
👀 So, Why Now?
Bitcoin doesn’t need much of a reason to get volatile — you know that. But a few more stars than usual aligned to give this surge its lift-off moment.
First, the macro backdrop: US inflation is at 2.4% (next ECONOMICS:USCPI report coming Wednesday, pay attention to the Economic Calendar ), which makes a Fed rate cut more likely later this year.
Lower rates mean cheaper dollars, weaker bond yields, and renewed appetite for risk assets. Oh, and don’t forget about gold OANDA:XAUUSD — the OG “no yield, no problem” hedge.
Second, corporate treasuries are all-in on Bitcoin again. If Michael Saylor’s Strategy NASDAQ:MSTR (formerly MicroStrategy — we all know what business they’re really in) keeps adding coins and onboarding new public companies like GameStop NYSE:GME , you know the institutions smell long-term value. Add Trump’s full-throated crypto endorsement and you’ve got a narrative tailwind no trader wants to miss.
🥂 Record Highs Everywhere — COINcidence?
Now let’s go back to those aligning stars. Bitcoin’s fresh all-time high didn’t happen in a vacuum. The S&P 500 SP:SPX , the Nasdaq Composite NASDAQ:IXIC , and Nvidia NASDAQ:NVDA — the world’s most expensive company — all clocked record closing highs last week.
So, is this a “rising tide lifts all boats” moment? Or are we partying on borrowed time? Equities are riding a wave of hope that the Fed will start easing soon, and any whiff of a rate cut is pure oxygen for risk assets.
But seasoned traders know that record highs can sometimes be the most dangerous places to FOMO in. Ask anyone who went all-in on dot-com stocks in 1999.
🏹 Eyes on the Big 120K — Will It Hold the Line?
Short-term, the $120,000 milestone is the line in the sand everyone’s watching. Break it decisively, see if it holds above it for a week or so, and the floodgates of speculative capital might open for another leg higher. Stall out below it? You could see a healthy round of profit-taking and some bruised egos during quiet dinners.
Macro factors will loom large: the Fed’s policy meeting, surprise tariff talks from the White House, or an unexpected bout of inflation could swing sentiment overnight. But for now, the mood is simple: bullish, frothy, and more than a little bit greedy.
💭 Final Take: From Moonshots to Maturity?
The shift from whales to suits means fewer wild swings but steadier institutional demand. The days of “Lambo tomorrow” might be giving way to “slow grind higher for the next 5 years.” For the retirement portfolio, that’s not the worst outcome.
For the traders who crave the adrenaline, there’s still plenty of room to catch the waves — just don’t expect them to come as easily or as frequently as they did in the wild west days.
📢 Your Turn: Moon or Swoon?
Over to you: is Bitcoin ready to break out above $125,000 and send shorts scrambling for cover? Or is this just another overbought stall before a healthy pullback?
Either way, grab your popcorn — and your stop-loss — because if there’s one thing crypto never does, it’s sit still for long. Drop your hot take below — and may your diamond hands be stronger than your coffee.
Fundamental Analysis

WTI Crude Oil Climbs Higher Amid Market OptimismMarket Analysis: WTI Crude Oil Climbs Higher Amid Market Optimism
WTI Crude Oil price climbed higher above $66.50 and might extend gains.
Important Takeaways for WTI Crude Oil Price Analysis Today
- WTI Crude Oil price started a decent increase above the $66.60 resistance levels.
- There was a break above a connecting bearish trend line with resistance at $67.15 on the hourly chart of XTI/USD at FXOpen.
Oil Price Technical Analysis
On the hourly chart of WTI Crude Oil at FXOpen, the price started a decent upward move from $65.50. The price gained bullish momentum after it broke the $66.50 resistance and the 50-hour simple moving average.
The bulls pushed the price above the $67.00 and $67.50 resistance levels. There was a break above a connecting bearish trend line with resistance at $67.15.
The recent high was formed at $67.63 and the price started a downside correction. There was a minor move toward the 23.6% Fib retracement level of the upward move from the $65.54 swing low to the $67.63 high.
The RSI is now above the 60 level. Immediate support on the downside is near the $67.15 zone. The next major support on the WTI Crude Oil chart is near the $66.60 zone or the 50% Fib retracement level, below which the price could test the $65.50 level. If there is a downside break, the price might decline toward $64.70. Any more losses may perhaps open the doors for a move toward the $63.50 support zone.
If the price climbs higher again, it could face resistance near $67.85. The next major resistance is near the $70.00 level. Any more gains might send the price toward the $72.50 level.
This article represents the opinion of the Companies operating under the FXOpen brand only. It is not to be construed as an offer, solicitation, or recommendation with respect to products and services provided by the Companies operating under the FXOpen brand, nor is it to be considered financial advice.

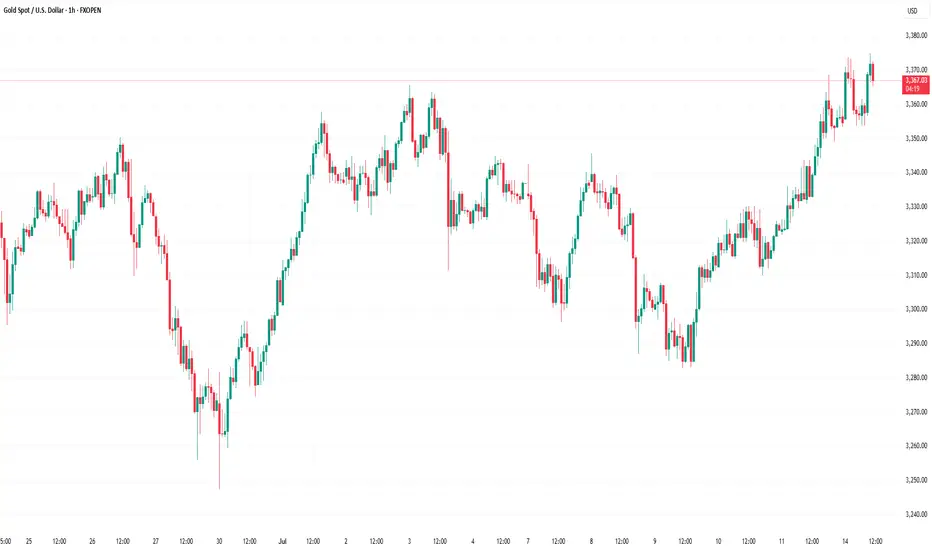
Market Analysis: Gold Climbs Higher Amid Market OptimismMarket Analysis: Gold Climbs Higher Amid Market Optimism
Gold price started a fresh increase above the $3,350 resistance level.
Important Takeaways for Gold Price Analysis Today
- The gold price started a fresh surge and traded above $3,330.
- A key bullish trend line is forming with support at $3,350 on the hourly chart of gold at FXOpen.
Gold Price Technical Analysis
On the hourly chart of Gold at FXOpen, the price formed a base near the $3,280 zone. The price started a steady increase above the $3,330 and $3,350 resistance levels.
There was a decent move above the 50-hour simple moving average and $3,360. The bulls pushed the price above the $3,365 resistance zone. A high was formed near $3,373 and the price is now consolidating.
On the downside, immediate support is near the $3,350 level and the 23.6% Fib retracement level of the upward move from the $3,282 swing low to the $3,373 high.
Besides, there is a key bullish trend line forming with support at $3,350. The next major support sits at $3,330 and the 50% Fib retracement level.
A downside break below the $3,330 support might send the price toward $3,300. Any more losses might send the price toward the $3,280 support zone.
Immediate resistance is near the $3,370 level. The next major resistance is near $3,380. An upside break above $3,380 could send Gold price toward $3,400. Any more gains may perhaps set the pace for an increase toward the $3,420 level.
This article represents the opinion of the Companies operating under the FXOpen brand only. It is not to be construed as an offer, solicitation, or recommendation with respect to products and services provided by the Companies operating under the FXOpen brand, nor is it to be considered financial advice.
NASDAQ - Long Bias explanation and Entry/SL/TP ideasTrend : NASDAQ is in a strong uptrend at the moment
Retail : Majority have a BEARISH sentiment on this pair
Institutions : Increase in week over week holdings
Structures : No structures as we are at highs so targeting recent formed high + round number above makes sense
Price action : Sitting on a support shelf at the moment
Targets : Recent high + level at round number (23000)
Stops : Many options to place stops below
Entries : Positive bounce at current level, decent entry zone but further possible entry levels sit below too
If trading on a shorter timeframe, perhaps the gap fill is a good point to take the trade off the table.
Targeting higher than 23 might be dangerous as we are playing around at ATHs

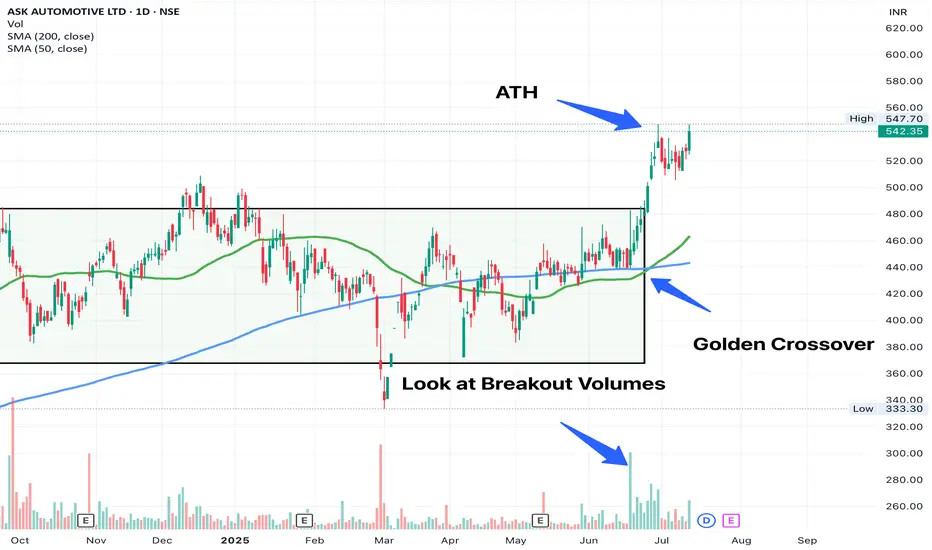
ASKAUTOLTD - Strong Technicals + Strong Fundamentals Should be a long term play, looks strong from the medium term. Beautiful Chart. MCap less than 10K Cr, poised for growth, strong fundamentals, strong technicals.
How to build Positions - Gradual scale in is your answer. Do not put in money blindly at open, good thinks take time to build and so should your portfolio.
SL - 480 (roughly 11% away, slow accumulation should help get your average price less than 7% away from this SL)
Soybeans and Rain: Moisture’s Market Impact on the Bean Trade1. Introduction: Moisture & Market Momentum
Soybeans, often referred to as “the oilseed king,” are a cornerstone of global agriculture. As a leading source of protein for both humans and animals, their price fluctuations affect industries ranging from food production to biofuels. One key variable traders often monitor? Rainfall. 🌧️
Moisture plays a critical role in soybean development, influencing yield and quality from the moment the seed is sown. It’s no surprise that many market participants assume a strong correlation between rainfall and price behavior. But is that assumption truly supported by data?
In this article, we analyze how varying precipitation levels impact weekly soybean futures returns. As you'll see, the results might not be as clear-cut as you’d expect—but they still offer meaningful insights.
2. Biological Realities: Soybeans’ Water Needs
Soybeans thrive under specific conditions. While they’re generally resilient, rainfall—or the lack thereof—can tip the balance between bumper harvests and disappointing yields.
During early vegetative stages, sufficient moisture ensures healthy root development. Later, during the pod-fill phase, rainfall becomes even more essential. Too little water at this point leads to incomplete pods or aborted seeds. On the flip side, too much rain can invite fungal diseases and delay harvests, especially in lower-lying regions.
In countries like Brazil and Argentina, soybean fields often face seasonal extremes, while the U.S. Midwest typically enjoys more consistent conditions—though droughts and floods have both hit the Corn Belt in recent years. These environmental realities create natural volatility in both yield and pricing expectations.
3. Methodology: How We Analyzed Weather vs. Futures
To explore the potential connection between rainfall and soybean futures prices, we collected weekly weather data for major soybean-growing cities across the globe. Each week’s precipitation was categorized using a normalized percentile system:
Low Rainfall: below the 25th percentile
Normal Rainfall: between the 25th and 75th percentiles
High Rainfall: above the 75th percentile
We then matched this data against weekly returns of standard soybean futures (ZS) and micro soybean futures (MZS), both traded on the CME Group.
This allowed us to compare average price behavior in different rainfall scenarios—and test whether there was any statistically significant difference between dry and wet weeks.
4. Statistical Findings: Is There a Signal in the Noise?
When examining the data, the initial visual impression from boxplots was underwhelming—return distributions across rainfall categories looked surprisingly similar. However, a deeper dive showed that the difference in mean returns between low and high precipitation weeks was statistically significant, with a p-value around 0.0013.
What does that mean for traders? While the signal may not be obvious to the naked eye, statistically, rainfall extremes do impact market behavior. However, the magnitude of impact remains modest—enough to be part of your strategy but not enough to drive decisions in isolation.
Soybean prices appear to be influenced by a mosaic of factors, with precipitation being just one tile in that complex picture.
5. Charting the Relationship: Visual Evidence
While statistical tests gave us the green light on significance, we know traders love to “see” the story too. Boxplots of weekly soybean futures returns segmented by rainfall categories offered a subtle narrative:
Low-precipitation weeks showed slightly higher average returns and tighter interquartile ranges.
High-precipitation weeks had broader return distributions and more frequent downside outliers.
Normal weeks exhibited relatively stable behavior, reinforcing the idea that the market reacts most during extremes.
This kind of visualization may not scream alpha at first glance, but it reinforces the idea that precipitation events—particularly dry spells—tend to nudge prices upward, possibly as market participants price in production risk.
6. Trading Implications: Positioning Around Weather
Here’s where things get practical. While weather alone won’t dictate every trading decision, it can be a key filter in a broader strategy. For soybean traders, rainfall data can help inform:
Bias assessment: Low-precipitation weeks may suggest bullish tendencies.
Risk control: Expect wider return distributions in high-precip weeks—adjust stops or contract sizing accordingly.
Event trading: Pair weather anomalies with technical signals like trendline breaks or volume surges for potential setups.
It’s also worth noting that weekly weather forecasts from reputable sources can serve as a forward-looking indicator, giving traders a head start before the market fully reacts.
7. Margin Efficiency with Micro Soybeans
For traders looking to scale into soybean exposure without the capital intensity of full contracts, the CME Group’s micro-sized futures offer a compelling alternative.
📌 Contract Specs for Soybean Futures (ZS):
Symbol: ZS
Contract size: 5,000 bushels
Tick size: 1/4 of one cent (0.0025) per bushel = $12.50
Initial margin: ~$2,100 (varies by broker and volatility)
📌 Micro Soybean Futures (MZS):
Symbol: MZS
Contract size: 500 bushels
Tick size: 0.0050 per bushel = $2.50
Initial margin: ~$210
These smaller contracts are perfect for strategy testing, risk scaling, or layering exposure around key macro events like WASDE reports or weather disruptions. For traders aiming to build weather-aligned positions, MZS is a powerful tool to balance conviction with capital efficiency.
8. Wrapping It All Together
Rain matters. Not just in fields, but in futures prices too. While soybean markets may not overreact to every drizzle or downpour, extreme rainfall conditions—especially drought—can leave noticeable footprints on price action.
For traders, this means opportunity. By incorporating precipitation metrics into your workflow, you unlock a new layer of context. One that doesn’t replace technical or fundamental analysis, but enhances both.
And remember: this article is just one piece of a larger exploration into how weather affects the commodity markets. Make sure you also read prior installments.
When charting futures, the data provided could be delayed. Traders working with the ticker symbols discussed in this idea may prefer to use CME Group real-time data plan on TradingView: www.tradingview.com - This consideration is particularly important for shorter-term traders, whereas it may be less critical for those focused on longer-term trading strategies.
General Disclaimer:
The trade ideas presented herein are solely for illustrative purposes forming a part of a case study intended to demonstrate key principles in risk management within the context of the specific market scenarios discussed. These ideas are not to be interpreted as investment recommendations or financial advice. They do not endorse or promote any specific trading strategies, financial products, or services. The information provided is based on data believed to be reliable; however, its accuracy or completeness cannot be guaranteed. Trading in financial markets involves risks, including the potential loss of principal. Each individual should conduct their own research and consult with professional financial advisors before making any investment decisions. The author or publisher of this content bears no responsibility for any actions taken based on the information provided or for any resultant financial or other losses.

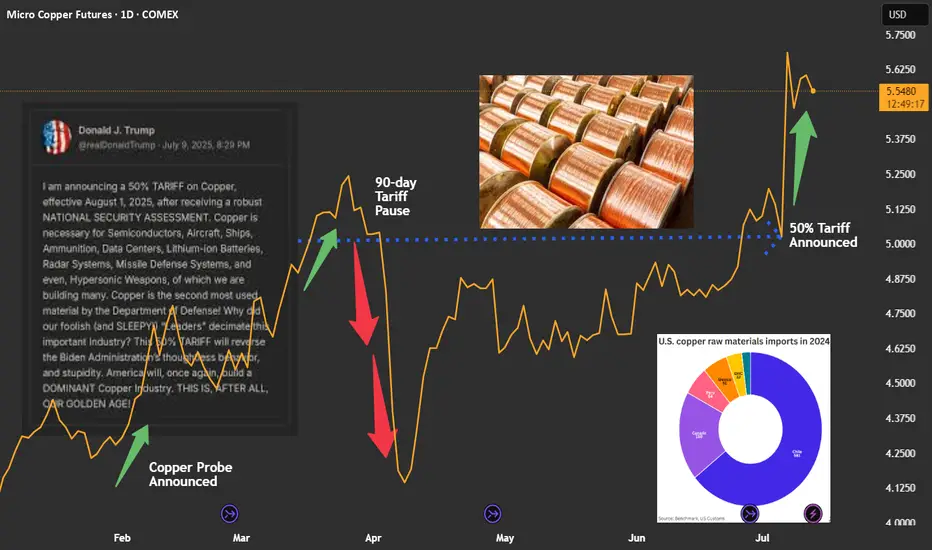
Copper: Event-driven Trade Idea on Recent TariffsCOMEX: Micro Copper Futures ( COMEX_MINI:MHG1! ), #microfutures
The Event
On July 9th, President Trump announced that he would impose a 50% tariff on imports of copper, effective August 1st.
The decision was based on national security assessment. Copper is the second most used material by the U.S. Department of Defense. The President intents to use tariffs to reduce reliance on imports and shore up support for domestic production.
Immediate Market Reaction
U.S. copper prices ended Tuesday’s session over 13% higher — the sharpest single-day gain since 1989. The September COMEX copper futures contract was settled at $5.584 a pound on Friday, up 35.7% year-to-date.
Due to tariffs, Copper in the U.S. is priced at a large premium over international markets.
• UK: LME copper contract was quoted at $9,660.5 per ton on Friday.
• China: SHFE coper futures was settled at RMB 78,420 per ton. It can be converted to $10,959.4 via the Dollar/RMB exchange rate of 7.1555.
• US: COMEX copper quote of $5.584 can be converted to $12,312.7 per ton.
• As of Friday, COMEX copper is priced at a 27.5% premium over LME copper, and a 12.3% premium over SHFE copper.
The U.S. Copper Market
The U.S. Geological Survey reports that the 2024 total refined copper consumption was 1.8 million metric tons. Of which, 850,000 tons were from mining, 150,000 tons were refined from scrap, and 810,000 tons from imports.
Chile is the biggest source of U.S. copper imports, accounting for 581,000 tons, or 71.7% of total imports. Canada is the second largest, for 169,000 tons, or 20.9%.
Copper is a widely used base metal, found in products ranging from machinery, electronics, household goods, housing, infrastructure projects, to aircraft and missiles.
Since President Trump announced a probe into copper in February, traders have been poised for a hike on copper duties, leading to major shifts in inventories away from Europe and Asia and into the U.S.
The Next Event: Will the Copper Tariffs get postponed or reduced?
The goal to increase domestic production of copper is very challenging. It will take years to ramp up and decades to fully meet demand — at a massive upfront investment cost.
Hiking the import duties would not help national security. It could not change the fact that the biggest copper mines are in Chile, Peru and Canada. A sharp increase in the cost of copper will quickly translate into wide-ranging inflation in the U.S.
In my opinion, once the Trump administration realizes the full impacts, we could possibly see a crawl-back from the intended copper tariffs. The effective date would be postponed, the tariff rate could be reduced, and many companies may get exemption/waiver. We have seen similar maneuvers happening multiple times in the past few months.
Overall, the actual impact of copper tariffs will be much smaller than the original announcement.
Shorting COMEX Copper Futures
Historically, the price difference between COMEX and LME coppers has been near-zero and was around the $150 level in 2024.
Since February, COMEX copper has been trading at $500-$1,500 premium over LME. As of Friday, COMEX copper futures have gone up 35% this year and are now priced at $2,652 per ton above LME copper.
In my opinion, these price differences reflect no economic fundamentals. It is purely due to the ever-changing global tariff conflict. If President Trump rescinds his tariff narratives, we could likely see a large drop in COMEX copper prices.
A trader sharing this view could explore shorting the COMEX Micro copper ( GETTEX:MHG ).
Last Friday, the September micro copper futures contract (MHGU5) was settled at 5.5910. Each contract has a notional value of 2,500 pounds of high-grade copper, or a market value of $13,977.5. To buy or sell 1 contract, a trader is required to post an initial margin of $1,100. The margining requirement reflects a built-in leverage of 12.7-to-1.
Let’s use a hypothetical trade to illustrate how to use a short futures position to take advantage a potential reduction on copper tariffs.
Hypothetical Trade:
• Short 1 MHGU5 contract at 5.5910, and set a stop loss at 6.00
• Trader pays $1,100 for initial margin
Scenario 1: Tariffs go into effect, copper rises to $6.57
• Futures reflect a 50% premium over current LME copper price, which is at $4.38 per pound
• Short order stop loss at 6.00, and the maximum loss is $1,022.5 (= (6-5.591) x 2500)
• The trader loses most of the margining fund, but owes no more
Scenario 2: Trump Rescinds Tariffs, Copper falls to $4.38
• COMEX copper will be priced at No premium over LME
• Short position gains: $3,027.5 (= (5.591-4.38) x 2500)
• The hypothetical return will be 275.2% (= 3027.5 / 1100)
The above scenarios show that
• When copper falls, short position will have higher returns due to its leverage nature.
• When copper rises, the stoploss will kick in to set maximum losses.
The above trade idea could be deployed using the standard-size Copper Futures contract. Its notional value is 25,000 tons, which is 10 times bigger than that of the micro contract. The initial margin is $11,000. The standard-size contract is more liquid. On Friday, it had a total volume of 60,313 contracts, and an open interest of 221,682.
Happy Trading.
Disclaimers
*Trade ideas cited above are for illustration only, as an integral part of a case study to demonstrate the fundamental concepts in risk management under the market scenarios being discussed. They shall not be construed as investment recommendations or advice. Nor are they used to promote any specific products, or services.
CME Real-time Market Data help identify trading set-ups and express my market views. If you have futures in your trading portfolio, you can check out on CME Group data plans available that suit your trading needs www.tradingview.com
GBPUSD → Correction amid a global bullish trend...FX:GBPUSD is testing the 1.345 - 1.35 area as part of a correction. The price is closing the imbalance zone and testing support, which may trigger a reaction. Further developments will largely depend on the dollar, which is testing resistance.
The daily market structure is quite strong. The correction against the backdrop of a strong trend is within acceptable limits, and bulls should fight to keep the price away from risk zones. GBPUSD, as part of the correction, closes the imbalance zone of 1.34 - 1.35 (0.7 - 0.79f) and forms a false breakdown of the intermediate support level of 1.3476. If buyers hold their ground in the 1.347-1.35 zone, the currency pair will be able to return to the global trend.
Support levels: 1.3476, 1.345, 1.3382
Resistance levels: 1.3511, 1.359, 1.375
Price consolidation above 1.349 - 1.350 will confirm the market's intentions. In this case, we can expect growth to 1.36 - 1.374.
Best regards, R. Linda!

Where Will XRP go?Short‑Term (some weeks)
-There’s strong excitement around the ProShares XRP ETF, launching July 18, 2025, which has boosted institutional inflows and whale wallet activity.
-Technical indicators currently signal overbought conditions, increasing the chance of a correction before further upward movement .
Mid‑Term (6–12 Months)
-Analysts are factoring in XRP potentially becoming a $750 billion asset ($12–$13 per XRP) through institutional acceptance and tokenization use cases .
-However, hitting that target will require transformative adoption, regulatory clarity, and heavy usage on the XRP Ledger.
Long‑Term (1–5 Years)
-If XRP captures large markets like CBDCs, remittances, real‑world asset tokenization, and stablecoin usage, prices could surge significantly.
-Still, such outcomes hinge on regulatory alignment and broad ecosystem deployment.
Recent Crypto Mining News
AI + Mining Megadeals
-CoreWeave (an AI infra firm) is acquiring Bitcoin miner Core Scientific for $9 billion, signaling a pivot from mining to AI compute.
Ethereum‑Backed Treasury Shifts
-BitMine Immersion saw its stock surge ~3,000%, moving its treasury to Ethereum.
-BIT Mining Ltd. doubled its stock after investing heavily in Solana, diversifying beyond Bitcoin.
Broader Mining & Regulation Trends
-U.S. “Crypto Week” is underway with bills like the CLARITY Act and GENIUS Act aiming to define stablecoin rules and improve clarity.
-Tech energy demands, especially from AI, now rival those of crypto mining—raising questions of sustainability.
-Disclaimer: This analysis is for informational and educational purposes only and does not constitute financial advice, investment recommendation, or an offer to buy or sell any securities. Stock prices, valuations, and performance metrics are subject to change and may be outdated. Always conduct your own due diligence and consult with a licensed financial advisor before making investment decisions. The information presented may contain inaccuracies and should not be solely relied upon for financial decisions. I am not personally liable for your own losses, this is not financial advise.

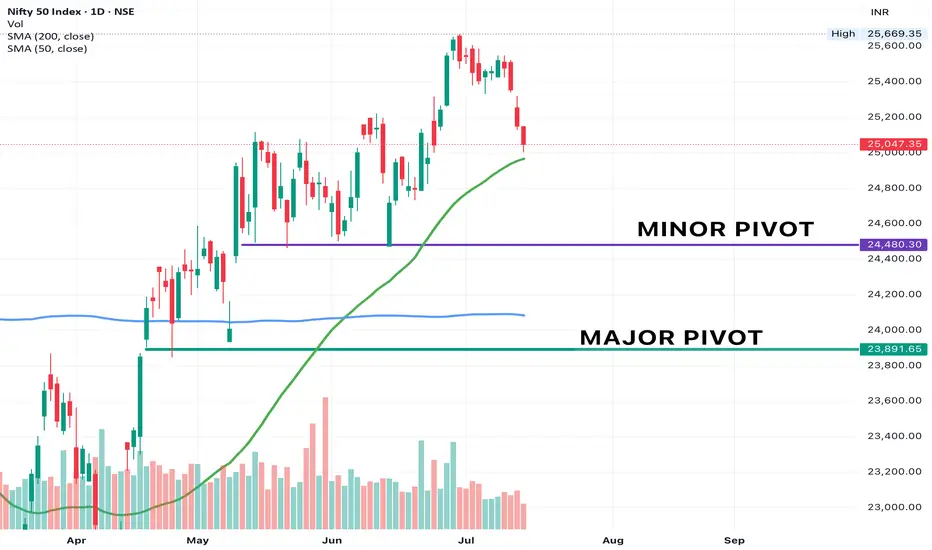
NIFTY Quick update - We are less than 3% away from the ATH. This is a healthy market pullback. 50 DMA is above 200 DMA and is trending up.
This could be a short term pivot and we can touch (or slightly undercut 50 DMA) and continue moving up. My portfolio is infact rising during this pullback - this implies the strongest stocks are actually still leading, there is no profit booking yet.
Use this time to cut out your underperforming stocks and add to your winners. Strongest Pockets in the markets - Finance, Banks, Capital Markets, Pharma, Infra/Realty.
Some pockets that are setting up - Metals, IT, Auto (dont expect outperformance here, markets have moved up while these are still setting up, so its a good chance they move in line with the markets, not much alpha here)
EURAUD: Rebound to 1.798 is high probabilityI am watching for a reversal here EURAUD as marked on my chart, expecting a rejection with a upside target at around 1.798.
This are is where it can become a decision point, either price finds support and bounces, or it breaks below, and that’s when we might see the move start to extend lower.
If we get a decisive move upside, my next area of interest is marked as T2. From there we can expect either potential accumulation or another reaction, depending on broader market sentiment at the time.
Just sharing my thoughts for the charts, this isn’t financial advice. Always confirm your setups and manage your risk properly.
Disclosure: I am part of Trade Nation's Influencer program and receive a monthly fee for using their TradingView charts in my analysis.

Gold vs Euro: Heist Plan Activated – Watch the Breakout🏆XAU/EUR Golden Robbery Masterplan: Steal from Weak Hands, Escape with Gold!💰✨
🌍Hi! Hola! Ola! Bonjour! Hallo! Marhaba!🌍
Welcome, Money Makers & Market Robbers! 🤑💰💸✈️
Another top-secret robbery mission drops now — this time on the XAU/EUR battlefield! Gold vs Euro... Who wins? We do! 🏴☠️🎯
🔍The Setup:
Thief Trading Strategy™ Active – Bullish Breakout Mode Engaged
🔒 Resistance wall at 3400 is the lock.
💣 Breakout is the detonation point.
🟢 Target: 2970.00 (but smart robbers always escape before the sirens ring 🚨).
⚠️ATR Zone = danger zone = potential trend reversal trap = don’t get greedy.
🛠️Execution Plan (aka How to Rob the Market Clean)
📈 Entry Plan
"The vault’s about to open..."
💥 Breakout above Moving Average (3400) = BUY confirmation.
☑️ Set Buy Stop Orders just above MA.
☑️ OR plan a Pullback Buy Limit on recent swing low/high in 15–30M TF.
🛎️ SET ALERTS like a real thief waiting for the back door to open!
🛑 Stop Loss Strategy
"Don’t be a hero – be a survivor."
📍 SL suggestion: 2845.00 (2H swing low)
💡 Customize SL based on lot size & risk appetite.
🚨 Only set SL after breakout confirmation (don’t let false alarms shake you).
🎯 Profit Target / Exit Strategy
⛏️ Dig for gold at 2970.00, but
🏃♂️Escape before the trap springs.
🧲 Scalpers: Stick to LONGS only!
💼 Big accounts: hit hard.
🧠 Small robbers: join swing crew and trail the stop — protect the loot 💰
📊 Trend & Fundamentals Summary
⚖️ Current Trend: Neutral → Bullish Bias
🔍 Influenced by:
Macro Data
Euro Sentiment Shift
COT Positioning
Central Bank Whispers
Intermarket Forces
Geopolitical Sparks 🔥
🧠 Full breakdown in the fundamental zone (liinkk 🔗 Klik).
🚨 News Warning Alert
📰 Avoid entries near major news releases.
🎯 If in trade, manage with trailing SL to lock profits & limit damage.
🔥💖 Support the Mission
Hit that BOOST 💥 button — fuel our next big heist.
Let’s show the market we rob, we don't beg!
💪 Be loyal to the crew. Trade smart. Escape rich. 🐱👤📈
🔐 Disclaimer:
This is for education & entertainment – not financial advice.
💡 Always DYOR & adjust risk per your capital.
🧠 Stay sharp. Stay rich. See you on the next score! 💼🚁💸

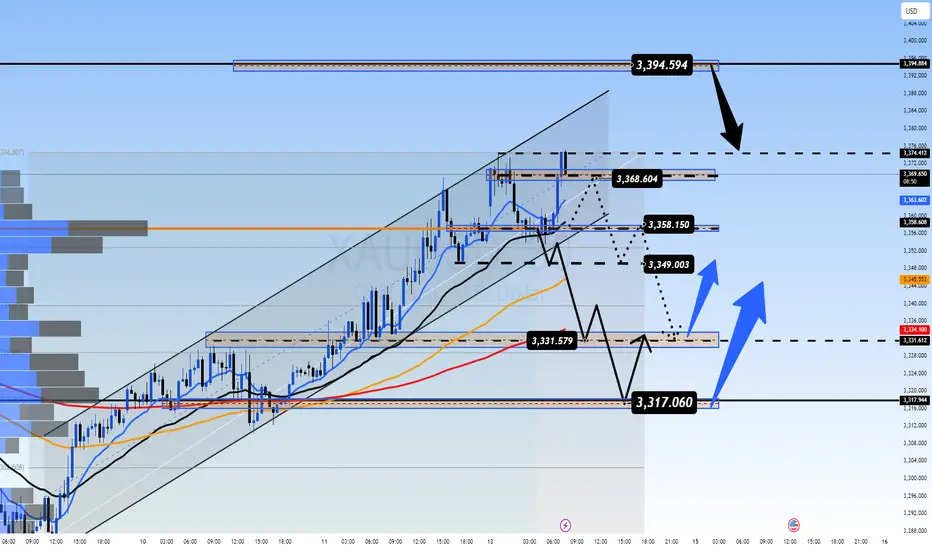
Early Week Pullback Ahead of Key Economic ReleasesGold Outlook – 14 July | Early Week Pullback Ahead of Key Economic Releases
🌍 Market Sentiment & Macro Overview
Gold has started the week with a sharp retracement after filling prior liquidity gaps (FVG) from the past two weeks.
This early weakness signals a risk-off tone as traders adopt a cautious stance ahead of a heavy macroeconomic calendar and geopolitical trade discussions.
This week’s high-impact events include:
📌 US CPI (Inflation Data)
📌 US PPI (Producer Prices)
📌 Unemployment Claims
📌 Retail Sales Figures
These data points will likely set the tone for price action through the second half of the week, with potential for sharp moves in gold.
📉 Technical Snapshot – M30 Chart Structure
Price swept minor liquidity above recent highs
Pulled back by more than $15 from the short-term top
Currently trading below the intraday VPOC (~3358), suggesting short-term bearish momentum
If the selling pressure holds, we may see a move toward:
⚠️ 333x zone — initial liquidity pool
❗ 332x zone — deeper liquidity grab before any bullish reversal
🧭 Trading Plan – Key Zones and Setup
📥 Buy Setup: 3331 – 3329 (Zone of Interest)
Stop Loss: 3325
Target Levels:
TP1: 3335
TP2: 3340
TP3: 3344
TP4: 3350
TP5: 3360 – 3370
✅ A highly reactive zone — ideal for intraday long setups if price sweeps into this area and shows bullish confirmation (e.g., volume spike or rejection wick).
📤 Sell Setup: 3393 – 3395 (Resistance Re-Test)
Stop Loss: 3399
Target Levels:
TP1: 3390
TP2: 3386
TP3: 3382
TP4: 3378
TP5: 3374 – 3370 – 3360
📉 Potential scalp zone if price retests resistance with signs of exhaustion. Monitor closely for bearish structure confirmation.
📊 Key Support & Resistance Levels
Resistance Zones:
3358
3368
3374
3394
Support Zones:
3349
3340
3331
3318
These zones remain relevant for both momentum trades and reversion setups.
⚠️ Strategy Considerations
At the time of writing, gold is trading indecisively around the M30 VPOC. No clear breakout has occurred yet.
⏳ Wait for volume confirmation during the London session
🚫 Avoid impulsive entries based on emotions or FOMO
✅ Stick to your risk parameters and let price come to your level
🧠 Summary & Bias
Gold is experiencing an early-week technical correction after recent strength.
The market is in "wait-and-see" mode, with macro drivers likely to dictate direction from mid-week onwards.
📍 Watch the 3331–3329 zone closely — it remains the most attractive level for long setups.
📍 The 3393–3395 zone is a key area to fade strength if price struggles at resistance.
Patience and precision are key this week. Let the market reveal its intention, and trade accordingly.

XAUUSD Analysis – July 14, 2025: Gold Tests Critical Resistance Gold (XAUUSD) is currently trading around $3,373, rebounding strongly from the recent low at $3,294. Price is now testing the key resistance zone at $3,372–3,375, which aligns with the 0.0 Fibonacci retracement of the previous downtrend and a significant supply zone on the H4 timeframe.
1. Technical Analysis (H4 Chart):
🔹 Fibonacci & Price Action:
The price found strong support at $3,294, where previous demand and Fibonacci levels converge.
A sharp bullish move has pushed price above the 0.5 (at $3,316) and 0.618 (at $3,322) Fibonacci levels – signaling strong buyer interest.
The $3,372 zone is now acting as short-term resistance, matching the previous swing high.
🔹 EMA & RSI:
EMAs are trending upward, confirming short-term bullish momentum.
RSI is approaching overbought territory, suggesting a potential pullback in the short term.
🔹 Trendline & Structure:
Price remains above the rising trendline, indicating sustained bullish momentum.
The nearest support zone is now at $3,322 – $3,333, which overlaps with key Fibonacci and previous structure levels.
2. Key Price Levels:
Price Zone
Significance:3,372 – 3,375
Short-term resistance – Fibo 0.0:3,345 – 3,333
First support – pullback zone:3,322 – 3,316
Strong support – EMA + Fibo 0.5:3,294 – 3,287
Major support – recent swing low
3. Suggested Trading Strategies:
Strategy 1 – Take Profit for Existing Longs:
If you entered long positions near $3,295–$3,300, consider taking partial profits at the current resistance zone ($3,372–$3,375).
Strategy 2 – Short-Term Sell Opportunity:
Consider a short entry near $3,372–$3,375, with a stop-loss above $3,383.
Target profit: $3,333 – $3,322
Strategy 3 – Buy on Dip (Trend Continuation):
If price pulls back to the $3,333 – $3,322 support and holds, this is a good zone to enter long.
Stop-loss below $3,316, with potential target back to $3,385 – $3,400 if a breakout occurs.
Gold is showing a solid recovery after a sharp decline, but it is now testing a key resistance zone around $3,373. Caution is advised in the short term, as a pullback may occur. Priority should be given to "Buy on Dip" strategies if support zones hold.

BTC: Next price Halving 📊Analysis by AhmadArz: #BTCUSD
By calculating the price growth in the 4-year halving time frame, we came to the conclusion that with the growth of the Bitcoin market cap, its growth will be halved and we can expect $120,000 from Bitcoin, and it is expected to grow up to 270,000 dollars in halvings.
🔗"Uncover new opportunities in the world of cryptocurrencies with AhmadArz.
💡Join us on TradingView and expand your investment knowledge with our five years of experience in financial markets."
🚀Please boost and💬 comment to share your thoughts with us!

BTC Weekly Update -as of Jul14🕰 Timeframe:
📆 Date:
🔎 Market Overview:
💼 Massive Institutional Inflows:
▪️ Over $1.1 billion in net capital inflows have entered spot Bitcoin ETFs in recent days, bringing the total weekly inflows to $2.72 billion so far.
▪️ The total assets under management (AUM) across all Bitcoin ETFs now exceed $150 billion, representing over 6% of Bitcoin’s total market capitalization.
⚖️ Favorable Political and Regulatory Support:
▪️ The ongoing Crypto Week in Congress is reviewing key legislative proposals like the Genius Act and the Clarity for Digital Assets Act, both of which offer promising regulatory clarity for the crypto industry.
▪️ Additionally, former President Trump’s executive order to establish a “Strategic Bitcoin Reserve” signals strong official political support for Bitcoin adoption.
📊 On-Chain & Sentiment Indicators
📦 Exchange Reserves:
Bitcoin reserves on centralized exchanges are at their lowest levels in years, suggesting a trend toward long-term holding (HODLing) and reduced selling pressure.
🧠 Fear & Greed Index:
The sentiment index remains firmly in the “Greed” zone, even hitting its highest level since May, indicating strong bullish sentiment among retail and institutional investors.
🌀 Whale Activity:
Whale wallets continue to show heavy accumulation, with large and steady transfers into private wallets, further supporting a bullish on-chain trend.
📈 Technical Setup
🔵Trend: Ranging upward
🔸 Key Support: 118,000➖ 115,000
🔸 Key Resistance: 125,000➖ 130,000
🔸 Indicators Used: RSI above 70
🧭 Next Week – Key Points
🔹 Watch for the outcomes of Crypto Week legislation in Washington — this will be a key driver for market direction.
🔹Monitor ETF capital inflows — if daily inflows stay above $500M, the bullish trend will likely strengthen.
🔹 Track the Federal Reserve's interest rate policy and the USD outlook, especially in response to inflation or other macroeconomic factors.
🔚 Summary: Final Analysis
📌 After reaching a new all-time high above $122K on July 14, Bitcoin’s bullish trend has strengthened. Strong institutional inflows and political support have reinforced the foundation for growth.
● Key Level Ahead: $125,000
● Outlook: If price consolidates above resistance, we could see a move toward $135K and beyond.
● Weekly Bias: Bullish, with potential for a pullback before continuation upward.
✅ If you like this analysis, don't forget to like 👍, follow 🧠, and share your thoughts below 💬!

BITCOIN → Stopping after the rally? What next? 125K or 110K?BINANCE:BTCUSDT rose and updated its historical maximum to a new record of 118K with “kopecks” (different prices on different exchanges). Now the price has supposedly stopped and entered a consolidation phase, but it is too early to draw any conclusions based on this alone...
Fundamentally, Bitcoin rose following the SP500 and NQ100 indices. The reasons are clearly geopolitical. The correlation level is not high, but the flagship is following the stock indices, which are also updating their historical highs.
Technically, Bitcoin has emerged from a two-month consolidation and entered a realization phase. So what's next? Continuation of the phase or correction? Let's take a look.
On the daily chart, I would highlight two zones. The risk and sell zone is below 117,500. If the price closes below this zone today/tomorrow, we will most likely be able to look for signals for a possible correction. As part of the correction, we can expect a decline to 115,500, 114,300, or even to the old ATH of 112K.
The second zone is the buying zone. A closing price above 118,400–118,900 and consolidation with the gradual formation of a breakout of structure may hint at a possible continuation of growth toward psychological targets.
Resistance levels: 118,400, 118900
Support levels: 117100, 116700, 115500
In the chart above, I have highlighted the situations, levels, and zones that interest me more precisely.
Now I am waiting for Bitcoin to retest resistance or support and confirm certain levels, based on which decisions can be made. I think that in the near future, Bitcoin will show us where it is headed. Updates will be published as something interesting emerges...
Best regards, R. Linda!

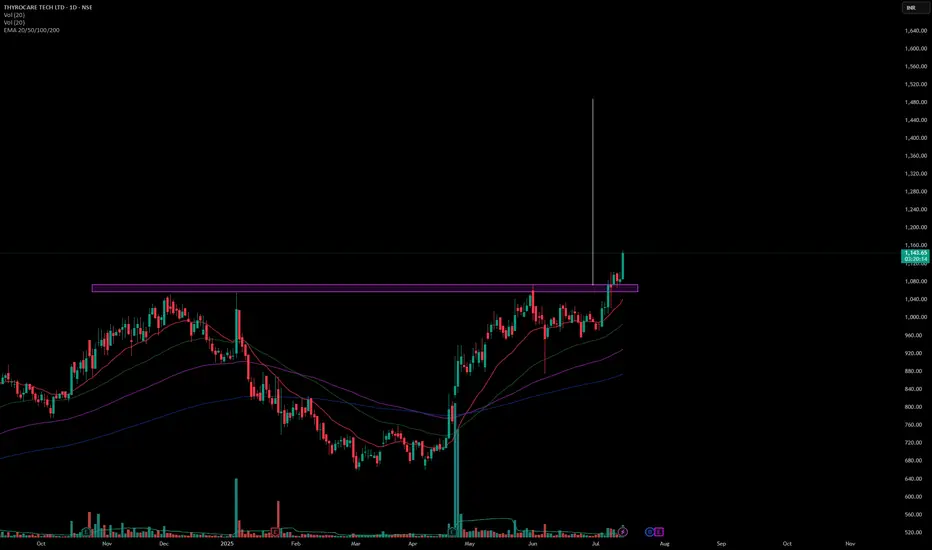
LongThis stock has broken its resistance level and trending with good volumes. We can take a swing trade in this stock with an SL of 6% and with target of 30%. Our profit and loss ratio is 1:5.
Points to remember:
* Take trade at current CMP.
* SL at point 1065.
* Target at point 1480.
It is the right time to go long after the shock and adjustmentGold opened higher at 3364 today, and after a brief surge to 3374, it entered a stage of shock and retracement. Our plan to arrange short orders near 3370 was successfully implemented, and we stopped profits in batches in the 3360-3355 range, making short-term profits. Overall, although it jumped higher due to the stimulus of news such as the increase in tariffs over the weekend, the momentum of the surge is limited, and the technical side still needs to retrace to digest the gains.
At present, the market has returned to the technical rhythm. The key support refers to the breakthrough point of 3340-3345 last Friday. Further exploration will look at the strong support of 3330. The overall rhythm is still mainly to arrange long orders near the low support, and going with the trend is the key. As long as the 3330 support is not broken, the daily line structure will still maintain a strong bullish trend. Do not blindly chase the short position. The operation of short orders against the trend needs to be particularly cautious. I will promptly remind you of the specific operation strategy according to the changes in the market. You can pay attention to the bottom notification. It is recommended that you keep paying attention and respond to the market rhythm steadily.
Reference for gold operation strategy: Go long on gold near the 3345-3355 area, target the 3365-3370 line. If it breaks above 3370, you can continue to hold and hope for further continuation.

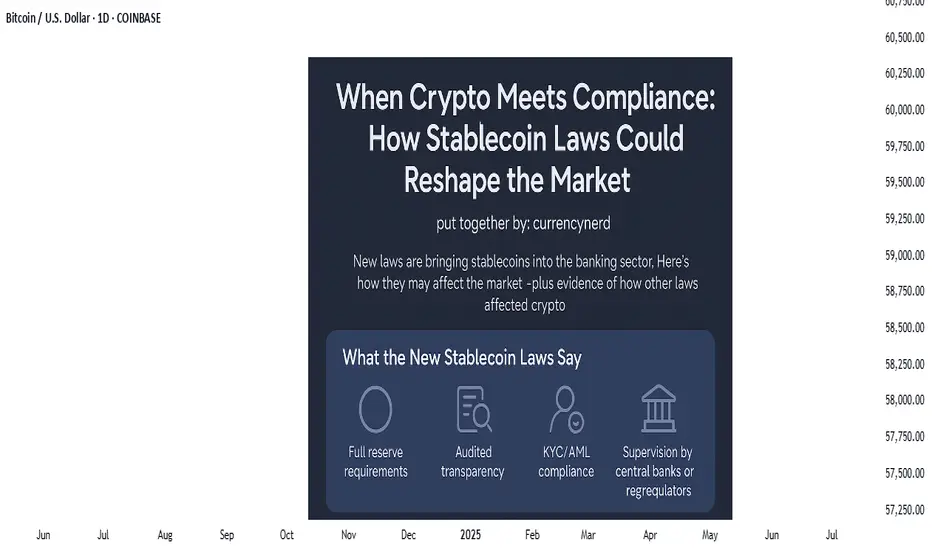
watch the laws, not just the charts.stablecoins were once the rebels of finance—anchored to fiat yet untethered from traditional banking laws, but the tides are turning. Across major economies, lawmakers are drawing up legal frameworks that place stablecoins inside the banking sector rather than outside of it. This shift could be the most pivotal regulatory development since Bitcoin was born.
But what does this really mean for traders, investors, and markets?
In this @TradingView blog we’ll unpack the new laws on stablecoins entering the banking realm, and what their ripple effect might look like, using past regulatory shifts as a lens to foresee market behavior.
🧾 Section 1: What the New Stablecoin Laws Say
Many regions—especially the EU, UK, Japan, and the US—are moving toward a model where stablecoin issuers must register as banks or hold full banking licenses, or at minimum, comply with banking-like oversight.
Key pillars of these laws include:
Full reserve requirements (1:1 backing in liquid assets)
Audited transparency on reserves and redemptions
KYC/AML compliance for users and issuers
Supervision by central banks or financial regulators
In the US, the House Financial Services Committee recently advanced a bill that would make the Fed the ultimate overseer of dollar-backed stablecoins.
In the EU, MiCA (Markets in Crypto-Assets) requires issuers of e-money tokens to be regulated financial institutions.
Japan now allows banks and trust companies to issue stablecoins under strict regulations.
💥 Section 2: Why This Is a Big Deal
Bringing stablecoins into the banking system could change how liquidity flows, how DeFi operates, and how capital moves across borders.
Potential market impacts:
Increased trust = more institutional money entering stablecoins and crypto markets.
DeFi restrictions = protocols may face scrutiny if they allow unverified stablecoin usage.
Flight from algorithmic or offshore stables to regulated, bank-issued stablecoins (e.g., USDC, PYUSD).
On-chain surveillance increases, potentially limiting pseudonymous finance.
Think of it as crypto’s "Too Big To Ignore" moment—where stablecoins become infrastructure, not outlaws.
📉 Section 3: Past Laws That Shaped Crypto Markets
Let’s examine how previous regulations have affected crypto markets—offering clues about what to expect.
🧱 1. China’s Crypto Ban (2017–2021)
Kicked off a massive market crash in 2018.
Pushed mining and trading activity overseas, especially to the US and Southeast Asia.
Resulted in more global decentralization, ironically strengthening Bitcoin’s resilience.
🪙 2. SEC Lawsuits Against XRP & ICO Projects
Ripple’s XRP lawsuit caused delistings and volatility.
Set a precedent for how tokens are treated under securities law.
Resulted in more structured token launches (via SAFEs, Reg D, etc.).
🧮 3. MiCA Regulation in Europe (2023 Onward)
Provided regulatory clarity, prompting institutions to engage more with regulated entities.
Boosted legitimacy of Euro-backed stablecoins like EURS and Circle’s Euro Coin.
Sparked a race among exchanges to gain EU registration (e.g., Binance France, Coinbase Ireland).
Each of these regulatory waves caused temporary volatility, followed by long-term growth—as clarity invited capital.
📊 Section 4: The Possible Scenarios for the Market
Here’s how things might play out as stablecoin laws become mainstream:
Golden Path-Regulated stablecoins coexist with DeFi; innovation meets compliance - Bullish for crypto adoption and capital inflows.
Walled Garden-Only bank-issued stablecoins are allowed; DeFi stifled -Neutral or bearish short-term, bullish long-term.
Backlash-Overregulation pushes stables offshore or into non-compliant zones - Bearish, liquidity fragmentation returns.
🔍 Nerdy Conclusion:
Stablecoins are no longer just tools for traders—they’re becoming the backbone of digital finance. Their formal entrance into banking law marks a turning point that traders must understand.
While regulation has historically caused short-term fear, it often leads to long-term maturity in crypto markets. The stablecoin laws now in motion could unlock the next chapter of institutional adoption, cross-border finance, and perhaps, the integration of crypto into the real-world economy at scale.
💡 Nerdy Thought:
When a technology becomes systemically important, it stops being ignored—it gets integrated. Stablecoins have reached that level.
put together by : @currencynerd as Pako Phutietsile
ZENUSDT | Triangle Breakout Setup Brewing!#ZEN is currently consolidating in a symmetrical triangle pattern on the 4-hour timeframe, following a strong bearish move. The price action has shifted to a sideways range, signaling a potential trend reversal or continuation setup in the making.
What to Watch:
We’re closely monitoring a bullish breakout from the triangle or resistance zone.
A confirmed breakout with a successful retest will trigger our long entry.
As always, proper risk management is key – wait for confirmation before entering.
Trade Plan:
✅ Wait for breakout above resistance
✅ Look for volume confirmation
✅ Enter on retest with a tight stop-loss
✅ Target recent highs for a solid R:R setup
What’s your take on #ZEN? Do you see a breakout coming or more chop ahead? Drop your thoughts in the comments!
Follow me for more real-time crypto setups and chart breakdowns!
#ZEN #CryptoTrading #PriceAction #TrianglePattern #BreakoutTrade #TechnicalAnalysis #ZENUSDT #Altcoins #TradingSetup #CryptoTA #BullishBreakout #SwingTrade #4hrChart #TradingViewIdeas

Gold begins bullish recoveryIon Jauregui – Analyst at ActivTrades
Gold posted a slight gain during Monday's Asian session, driven by renewed safe-haven demand amid escalating trade tensions between the United States and several key economies, as well as rising geopolitical uncertainty surrounding Russia and Ukraine.
The initial uptick in gold was supported by the announcement of 30% tariffs by Donald Trump on Mexico and the European Union, in addition to harsher levies on Japan, South Korea, and Brazil. The prospect of a renewed wave of protectionism has raised concerns over global economic stability, boosting gold's appeal as a safe-haven asset. Added to this is geopolitical tension following reports that Trump is planning to send offensive weapons to Ukraine, potentially escalating the conflict with Russia. These factors have reinforced risk-off sentiment in the markets.
However, the strength of the US dollar (DXY +0.1%) and anticipation ahead of the US CPI data, due Tuesday, are capping gold’s upside. Higher-than-expected inflation could reinforce expectations of a tighter monetary policy from the Federal Reserve, which would weigh on precious metals.
After reaching an intraday high of $3,361.42 per ounce, the Asian market closed lower, leaving gold at $3,356.66 per ounce, a level at which it has since consolidated ahead of the European open. This behavior reflects a technical pause in the initial bullish momentum, with the current point of control aligning with that same price zone, suggesting a temporary neutralization of buying pressure. The RSI at 54% confirms a lack of strength, while the MACD indicates a potential upward directional shift with a signal line crossover and a modestly green histogram to start the week. Moving average crossovers show the 50 and 100 SMAs supporting the bullish push that began last Wednesday. Gold’s next decisive move may depend on upcoming US inflation data and developments in geopolitical tensions.
Silver, meanwhile, stood out with a sharp 1.4% surge to $39.493 per ounce, its highest level since 2011, while platinum and copper delivered mixed performances.
This week, gold prices could be driven by the confirmation of elevated US inflation data, which would strengthen the metal's role as a hedge against purchasing power loss, especially if doubts persist regarding the Fed’s policy stance. Added to this are rising geopolitical tensions due to Trump’s potential delivery of offensive weapons to Ukraine, further protectionist measures that could worsen the global trade war, and increased risk aversion should equity markets react negatively. In this context, gold is positioned as one of the main beneficiaries amid growing economic and political uncertainty.
*******************************************************************************************
The information provided does not constitute investment research. The material has not been prepared in accordance with the legal requirements designed to promote the independence of investment research and such should be considered a marketing communication.
All information has been prepared by ActivTrades ("AT"). The information does not contain a record of AT's prices, or an offer of or solicitation for a transaction in any financial instrument. No representation or warranty is given as to the accuracy or completeness of this information.
Any material provided does not have regard to the specific investment objective and financial situation of any person who may receive it. Past performance and forecasting are not a synonym of a reliable indicator of future performance. AT provides an execution-only service. Consequently, any person acting on the information provided does so at their own risk. Political risk is unpredictable. Central bank actions can vary. Platform tools do not guarantee success. Regulated status does not guarantee security.
