Soybean Breakout – Time to Steal Profits!🚨 "SOYBEAN HEIST ALERT: Bullish Loot Ahead! 🎯💰 (Thief Trading Strategy)"
🌟 Greetings, Market Pirates & Profit Raiders! 🌟
"The vault is unlocked—time to plunder the 🌱🍃SOYBEAN CFD market! Here’s your master plan for a smooth heist."
🔎 TRADE SETUP (Thief Edition)
Entry 📈: "Buy the dip or chase the breakout—bullish momentum is ripe for stealing!"
Pro Tip: Use buy limits near 15-30min pullbacks (swing lows/highs) for optimal theft.
Stop Loss 🛑: "Hide your loot!" Set SL at nearest 4H swing low (1030.00). Adjust based on your risk appetite.
Target 🎯: 1085.0 — or escape early if bears ambush!
⚡ SCALPERS’ NOTE:
"Only long scalps allowed! Rich? Raid now. Poor? Join swing thieves & trail your SL!"
🔥 WHY SOYBEAN? (Bullish Catalysts)
Technicals + fundamentals align for a bullish heist.
Check: COT reports, seasonals, macro trends, and intermarket signals (links below 👇).
⚠️ WARNING: NEWS = VOLATILITY
Avoid new trades during major news.
Trailing SLs = your escape rope! Lock profits before the cops (bears) arrive.
💎 BOOST THIS HEIST!
"Smash 👍 LIKE, hit 🔔 FOLLOW, and share the loot! Your support fuels our next raid."
🎯 Final Tip: "Profit is yours—take it and vanish! 🏴☠️"
📢 Stay tuned for the next heist! "Market thieves never sleep…" 😉
Fundamental Analysis

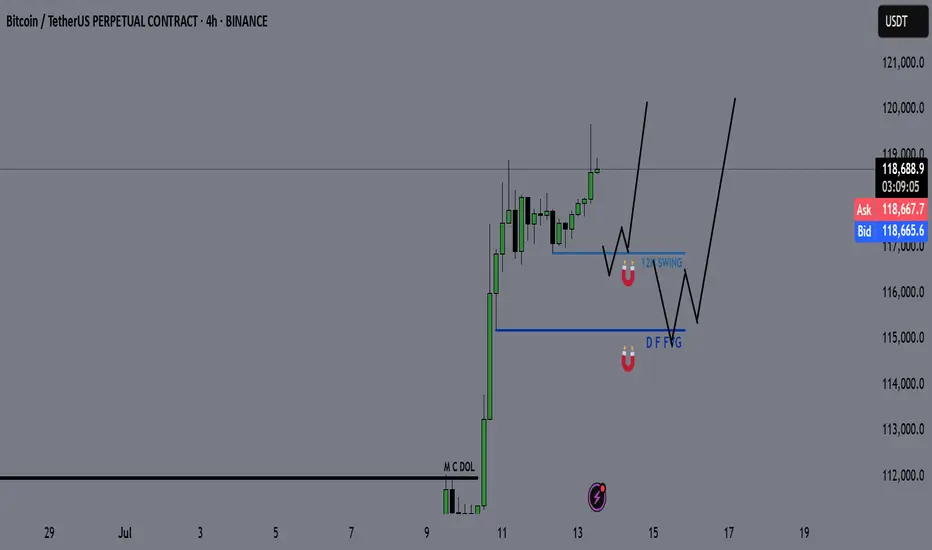
Bitcoin - BTC | Weekly Market Recap & Outlook 13.07.2025What Happened Last Week?
Bitcoin broke out of the recent downtrend structure and established a bullish leg with clear momentum.
The breakout was supported by volume and price structure, suggesting a trend reversal rather than a temporary deviation.
Weekly Bias and Strategy
The current outlook is bullish.
A retracement or sideways consolidation between the $120,000 and $114,000 zone is possible.
This zone may act as accumulation before further upside.
Key Points of Interest (POIs):
12H Swing Liquidity (turquoise line)
Daily FVG (blue line)
These levels will be monitored for long setups with confirmation on lower timeframes.
Macro Consideration – Fed Chairman Jerome Powell
Recent market speculation has increased regarding Jerome Powell potentially stepping down as Chair of the Federal Reserve.
If such a resignation is confirmed, it may act as a significant bullish catalyst for Bitcoin and other risk assets, possibly accelerating upside without allowing for any meaningful pullback.
Summary
• Bullish breakout confirmed
• Long bias maintained unless major invalidation occurs
• Watching retracement levels for entries
• Macro catalyst (Powell resignation) may trigger strong continuation without retrace
ETH / USDC Liquidity Pool RangeEthereum is climbing alongside Bitcoin, but it’s clearly outperforming. In many ways, ETH is the Microsoft of the crypto space—serving as a foundational platform on which countless networks and tokens are built, much like Windows supports a broad software ecosystem. In contrast to Bitcoin’s role as a digital currency, Ethereum functions more like a software operating system.
We broke out of the previous range for strong profits. The new range is tighter, with the lower boundary set just above the current ETH spot price at $2,995.91 and the upper boundary at $3,340.90, as marked by the horizontal yellow lines. On the 3-hour chart, momentum is beginning to turn upward. To enter the liquidity pool within this range, we must be fully allocated in ETH.

Gold Looks Bullish: technical and fundamentalHi Guys!
Gold is starting to flash major bullish signals, and this time, it’s not just about the chart. The technical setup is clean, but we’re also seeing fundamental tailwinds that could fuel a bigger move.
Let’s break it down
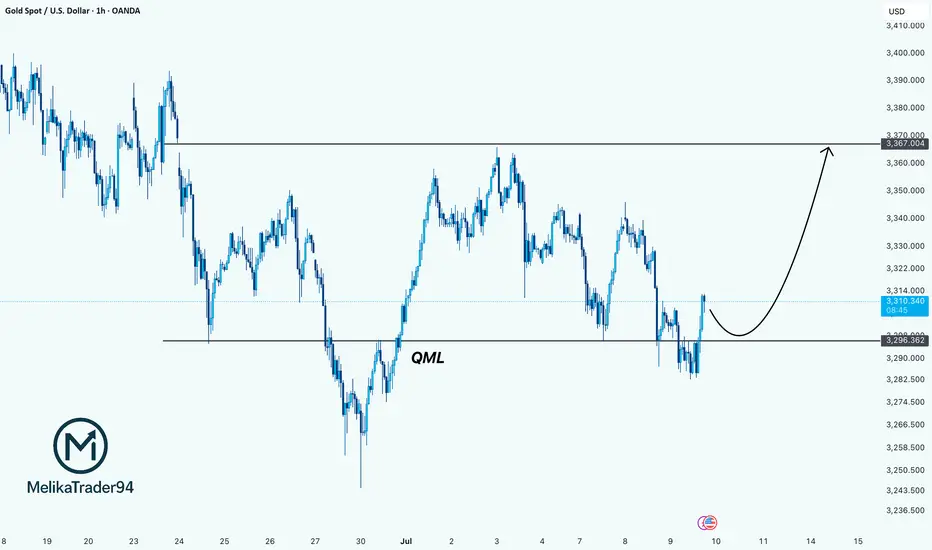
1. Technical Setup: The QML Reversal Is In Play
On the 1H chart, Gold is showing a textbook Quasimodo (QML) reversal pattern. Price made a lower low, then reversed up to break structure, and now it’s pulling back and respecting the key QML zone around $3,296.
This zone has turned into strong support. As long as we stay above it, the structure suggests a continuation toward $3,367 — a clean upside liquidity target and the previous high.
Strategy: Look for pullbacks into $3,296 for potential long entries with targets around $3,367 or higher.
2. Fundamental Tailwinds: Why Gold Is Gaining Strength
The fundamentals are stacking up in Gold’s favor right now. Here’s what’s fueling the move:
- Weakening USD & Rate Cut Expectations
With the Fed increasingly signaling rate cuts by late 2025, the US dollar is losing steam. Lower interest rates reduce the opportunity cost of holding non-yielding assets like Gold, making it more attractive to investors. Traders are already pricing this in.
- Softening Economic Data
Recent U.S. data, including weaker-than-expected job growth and declining manufacturing numbers, points to a slowing economy. That puts more pressure on the Fed to pivot dovish, which historically sends Gold higher.
- Central Bank Demand
Global central banks (especially in Asia) continue to accumulate physical Gold as part of their long-term reserve strategy. That institutional demand provides strong support at lower levels.
Technical + Fundamental = Strong Bullish Bias
We’re seeing a solid confluence here:
Chart says long (QML + bullish structure)
Macro says long (dovish Fed + weaker dollar + safe haven demand)
Drop your thought here!
"Gold at a Crossroads! Bullish or Bearish? (Trade Plan)"🦹♂️💰 "Gold Heist Alert: XAU/USD Bullish Raid or Bearish Ambush?" 💰🦹♂️
🌍 Greetings, Market Pirates & Profit Raiders! 🌍
(Hola! Oi! Bonjour! Hallo! Marhaba!)
Based on the 🔥Thief Trading Method🔥, here’s our strategic heist plan for XAU/USD (Gold vs. Dollar). Follow the chart markings for high-probability loot zones—whether you're a bullish bandit or a bearish burglar! 🏴☠️💸
🎯 Entry Strategy (Where to Strike)
"The treasure is ripe for taking! Breakout = GO TIME!"
✅ Long Entry (Bullish Raid): Jump in at current levels if the uptrend holds.
✅ Short Entry (Bearish Ambush): Wait for a break & close below 3280.00 (confirms downtrend).
🛑 Stop Loss (Escape Route)
🚨 For Bulls: Bail out if price hits 3240.00 (SL tightens if trend strengthens).
🚨 For Bears: Retreat if price surges past 3360.00 (only activate SL post-breakout!).
🎯 Take Profit (Loot & Scoot!)
💰 Bullish Thieves: Aim for 3600.00 (or exit early if momentum fades).
💰 Bearish Bandits: Target 3125.00 (or escape before the cops—err, reversal—arrives).
📡 Market Intel (Why This Heist?)
Gold’s in a neutral zone (but bulls have the edge! 🐂📈). Key factors:
Macroeconomic shifts
COT data clues
Sentiment & seasonal trends
(Full breakdown in the chart notes—klick the 🔗! 🔍🌐)
⚠️ Danger Zones (News & Risk Control)
🚨 High-Impact News = NO NEW TRADES!
🚨 Protect open positions: Use trailing stops to lock in profits.
🚨 Adjust SLs if volatility spikes!
💥 Boost the Heist! 💥
Like & Share to fuel our next market robbery! 🚀💰
Follow for more lucrative trade setups—coming soon! 👀🔥
🎯 Trade Smart, Steal Smarter! 🦹♂️💎

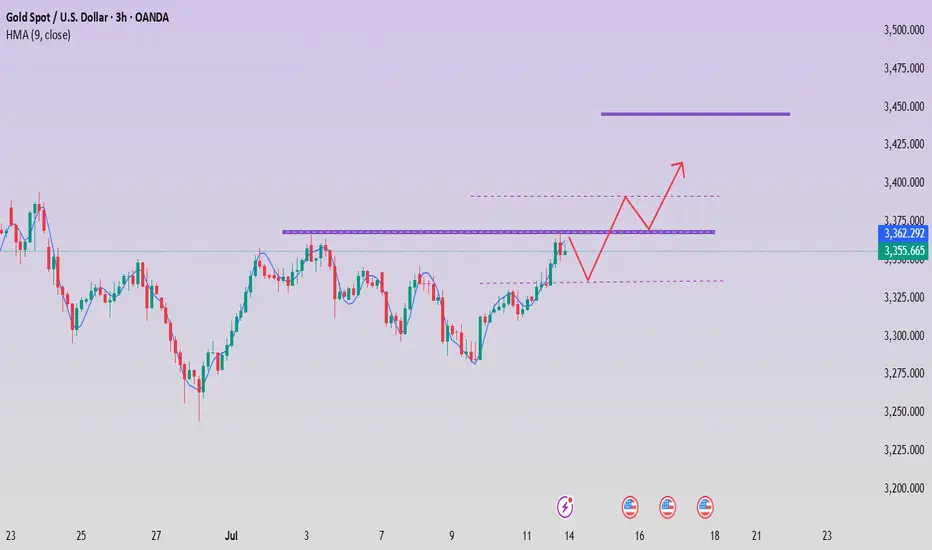
GOLD - GC | Weekly Recap & Plan 13.07.2025🟡 GOLD (GC) Weekly Recap & Outlook
Symbol: GC1!
Date: Week of July 8–12, 2025
Timeframes Used: 4H, Daily, Weekly, HTF structure
🔍 What Happened Last Week?
Gold saw a strong rejection from a confluence of two HTF trendlines, signaling resistance.
But that move was absorbed by:
🟦 Daily Demand (blue zone)
🔵 Daily Swing Liquidity (blue line)
This builds a bullish structure on the daily chart.
🧭 Scenarios I'm Watching
Scenario 1 — Minor Pullback:
🔹 Price may revisit the Daily Gap (pink line) and find support for continuation.
Scenario 2 — Deeper Pullback:
🟣 Price could retrace into the HTF bullish trendline (purple) before resuming upside.
🗞️ Bonus Macro Scenario: Powell Resignation?
There are growing rumors that Fed Chair Powell might resign this week.
📈 If that happens, I expect strong bullish momentum in Gold —
→ very limited retracement, and
→ potential straight breakout into new highs.
🎯 Targets for the Week:
✅ 1st Target:
W C DOL (purple line) → acts as a primary take profit area.
✅ 2nd Target (Expansion):
EQHs / DOL (extended purple levels)
Game Plan:
Watch for LTF confirmation on both retracement zones.
Maintain bullish bias unless Daily Demand fails.
If Powell resigns, be ready for breakout setups.

OBOL $0.15 as soon as possibleHello,
I think Obol pump as soon as possible and very fast price go to the $0.15 and more.
The total tokens in circulation are less than 100 million, but volumes above 200 million on a particular exchange are unusual and indicate a price manipulation that is caused by lowering the price and collecting tokens on other exchanges.
You can buy on other exchanges and transfer to your wallet and expect a pump and profit of over 300%.
What do you think?
Thank you

Gold rises after brief recovery
Let’s review the gold price for next week from July 14, 2025 to July 18, 2025
⭐️Gold Information:
Gold prices surged nearly 1% on Friday as sentiment soured over U.S. President Donald Trump’s controversial trade policy targeting Canada, while hinting at broader tariffs on other countries and copper. At the time of writing, XAU/USD was trading at $3,354, rebounding from an intraday low of $3,322.
On Thursday, Trump announced a 35% tariff on Canadian imports, but goods eligible under the 2020 USMCA trade agreement remain duty-free. He also expressed his intention to extend tariffs to most trading partners, proposing a basket of rates ranging from 15% to 20%.
With a light U.S. economic calendar, attention turns to comments from the Federal Reserve. Chicago Fed President Austan Goolsbee dismissed calls for rate cuts aimed at reducing government borrowing costs, stressing that the central bank's focus remains firmly on employment and price stability.
⭐️Personal Comment:
Growth with the trend, maintaining the accumulation price zone above 3300
🔥 Technical:
Based on the resistance and support levels of gold prices on the 4-hour chart, NOVA has identified the following important key areas:
Resistance: $3392, $3447
Support: $3330, $3308, $3246
MP Materials Options Ahead of EarningsIf you haven`t bought MP before the previuos earnings:
Now analyzing the options chain and the chart patterns of MP Materials prior to the earnings report this week,
I would consider purchasing the 25usd strike price Calls with
an expiration date of 2025-6-20,
for a premium of approximately $2.97.
If these options prove to be profitable prior to the earnings release, I would sell at least half of them.

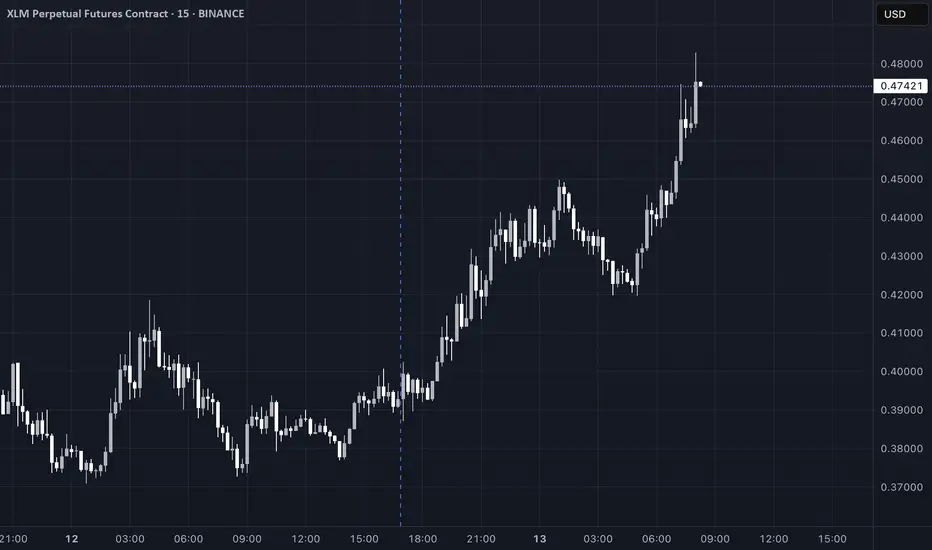
XLM Crypto Analysis Summary (2025-07-13)XLM Crypto Analysis Summary (2025-07-13)
Comprehensive Summary of Each Model's Key Points
Grok/xAI Report
Technical Analysis: Current price at $0.47, significantly above all moving averages, indicating a short-term uptrend but overbought conditions as indicated by an RSI of 89.93. Price is outside Bollinger Bands, signaling a likely correction. Market Sentiment: Positive sentiment due to altcoin rallies, but technical overextension suggests potential for profit-taking. Conclusion: Modestly bearish outlook with a strong probability (>70%) of a pullback. Recommend entering a short position at $0.47 with a stop-loss at $0.50 and take profit at $0.40. Claude/Anthropic Report
Technical Analysis: Similar findings with price at $0.47, overbought RSI (89.93), and significant distance from the upper Bollinger Band at $0.40 highlighting significant risk of pullback. Market Sentiment: Euphoric sentiment but warns of imminent reversals due to overextension. Conclusion: Aimed for a short position as well but with a different target and stop-loss placement. Proposes entry at $0.47, stop-loss at $0.52, and take-profit at $0.38. Gemini/Google Report
Technical Analysis: Affirms the bullish trend due to price above all MAs but highlights overbought RSI and Bollinger Bands indicating a need for caution. Market Sentiment: Positive altcoin movement correlating with Bitcoin, suggesting potential for continued growth but also warns of speculative dynamics. Conclusion: Encourages waiting for a pullback to $0.40 for a long entry. Proposed stop-loss at $0.38 and take-profit at $0.50, though leaning towards caution. DeepSeek Report
Technical Analysis: Price maintains a position significantly above moving averages, and the high RSI and Bollinger Band readings indicate potential price reversion. Market Sentiment: Euphoric market sentiment, though devoid of fundamental backing. Warns of the "dumb money" effect. Conclusion: Strongly bearish for shorting at $0.47, with a risk/reward ratio emphasizing potential gains from a mean reversion. Llama/Meta Report
Technical Analysis: Confirms high prices and overbought conditions similar to others, but suggests a cautiously optimistic bullish outlook. Market Sentiment: Positive sentiment detected, yet overbought conditions imply revisiting support before new longs are advisable. Conclusion: Proposes a long trade if a pullback to $0.40 occurs, but acknowledges an overall risk assessment opposing current long entries.
Areas of Agreement and Disagreement
Agreement:
All reports recognize the overbought conditions based on an RSI above 89 and significant price movements above key moving averages. Each model finishes with a recommendation for a bearish or cautious position acknowledging the likely impending correction. Disagreement:
The nature of the recommended trade (short vs. long) varies; Grok, Claude, and DeepSeek recommend shorting, whereas Gemini advocates waiting for a long position upon a pullback, and Llama suggests a similar cautious long entry. The specifics of stop-loss and take-profit levels also vary across reports, reflecting differences in perceived market volatility and risk management style.
Conclusion
Overall Market Direction Consensus: The market is broadly seen as moderately bearish due to extreme overbought conditions, despite the bullish price trends observed.
Recommended Trade:
Trade Direction: Short Entry Price: $0.47 Stop Loss Level: $0.50 Take Profit Level: $0.40 Position Size Recommendation: 1 lot (approximately 2,128 XLM contracts at 50x leverage, given a $10,000 account). Adjust based on personal risk tolerance. Confidence Level in Recommendation: 70% Key Risks and Considerations: Potential continued upward momentum due to market sentiment, volatility causing sharp movements, and correlation with major cryptocurrencies like Bitcoin. Strong monitoring during trade execution due to high slippage risk. Trade Entry Timing: Enter at market open.
TRADE_DETAILS (JSON Format) { "instrument": "XLM", "direction": "short", "entry_price": 0.47, "stop_loss": 0.50, "take_profit": 0.40, "size": 1, "confidence": 0.70, "entry_timing": "market_open" }
📊 TRADE DETAILS 📊 🎯 Instrument: XLM 📉 Direction: SHORT 💰 Entry Price: 0.47 🛑 Stop Loss: 0.5 🎯 Take Profit: 0.4 📊 Size: 1 💪 Confidence: 70% ⏰ Entry Timing: market_open
Disclaimer: This newsletter is not trading or investment advice but for general informational purposes only. This newsletter represents my personal opinions based on proprietary research which I am sharing publicly as my personal blog. Futures, stocks, and options trading of any kind involves a lot of risk. No guarantee of any profit whatsoever is made. In fact, you may lose everything you have. So be very careful. I guarantee no profit whatsoever, You assume the entire cost and risk of any trading or investing activities you choose to undertake. You are solely responsible for making your own investment decisions. Owners/authors of this newsletter, its representatives, its principals, its moderators, and its members, are NOT registered as securities broker-dealers or investment advisors either with the U.S. Securities and Exchange Commission, CFTC, or with any other securities/regulatory authority. Consult with a registered investment advisor, broker-dealer, and/or financial advisor. By reading and using this newsletter or any of my publications, you are agreeing to these terms. Any screenshots used here are courtesy of TradingView. I am just an end user with no affiliations with them. Information and quotes shared in this blog can be 100% wrong. Markets are risky and can go to 0 at any time. Furthermore, you will not share or copy any content in this blog as it is the authors' IP. By reading this blog, you accept these terms of conditions and acknowledge I am sharing this blog as my personal trading journal, nothing more.
PENGU Crypto Futures Trade Plan 2025-07-13PENGU Crypto Analysis Summary (2025-07-13)
Comprehensive Analysis of PENGU Cryptocurrency Trading Models
1. Summary of Each Model's Key Points
Grok/xAI Report:
Technical Indicators: Price above key moving averages indicating a bullish trend. However, the RSI is at 85.84, suggesting overbought conditions, and the price is touching the upper Bollinger Band. Resistance at $0.03 and support at $0.02. Market Sentiment: Bullish sentiment with recent price changes but signaling potential exhaustion. Direction: Moderately Bearish, recommending a short trade at $0.03, stop-loss at $0.031, and take-profit at $0.02.
Claude/Anthropic Report:
Technical Indicators: Similar to the Grok/xAI report, emphasizing the overbought RSI and position at the upper Bollinger Band. The price trend is recognized as unsustainable due to parabolic movement. Market Sentiment: Acknowledges extreme euphoria in recent gains and anticipates a potential correction. Direction: Moderately Bearish, suggesting a short position with entry at $0.03, stop-loss at $0.032, and a take-profit level targeting $0.025.
Gemini/Google Report:
Technical Indicators: Consistent with other reports, highlighting decent bullish momentum yet extremely overbought indicators signify imminent pullback risks. Market Sentiment: Observation of speculative rationales driving prices, highlighting risk factors in liquidity and broader market sentiment. Direction: Moderately Bearish; recommending a short trade with entry price at $0.03, stop-loss at $0.032, and take-profit at $0.025, sharing similar parameters with previous reports.
DeepSeek Report:
Technical Indicators: Emphasizes overbought conditions with a risk of a 20-40% correction. The current price is significantly above key averages, indicating parabolic action. Market Sentiment: Low funding rates indicate lopsided long positioning, foreseeing potential liquidation events. Direction: Strongly Bearish, supporting short position ideas with similar entry, stop-loss, and take-profit recommendations.
Llama/Meta Report:
Technical Indicators: Highlights resistance at the current price point and overbought indications based on RSI and Bollinger Bands metrics. Market Sentiment: Recognizes caution due to lack of news and low funding rates, suggesting potential for a reversal. Direction: Moderately Bearish; recommending a short position with similar parameters to the other reports.
2. Areas of Agreement and Disagreement Between Models
Agreement:
All models identify the price as overbought with an RSI above 85, signaling an imminent potential correction. A collective sentiment of caution prevails, leading to a recommendation for short trades given the exhaustion of the current bullish momentum. They recognize the price level at $0.03 as key resistance, along with suggesting a stop-loss around $0.031 to $0.032 and a take-profit around $0.025.
Disagreement:
The Grok/xAI report emphasizes a “Moderately Bearish” sentiment where others like DeepSeek classified the trend as “Strongly Bearish.” Some reports recommend modest leverage (50x), while others suggest higher leverage (up to 100x).
3. Conclusion
Overall Market Direction Consensus: The consensus among all models is a Moderately to Strongly Bearish outlook for PENGU, backed by overbought technical indicators and recent rapid price increases without fundamental support.
Recommended Trade:
Trade Direction: Short Entry Price/Range: $0.03 Stop Loss Level: $0.0315 (offering a buffer against outlier volatility) Take Profit Level: $0.025 Position Size Recommendation: Based on account size, aiming for a maximum risk of 1% per trade (e.g., 1 contract for a $100 account). Adjust size appropriately for larger accounts. Confidence Level in Recommendation: 0.70 (overall strength of indicators). Key Risks and Considerations: Risks include further bullish momentum despite technical indicators, potential slippage in volatile conditions, and market liquidity constraints. High leverage could amplify losses. Trade Entry Timing: Enter at market open.
TRADE_DETAILS (JSON Format)
{ "instrument": "PENGU", "direction": "short", "entry_price": 0.030, "stop_loss": 0.0315, "take_profit": 0.025, "size": 1, "confidence": 0.70, "entry_timing": "market_open" }
This concise trade plan consolidates insights from various analyses, aligning on key indicators and market sentiment to create a robust trading strategy for PENGU.
📊 TRADE DETAILS 📊 🎯 Instrument: PENGU 📉 Direction: SHORT 💰 Entry Price: 0.03 🛑 Stop Loss: 0.0315 🎯 Take Profit: 0.025 📊 Size: 1 💪 Confidence: 70% ⏰ Entry Timing: market_open
Disclaimer: This newsletter is not trading or investment advice but for general informational purposes only. This newsletter represents my personal opinions based on proprietary research which I am sharing publicly as my personal blog. Futures, stocks, and options trading of any kind involves a lot of risk. No guarantee of any profit whatsoever is made. In fact, you may lose everything you have. So be very careful. I guarantee no profit whatsoever, You assume the entire cost and risk of any trading or investing activities you choose to undertake. You are solely responsible for making your own investment decisions. Owners/authors of this newsletter, its representatives, its principals, its moderators, and its members, are NOT registered as securities broker-dealers or investment advisors either with the U.S. Securities and Exchange Commission, CFTC, or with any other securities/regulatory authority. Consult with a registered investment advisor, broker-dealer, and/or financial advisor. By reading and using this newsletter or any of my publications, you are agreeing to these terms. Any screenshots used here are courtesy of TradingView. I am just an end user with no affiliations with them. Information and quotes shared in this blog can be 100% wrong. Markets are risky and can go to 0 at any time. Furthermore, you will not share or copy any content in this blog as it is the authors' IP. By reading this blog, you accept these terms of conditions and acknowledge I am sharing this blog as my personal trading journal, nothing more.

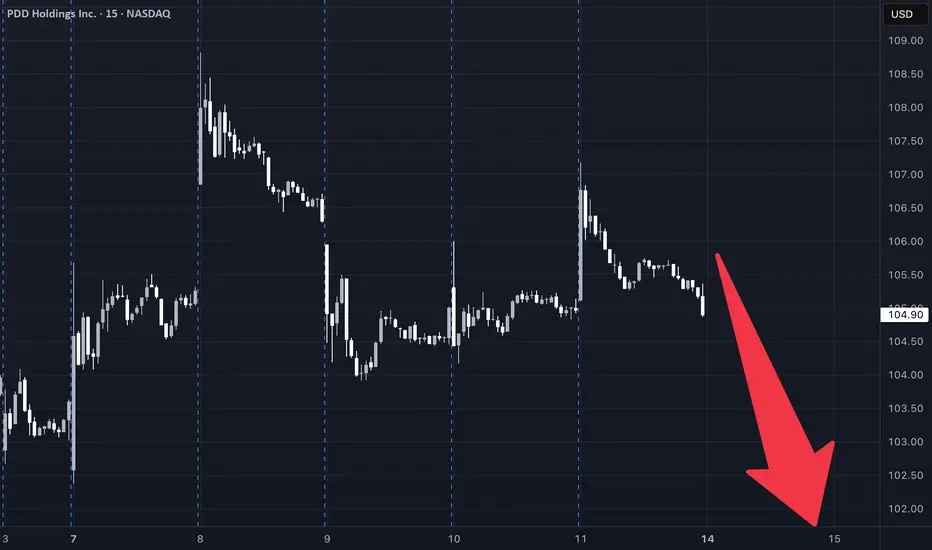
PDD Stock Trading Plan (2025-07-12)PDD Stock Trading Plan (2025-07-12)
Final Trading Decision
1. Comprehensive Summary of Each Model's Key Points
DS Report
Technical Analysis: Price: Currently at $104.91, facing short-term bearish pressures with significant support at $104.83. Indicators: Short-term indicators (30-min) show bearish signals, while daily indicators hint at a potential bullish reversal (e.g., MACD bullish divergence). Sentiment: Mixed headlines with a stable VIX suggest a favorable but cautious entry environment. Trade Strategy: Long with a target of $108.70 and stop loss at $104.10 based on recent support levels.
LM Report
Technical Analysis: Price: Above the long-term bullish trend but facing near-term resistance. Indicators: Neutral RSI levels do not suggest a clear direction. MACD shows some signs of hesitance. Sentiment: Slightly bullish due to institutional flows and a falling VIX but lacks strong conviction. Trade Strategy: Suggests a long position at $105.50, with a profit target of $113.64.
GK Report
Technical Analysis: Describes a neutral situation with prices around key EMAs and exhibiting consolidation. Weak momentum signals indicate uncertainty regarding outright positions. Sentiment: Highlights mixed news with both bullish and bearish implications. Trade Strategy: Recommends not to trade due to the unclear directional bias.
CD Report
Technical Analysis: Confirms short-term bearish momentum with price below moving averages and mixed momentum indicators. Suggests a moderately bearish sentiment based on resistance levels. Sentiment: Slightly positive VIX implies stability; however, recent call volumes show mixed institutional sentiment. Trade Strategy: Strong short position recommended to profit from resistance at $105.70.
2. Areas of Agreement and Disagreement
Agreement:
Most models agree on near-term bearish indicators (e.g., weak momentum, mixed MACD signals across timeframes). Multiple reports note the importance of the $104.30-$106.20 price range as critical support/resistance.
Disagreement:
Long vs. Short Positions: DS and LM suggest potential long positions based on technical rebounds, while CD firmly recommends a short position anticipating downward movement. Market Sentiment: Some models see potential bullish opportunities in VIX stability and call volume, while others express caution due to mixed signals.
3. Conclusion and Recommendations
Overall Market Direction Consensus
The market is in a neutral to moderately bearish state based on the conflicting signals from the models. The current indicators do not suggest a strong bullish trend, while technical analysis indicates possible downward momentum.
Recommended Trade
Direction: Short Position Entry Price: $104.90 at market open. Stop Loss: $106.20 (1.2% loss). Take Profit: $102.50 (2.3% gain). Position Sizing: Based on a $10,000 account with a 2-3% risk tolerance, risking approximately $100-$120 total. Holding Period: 3-4 weeks maximum. Confidence Level: 65% based on resistance rejection and mixed sentiment.
Key Risks and Considerations
Risk of a market reversal if bullish news arrives or a strong institutional buying momentum occurs. Close monitoring of technical indicators is required, particularly the MACD and RSI, as conditions shift either direction could warrant position adjustments.
TRADE_DETAILS (JSON Format)
{ "instrument": "PDD", "direction": "short", "entry_price": 104.90, "stop_loss": 106.20, "take_profit": 102.50, "size": 200, "confidence": 0.65, "entry_timing": "open" }
📊 TRADE DETAILS 📊 🎯 Instrument: PDD 📉 Direction: SHORT 💰 Entry Price: 104.9 🛑 Stop Loss: 106.2 🎯 Take Profit: 102.5 📊 Size: 200 💪 Confidence: 65% ⏰ Entry Timing: open
Disclaimer: This newsletter is not trading or investment advice but for general informational purposes only. This newsletter represents my personal opinions based on proprietary research which I am sharing publicly as my personal blog. Futures, stocks, and options trading of any kind involves a lot of risk. No guarantee of any profit whatsoever is made. In fact, you may lose everything you have. So be very careful. I guarantee no profit whatsoever, You assume the entire cost and risk of any trading or investing activities you choose to undertake. You are solely responsible for making your own investment decisions. Owners/authors of this newsletter, its representatives, its principals, its moderators, and its members, are NOT registered as securities broker-dealers or investment advisors either with the U.S. Securities and Exchange Commission, CFTC, or with any other securities/regulatory authority. Consult with a registered investment advisor, broker-dealer, and/or financial advisor. By reading and using this newsletter or any of my publications, you are agreeing to these terms. Any screenshots used here are courtesy of TradingView. I am just an end user with no affiliations with them. Information and quotes shared in this blog can be 100% wrong. Markets are risky and can go to 0 at any time. Furthermore, you will not share or copy any content in this blog as it is the authors' IP. By reading this blog, you accept these terms of conditions and acknowledge I am sharing this blog as my personal trading journal, nothing more.
META Platforms Long Setup – Ready for the Next Move?💣 META Masterplan: Bullish Break-In Activated! 💼📈
🌟Hi! Hola! Ola! Bonjour! Hallo!🌟
Dear Money Makers & Silent Strategists, 🤑💰💸✈️
We’ve locked in on our next high-value digital vault: META Platforms Inc.
Built on our signature Thief Trading Style™ — where fundamentals meet stealth technical precision — this is your map to the bullish jackpot.
📍 ENTRY PLAN – Door’s Unlocked!
✅ Enter at any level — this heist is already in motion.
OR
🎯 Set your Buy Limit on a 15m/30m swing low or high — classic pullback infiltration.
🛑 STOP LOSS – Your Exit Route
Before breakout? Hold the line.
After breakout? Drop your SL at the recent 4H swing low – and size it to your risk appetite.
This isn’t luck — it’s calculated theft. 🔐
🎯 TARGET ZONE – Grab & Vanish
🎯 Aim: 770.00
But if the cops (aka sellers) show up early, get out with your loot — no shame in a clean getaway.
“Profit is the win. Perfection is fantasy.”
⚡ SCALPERS' TIPS – Quick In & Out
💵 Big wallet? Enter now.
💳 Tight budget? Follow the swing team.
Either way — longs only, and trailing SL is your safety rope.
📊 WHY META? – Intel Behind the Mission
🔍 This plan is reinforced by:
🔥 Strong Fundamentals
📈 Sentiment Signals
🧠 Quantitative + Macro Flow
💼 COT Data
🌐 Intermarket Correlations
It’s all aligning — the pressure’s building, and the breakout door is creaking open...
🚨 TRADING ALERT – Stay Outta Trouble
💥 Avoid placing new trades during major news drops.
🎯 Use trailing SL to protect and lock profits — your getaway vehicle must be ready.
💖 Support the Heist? Smash Boost!
Fuel the mission — every Boost empowers the crew.
This is Thief Trading Style — we don’t chase, we plan, strike, and vanish with the win. 🏆💪🐱👤
📡 Another breakout mission incoming. Stay hidden. Stay profitable. 🤑🚀

“GER30 Bull Vault Heist: The Ultimate Loot Plan”💎“The Bull Vault Job: GER30 Heist Blueprint”💎
🌟Hi! Hola! Ola! Bonjour! Hallo! Marhaba!🌟
Welcome fellow Chart Raiders & Market Hackers 🧠💰—your next mission is here.
We’re pulling off a precision breakout plan on GER30 / DE30 "Germany30" — a market vault bursting with bullish loot. This isn’t just trading... this is Thief Trading Style™ — where smart analysis meets slick execution. 👨💻💎📊
💼 The Heist Plan:
📈 Entry: Market shows a wide open vault. Ideal long setups near the last swing low (15–30m for sniper entries). Don’t chase—wait for the retrace.
🛑 Stop Loss: Guard your getaway! Use recent swing lows on 4H (e.g. 24170). Customize based on your risk profile & lot sizes.
🎯 Target: Aim for 24720 or EXIT before the cops (a.k.a. reversal zones) show up. Always secure your gains.
📌 Scalpers’ Signal: Stay LONG-only. Follow swing traders if low on ammo (capital). Use trailing SLs like tripwires to protect your profits.
📊 Market Heat Check: The DE30 is radiating bullish pressure 💥—fueled by fundamentals, macro trends, COT positions, sentiment indicators, and intermarket clues. We read between the lines. You just follow the blueprint. 🧠
🚨 Pro Tips:
Avoid entering trades during high-impact news.
Manage risk like a vault door—solid, tested, and ready.
💖 Smash that Boost Button 💖 if you believe in the Art of Legal Market Extraction™ — it supports the plan, strengthens the crew, and keeps this hustle alive!
🎭 More blueprints & breakdowns coming soon. Stay locked in...
Until the next market hit, trade sharp, trade smart. 🐱👤📈💰

PENGU = ETF Catalyst + Whale Accumulation = +30% More Upside?Today, on the weekend, I want to analyze the Pudgy Penguins project with the PENGU ( BINANCE:PENGUUSDT ) token from a fundamental and technical perspective .
Please stay with me.
Why did PENGU surge nearly 40% in just 48 hours? Here’s what’s driving it:
------------------------------------------
Fundamental Analysis:
1. ETF Momentum via Cboe:
On June 26, Cboe officially filed a 19b-4 form for a new ETF that includes Pudgy Penguins and PENGU as major components.
Although not yet approved, this single move has fueled strong institutional anticipation, similar to what happened with Bitcoin ETFs in early 2023.
The market often prices in future narratives — and this ETF storyline has been a powerful one.
2.Whale Accumulation Signals
According to Nansen data, large holders have increased their balances by 11.37%, and notable wallets linked to public figures by 7% over the last 30 days.
Such coordinated accumulation often precedes major price moves, and that pattern seems to be repeating here.
3.NFT Ecosystem Boost
The Pudgy Penguins NFT collection saw a 400%+ surge in sales volume.
This sharp increase in NFT activity has reignited attention toward the broader Pudgy ecosystem, which naturally benefits its native token, PENGU.
Risk Note:
The ETF is not yet approved — we're still in the hype phase.
Volatility remains high, and strong pullbacks are common in low-liquidity tokens like PENGU.
If whale activity continues and institutional narratives grow, the upside potential remains — but so does the downside risk.
------------------------------------------
PENGU token started to rise from the Support zone($0.01-$0.0076) . One of the signs of a continuation of the uptrend was the break of the upper line of the descending channel .
Educational Note: One of the price targets after a channel break can be as wide as the width of the broken channel.
In terms of Elliott Wave theory , it seems that the PENGU token has completed the Double Three Correction(WXY) , and we can wait for the next impulsive waves .
I expect the PENGU token to attack the Resistance zone($0.0128-$0.0118) again, and if this zone is broken , it can increase to at least $0.0137(+30%) .
What is your idea about the Pudgy Penguins project?
Note: If the PENGU token drops below $0.01, we can expect a break of the Support zone($0.01-$0.0076).
Please respect each other's ideas and express them politely if you agree or disagree.
Pudgy Penguins Analyze (PENGUUSDT), 4-hour time frame.
Be sure to follow the updated ideas.
Do not forget to put a Stop loss for your positions (For every position you want to open).
Please follow your strategy and updates; this is just my Idea, and I will gladly see your ideas in this post.
Please do not forget the ✅' like '✅ button 🙏😊 & Share it with your friends; thanks, and Trade safe.

Fundamental Analysis XAUUSD Gold X📈 Direction 🎯 Next Target
**Bullish** **\$3,385 → \$3,400** (if support holds and news aligns)
**Bearish Pullback** **\$3,322 → \$3,306** (if USD strengthens due to strong data or Fed hawkish tone)

"COTTON CFD HEIST: Bullish Loot Before the Trap!"🔥 COTTON CFD HEIST: Bullish Loot & Escape Before the Trap! 🚨💰
🌟 Attention Market Robbers & Profit Pirates! 🌟
(Hola! Bonjour! Hallo! Marhaba!)
🔎 Strategy Based on THIEF TRADING ANALYSIS (Technical + Fundamental):
We’re staging a bullish heist on the 🧵 COTTON CFD market—time to grab the loot and exit before the bears ambush us near the Dangerous Red Zone (key resistance). Overbought? Maybe. A trap? Likely. But thieves don’t overstay—we escape with profits!
📌 ENTRY (Bullish Vault is Open!):
"SWIPE THE LOOT!" – Buy at current price OR set buy limits (15m/30m pullbacks).
Pro Tip: Strong hands enter now; cautious robbers wait for dips.
⛔ STOP LOSS (Safety Net):
Thief’s Rule: Set SL below nearest 4H swing low wick (~65.00).
Adjust based on your risk tolerance & position size.
🎯 TARGETS (Escape Routes):
Take Profit @ 68.50
Bail early if momentum fades! (Don’t be greedy—real thieves lock in gains.)
⚡ SCALPERS NOTE:
Longs only! Use trailing stops to protect profits.
No money? Join swing traders—this heist is teamwork!
📢 FUNDAMENTAL BACKUP:
Bullish drivers: COT Report, Macro Trends, Geopolitics, Seasonals.
Full analysis herre: 👉🔗 🌍📊
🚨 TRADING ALERTS:
News = Volatility! Avoid new trades during high-impact events.
Trailing SLs save heists. Lock profits before the market turns.
💥 BOOST THIS PLAN → STRONGER ROBBERY SQUAD → MORE GAINS!
(Like & Share to help us steal the market’s money daily! 🏴☠️💸)
Next heist coming soon—stay tuned, thieves! 🤫🚀

Ready to Raid the Chunnel? EUR/GBP Bullish Strategy Unveiled!🔥🤑 "THE CHUNNEL HEIST: EUR/GBP BULLISH LOOTING SEASON!" 🏴☠️💸
🌟 Greetings, Market Pirates & Profit Bandits! 🌟
(Hi! Hola! Ola! Bonjour! Hallo! Marhaba!)
Based on the 🚨THIEF TRADING STYLE🚨 (a ruthless mix of technical & fundamental analysis), we’re plotting a major heist on EUR/GBP "The Chunnel"—time to LOOT THE BULLS!
🚨 HEIST BLUEPRINT (LONG ENTRY) 🚨
🎯 Escape Zone: High-risk RED MA Zone (Overbought? Reversal? Trap? Bears lurking? Cops are waiting!).
🏆 Take Profit & Run! You’ve earned it, outlaw! 💰🔥
🔓 ENTRY: "VAULT IS OPEN—SWIPE THE BULLISH LOOT!" after the breakout
Pullback Entry near the Moving average @0.84850
Buy Limit Orders preferred (15-30min timeframe).
Swing Low/High Pullbacks = Perfect Stealth Entry.
⛔ STOP LOSS (SL): "DON’T GET CAUGHT!"
📍 Thief SL: Recent swing low (4H timeframe) @ 0.84000 (Scalping/Day Trade Basis).
⚠️ Adjust based on your risk, lot size & multiple orders!
🎯 TARGET: 0.85850 (OR ESCAPE EARLY IF HEAT’S ON!)
📢 WHY THIS HEIST? (BULLISH CATALYSTS)
💥 EUR/GBP is BULLISH—backed by:
Fundamentals (COT Report, Macro Data)
Sentiment & Intermarket Trends
Quantitative Edge (Check out for full intel! 👉🌎🔗)
🚨 TRADING ALERT: NEWS = DANGER ZONE!
📉 Avoid New Trades During High-Impact News!
🔒 Use Trailing Stops—Lock profits, evade volatility traps!
💥 BOOST THIS HEIST! (SUPPORT THE MISSION)
🔥 Hit the "LIKE" & "BOOST" button—strengthen our Profit Robbery Squad!
🤑 Daily Market Heists = Easy Money (Thief Trading Style FTW!)
Stay tuned for the next heist plan! 🚀🐱👤💖

ADA/USD Thief Trading Plan – Bullish Snatch & Run!🚨 ADA/USD HEIST ALERT! 🚨 – Bullish Loot Grab Before the Escape! (Thief Trading Strategy)
🌟 Greetings, Market Pirates & Profit Raiders! 🌟
🔥 THIEF TRADING STRIKES AGAIN! 🔥
💎 The Setup:
Based on our stealthy technical & fundamental heist tactics, ADA/USD is primed for a bullish loot grab! The plan? Long entry with an escape near key resistance. High-risk? Yes. Overbought? Maybe. But the heist must go on!
🎯 Key Levels:
📈 Entry (Vault Cracked!) → Swipe bullish positions on pullbacks (15m-30m precision).
🛑 Stop Loss (Escape Route) → Recent swing low (4H basis) at 0.5290 (adjust per risk!).
🏴☠️ Target (Profit Snatch!) → 0.6500 (or bail early if bears ambush!).
⚡ Scalpers’ Quick Heist:
Only scalp LONG!
Big wallets? Charge in! Small stacks? Ride the swing!
🔐 Lock profits with Trailing SL!
📢 Breaking News (Heist Intel!):
Fundamentals, COT, On-Chain, Sentiment— All hint at bullish momentum!.
🚨 ALERT! News volatility ahead—Avoid new trades during releases! Secure running positions with Trailing SL!
💥 BOOST THIS HEIST! 💥
👉 Hit LIKE & FOLLOW to fuel our next market robbery! 🚀💰
🎯 Profit taken? Treat yourself—you earned it!
🔜 Next heist incoming… Stay tuned, pirates! 🏴☠️💎

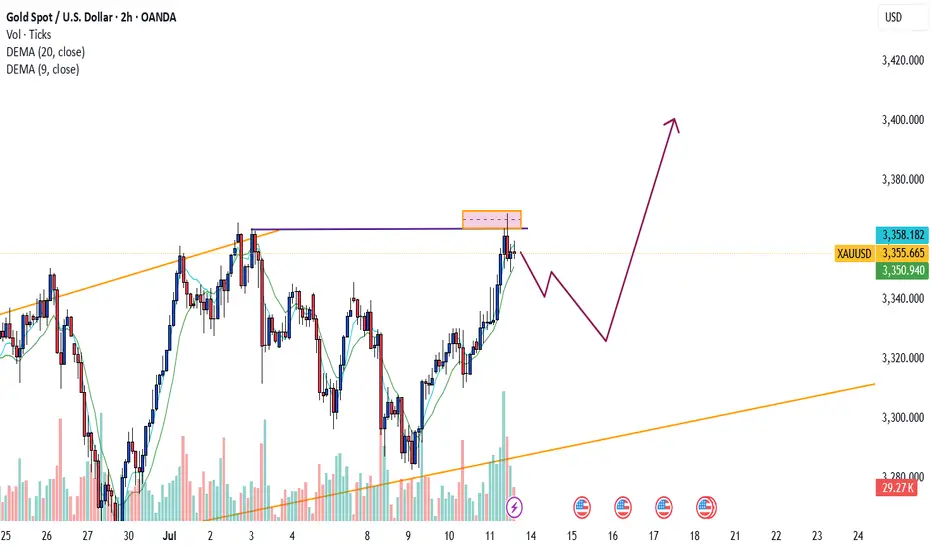
GOLD MARKET ANALYSIS AND COMMENTARY - [Jul 14 - Jul 18]This week, OANDA:XAUUSD opened at $3,342/oz, dropped to $3,282/oz, but then rebounded sharply to close at $3,355/oz. The recovery was mainly driven by former President Trump's announcement of new tariffs ranging from 20% to 50% on imports from 22 countries, effective August 1st. Particularly, a 35% tariff on Canadian goods — a key U.S. trading partner — raised concerns about global trade stability and supply chains.
Trump also proposed 15–20% tariffs on most other trading partners, reigniting fears of global trade disruptions. At the same time, ongoing conflict between Israel and Hamas continued to weigh on sentiment, despite U.S. diplomatic efforts showing little progress.
However, analysts note that gold still lacks strong momentum for a breakout. Trump's tariff threats may be more about negotiation leverage than triggering a full-blown trade war. Meanwhile, with the labor market recovering and inflation rising, the Fed is expected to maintain its neutral monetary policy, limiting short-term gold price movements.
Although geopolitical tensions remain (e.g., Russia-Ukraine, Israel-Hamas), the ceasefire between Israel and Iran has reduced gold’s geopolitical risk premium.
Looking ahead, key U.S. economic data next week — including CPI, PPI, and retail sales — will be closely watched. A strong June core CPI (0.4% or higher) could reduce the likelihood of a Fed rate cut in September, strengthening the USD and pushing gold lower. Conversely, weaker inflation data could boost expectations of a rate cut, supporting gold prices.
📌In terms of technical analysis, gold prices next week may continue to adjust and accumulate. Accordingly, if they surpass the 3,370 USD/oz mark, gold prices next week will challenge the 3,400-3,450 USD/oz range. On the contrary, gold prices next week will adjust down to 3,285 USD/oz, or even 3,245 USD/oz.
Notable technical levels are listed below.
Support: 3,350 – 3,310 – 3,300USD
Resistance: 3,371 – 3,400 – 3,430USD
SELL XAUUSD PRICE 3435 - 3433⚡️
↠↠ Stop Loss 3439
BUY XAUUSD PRICE 3329 - 3331⚡️
↠↠ Stop Loss 3326

GOLD Under RadarIts testing some zone of interest , we wait for the retracement and we take the long position as soon as the bearish candlsticks finish their , momve,ent
LINK/USDT - SHORT/LONGI expect the movement to be implemented in about a month.
(Not an investment recommendation).

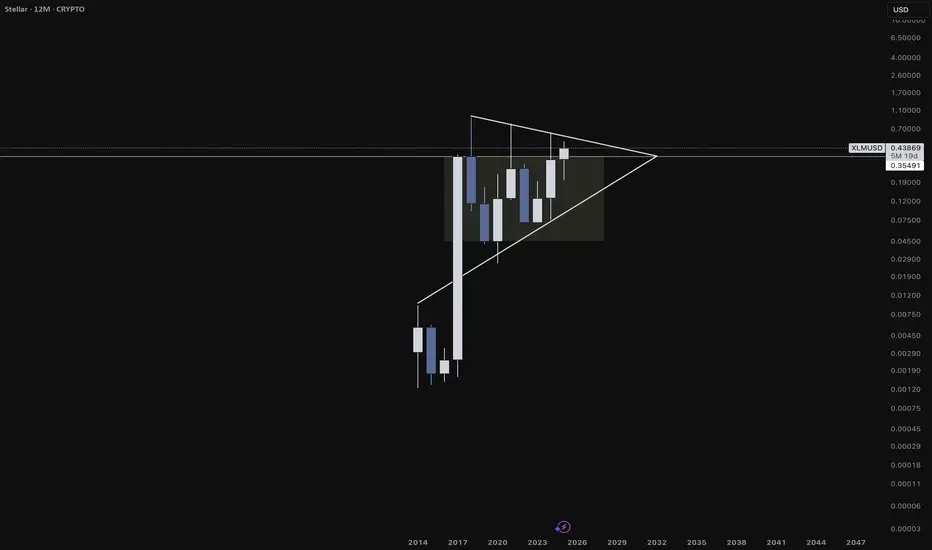
Here's Why XLM is on the Verge of a Massive breakoutThe next 10 years of success for the Stellar Network (XLM) are being shaped by decisions, developments, and trends happening right now (2024–2025). Here’s a breakdown of the long-term shaping factors currently in motion that will influence Stellar's trajectory through 2035:
------------
🌍 1. Real-World Use Cases Being Built Now
Stellar is not waiting for hypothetical adoption — it’s already deploying use cases that are foundational to its future success.
Examples:
MoneyGram Access gives real people the ability to cash in/out of crypto in over 180 countries.
USDC on Stellar enables stablecoin remittances with instant settlement and low fees.
Stellar Aid Assist provides governments and NGOs a working model for humanitarian digital cash aid.
Long-Term Impact: Building trust and infrastructure in the real world now means exponential network effects later — especially in emerging markets where crypto utility > speculation.
-------------------------------------------------------------------------------------------
🛠️ 2. Soroban (Smart Contracts) Rollout
Stellar is rolling out Soroban, a Rust-based smart contract platform that will transform the network into a programmable blockchain.
Why Soroban is Important:
Enables DeFi, lending, NFTs, on-chain identity, and DAOs.
Designed for predictable gas fees, making it ideal for finance and compliance.
Makes Stellar more competitive with Ethereum, Solana, Avalanche, etc.
Long-Term Impact: Soroban turns Stellar into a platform where real, decentralized applications can live — critical for long-term value capture and developer retention.
-------------------------------------------------------------------------------------------
🌐 3. Laying Global Payment Infrastructure
Stellar is quietly building global payment rails through partnerships with:
Fintechs (MoneyGram, Leaf, Settle, Cowrie)
Stablecoin issuers (Circle for USDC, Novatti for AUDC)
Payment aggregators in Africa, Latin America, Southeast Asia
Long-Term Impact: By 2030, these partnerships could evolve into a globally interconnected network of on/off ramps, anchors, and stablecoins. This gives Stellar real utility far beyond speculation.
-------------------------------------------------------------------------------------------
🏛️ 4. Regulatory Alignment & Compliance Tooling
The Stellar Development Foundation (SDF) is heavily involved in regulatory dialogue, including:
Working with the BIS Innovation Hub and IMF working groups
Building on-chain compliance tools (e.g. KYC/AML anchor guidelines)
Developing the Stellar Disbursement Platform, which complies with aid distribution requirements
Long-Term Impact: As crypto becomes more regulated, networks that built with compliance in mind will thrive. Stellar is positioning itself as a compliant blockchain for finance, especially for governments and NGOs.
-------------------------------------------------------------------------------------------
💸 5. Tokenization of Real-World Assets (RWAs)
The future of blockchain is heading toward tokenizing everything — and Stellar is already positioning itself at the front of that movement.
Franklin Templeton tokenized a U.S. mutual fund on Stellar.
Stablecoins like USDC and native fiat tokens are in active use.
Discussions are ongoing around CBDC pilots and tokenized bonds.
Long-Term Impact: The network that supports the most trusted tokenized assets — from CBDCs to real estate to securities — will gain enormous value from volume and liquidity. Stellar is in that conversation now.
-------------------------------------------------------------------------------------------
🧠 6. Mission-Aligned Ecosystem Funding
The Stellar Development Foundation holds billions of dollars in XLM and is using it to:
Fund early-stage startups building on Stellar
Run accelerator programs and hackathons
Expand into new regional markets (Africa, Asia, LATAM)
Long-Term Impact: Unlike many ecosystems that fizzle due to lack of funding or misaligned VC interests, Stellar has long-term strategic capital to guide the network toward its mission of financial access.
-------------------------------------------------------------------------------------------
🔐 7. Security, Speed, and Simplicity
From day one, Stellar has prioritized:
Fast block finality (~5 seconds)
Very low fees (< $0.001)
Energy-efficient consensus (SCP – Stellar Consensus Protocol)
These strengths are especially important for high-volume, low-margin applications like:
Micropayments
Remittances
Real-time settlements
Tokenized wages and aid
Long-Term Impact: As the blockchain infrastructure layer for finance matures, efficient networks will dominate. Stellar’s technical foundation makes it a sustainable long-term option.
-------------------------------------------------------------------------------------------
🧭 8. Stellar’s Focused, Long-Term Vision
SDF’s mission isn’t to be “just another smart contract chain” — it’s to improve access to equitable financial services, especially in underbanked regions.
That vision is:
Clear
Consistent
Attractive to partners, governments, and NGOs
Long-Term Impact: Clarity of mission = better talent, partners, funding, and resilience during market cycles.
-------------------------------------------------------------------------------------------