PLTR - Palantir Technologies: Why PLTR is the Perfect PlayExceptional Performance Leadership
Palantir Technologies has established itself as the undisputed champion of the U.S. stock market in 2025. The stock has delivered extraordinary returns of 402.92% over the past 12 months and 87.89% year-to-date, making it the best-performing stock in both the S&P 500 and Nasdaq-100 indices. Currently trading at $142.10, the stock has surged from lows around $21, representing one of the most dramatic momentum plays in modern market history.
Powerful AI-Driven Revenue Growth
The company's financial performance has been nothing short of spectacular. Palantir's U.S. commercial AIP (Artificial Intelligence Platform) revenue has surpassed a $1 billion annual run rate with 71% year-over-year growth. The company reported Q1 2025 revenue of $883.86 million, beating consensus estimates and growing 39% year-over-year. This growth trajectory is being driven by unprecedented demand for AI solutions across both commercial and government sectors.
The company's customer base has expanded to 769 total customers, up 39% year-over-year, with 44% of revenue now coming from commercial clients. This diversification away from pure government dependency represents a significant strategic achievement that provides multiple growth vectors.
Strategic Government AI Dominance
Maven Smart System Contract Expansion
Palantir's government business has reached new heights with its Maven Smart System contract being increased by $795 million, bringing the total value to over $1.3 billion through 2029. Pentagon leaders boosted the contract citing "growing demand" for the system across all military branches, including the Army, Navy, Air Force, Space Force, and Marine Corps.
Stargate AI Initiative Leadership
The company holds a central position in the $500 billion Stargate AI infrastructure project, positioning it as a backbone for America's AI future. This initiative represents one of the largest technological undertakings in U.S. history, designed to establish domestic AI superiority and reduce reliance on foreign systems.
Strategic Partnerships
Palantir has formed landmark partnerships with Microsoft for classified AI deployment and Accenture Federal Services for comprehensive government AI implementation. These alliances significantly expand the company's reach and delivery capabilities across the federal ecosystem.
Technical Momentum Confirmation
Bullish Technical Setup
The stock exhibits exceptional technical strength with multiple confirmation signals:
Moving Average Alignment : All major moving averages (20-day, 50-day, 200-day) are positioned bullishly below the current price, indicating sustained upward momentum
RSI Positioning: At 58.42, the RSI shows healthy momentum without being overbought, providing room for continued advancement
Volume Confirmation: Recent trading volumes have consistently exceeded 50 million shares daily, indicating strong institutional participation
Golden Cross Pattern: The 50-day moving average at $131.9 remains above the 200-day moving average at $101.7, confirming the bullish trend
Breakout Pattern
The stock has successfully broken above the $140 resistance level with strong volume, targeting the $175-$220 range based on technical analysis. The pennant pattern breakout above $140 has been confirmed by institutional buying pressure and retail momentum.
Institutional Investment Surge
Record Institutional Participation
Institutional ownership has reached 45.65% of outstanding shares, with $19.19 billion in institutional inflows over the past 12 months versus only $10.43 billion in outflows. This represents a net institutional buying pressure of nearly $9 billion, demonstrating strong professional investor confidence.
Premium Analyst Coverage
Wedbush Securities has raised its price target to $160, calling Palantir the "Messi of AI" and positioning it as a top pick in their "IVES AI 30" list. The firm sees Palantir's AIP platform as foundational for the trillion-dollar AI spending wave and believes the company has a "golden path to become the next Oracle".
Competitive Advantages and Market Position
Architecture-Agnostic Platform
Palantir's AIP is architecture-agnostic, seamlessly integrating with both centralized cloud systems and decentralized frameworks. This versatility allows the company to serve diverse client needs across multiple sectors, from government defense to commercial healthcare.
Network Effects and Data Flywheel
The company benefits from powerful network effects where more customers generate more data, which improves AI models and increases retention rates. This creates a self-reinforcing competitive advantage that becomes stronger over time.
Government Moats
Palantir's deep government relationships and security clearances create substantial barriers to entry. Multi-year government contracts provide revenue stability and growth visibility that few technology companies can match.
Financial Strength and Profitability
The company has demonstrated seven consecutive quarters of GAAP profitability with expanding margins. Adjusted operating margins have improved to 36% in Q1 2025 from 29% previously, showing operational excellence alongside revenue growth. The company maintains a strong balance sheet with $4 billion in cash and equivalents.
Investment Thesis Summary
Palantir Technologies represents the perfect convergence of momentum, fundamentals, and catalysts that defines exceptional investment opportunities:
Momentum Factors:
402.92% twelve-month returns leading all major indices
Continuous institutional accumulation with $9 billion net inflows
Technical breakout above key resistance with volume confirmation
Fundamental Catalysts:
$1 billion+ AIP commercial revenue run rate with 71% growth
$1.3 billion+ government contract pipeline expansion
Central role in $500 billion Stargate AI infrastructure initiative
Strategic Positioning:
Architecture-agnostic platform creating multiple market opportunities
Government relationships providing defensive moats and growth visibility
Network effects and data flywheel creating competitive advantages
Risk-Adjusted Opportunity:
Clear support levels at $137-$140 range providing defined risk parameters
Multiple price targets ranging from $155-$220 suggesting significant upside potential
Strong balance sheet and cash generation providing downside protection
Palantir Technologies embodies the rare combination of explosive growth, defensive positioning, and strategic importance that creates generational investment opportunities. The company's leadership in AI government applications, combined with accelerating commercial adoption, positions it as a cornerstone holding for the AI revolution.
Fundamental Analysis

Buy this stock if you want to get burnedThis isn't going to be a V shaped recovery y'all. Another leg down is on the way.

Next target for the legendary Bitcoin: $143,000🚀 Keep buying the dips all the way to the top.
📈 Algo traders: lock your EAs on LONG.
Need one? Check the link in my bio 😉
#Bitcoin #CryptoTrading #BTC143K #BuyTheDip #AlgoTrading #EAs

BTC Forecast: CPI Trap or Liquidity Sweep?Powered by Advanced Time-Price Analysis | Dr.Gemy | Digital Gann Strategy
Using Time Cycles, IPDA logic, and Digital Gann structure, the upcoming week for Bitcoin is setting up for a high-probability liquidity event, especially with high-impact macro data scheduled.
📍In the next 18 hours, we expect a short-term correction toward the 115,911 USD zone.
---
⏰ CPI (Tuesday) & PPI (Wednesday) = catalysts for smart money traps.
I expect a textbook liquidity hunt around the inflation data window.
Time is more important than price.
🔮 Two Critical Scenarios Unfolding:
✅ Scenario 1 – CPI Trap Setup (Tuesday News Play)
🕒 If BTC continues correcting into Tuesday (July 15), targeting 113,724 USD, this will align perfectly with the release of U.S. CPI (Inflation) data at 3:30 PM GMT+3.
📈 A fake bullish breakout above 118,098 USD could follow, luring retail traders with an inflation-driven spike, only to be reversed sharply to collect liquidity around 111,537 USD.
🧠 CPI y/y forecast is 2.6% vs 2.4% prior – higher inflation could spark temporary bullish reaction, but the underlying setup suggests it's a trap.
---
🎭 Scenario 2 – Smart Money Pump and Dump
📈 BTC might front-run expectations with an early week rally to retest 118,098 USD, only to reverse midweek (around Wednesday's PPI release) as the market reacts to deeper macro data and shifting dollar strength.
💣 Downside continuation could sweep below 113,724 USD, ultimately reaching the key demand base at 111,537 USD, which marks the beginning of the last major impulsive move.
---
🧠 Strategic Concepts Used:
Time Fractals (9H Cycle Lines)
Gann Reversal Timing & Breaker Blocks (H4)
Smart Money Traps around News
IPDA Voids & Liquidity Pools
CPI/PPI/Macro Liquidity Zones
#CryptoForecast #BTCUSD #CPIWeek #GannTiming #SmartMoney #LiquiditySweep #IPDA #ForexStyleCrypto #DigitalGann #DrGemy

GIS to $100 by 2030?Looking at the previous chart patterns and RSI indicator, I am going to be looking for a reversal around the $55.00 level.
This could be a great opportunity to get into a long term position with huge upside potential.
The RSI looks very similar now, to how it did in December of 2018 when it went into an uptrend.
TP1 $60
TP2 $70
TP3 $90
I am mostly posting this so I can look back on my theories and see how I can improve on my trading strategies. Please leave your feedback below, thank you.

🐋 Deep Dive Part II: Whale Behavior & Market Mastery! 🌊📚Hey Crypto Enthusiasts! 🚀
In a recent analysis, I not only nailed Bitcoin's (BTC) movement but also illuminated the subsequent altcoin surge, driven by insightful whale behavior observations. Let's merge these insights with a focus on ADA (Cardano), OP (Optimism), SOL (Solana), and BTC. 📊
Cardano's (ADA) Meteoric Rise 🌟
ADA's journey began with a break above a pivotal support-resistance level. My entry point at 0.256 turned into a remarkable rally, hitting 52 cents. This movement was a classic case of altcoin buoyancy following Bitcoin's pause.
Optimism (OP) and the Altcoin Breakouts 🌈
In the shadow of Bitcoin's stagnation, altcoins like OP exhibited significant breakouts, showcasing the shifting focus of market whales from Bitcoin to promising altcoins.
Bitcoin (BTC) and Whale Dynamics 📉
Bitcoin's behavior provided a crystal ball into the whale activities. As BTC approached a major resistance level, it signaled a strategic move by whales to divert funds towards altcoins, catalyzing their surge.
Solana (SOL) and Market Trends ☀️
Solana's chart also mirrored this trend, highlighting the broader market dynamics influenced by these significant players.
🔍 Insight on Whale Behavior:
My analysis delved deep into the whale behavior, highlighting how Bitcoin's rally and subsequent pause was a precursor to altcoin dominance. This strategic pause in Bitcoin's ascent was a clear signal for the whales to redistribute their focus and capital, sparking a remarkable rise in altcoins like ADA, OP, and SOL. 🔄
The Bigger Picture - Understanding Market Shifts: What this trend teaches us is the importance of reading between the lines. Whale movements often precede major market shifts, and by understanding these patterns, we position ourselves to make informed decisions. 🧠
Future Outlook: As we continue to monitor these market dynamics, it's crucial to stay vigilant. The crypto market is known for its volatility, and while the current trend favors altcoins, it's essential to be prepared for any shifts that may arise. Always keep an eye on key resistance and support levels, market sentiment, and global economic factors that could influence the next big move. 🌐
Together, let's stay ahead of the curve in this fascinating and ever-evolving world of cryptocurrency. Your insights and engagement are what make this journey exciting and rewarding!
One Love,
The FXPROFESSOR 💙
part 1:

TON – Just a Trade, Probably Out at $6.30📈💼 TON – Just a Trade, Probably Out at $6.30 🎯📊
Welcome back to the Altcoin Series, this time with a closer look at Toncoin (TON) — and yes, it’s just a trade.
Later in the cycle I’ll be divorcing altcoins, but not yet. I’m still bullish. I see setups, I take them. I don’t marry charts — I extract from them.
🔍 What’s the Setup?
TON is at a retest of long-term trendline support, with multiple prior accumulation zones marked on the chart. We’ve just bounced from $2.81, right above the golden pocket area, and we have a clear map higher — but it’s a trade, not a love letter.
🔑 Key Levels
🔹 Entry zone: $2.81–$2.95 (golden pocket & trendline bounce)
🔹 Next levels to watch:
$3.74
$5.52
Likely exit zone: $6.35
🔺 Fib extension shows potential up to $8.49+, but I’m keeping it tight
🛑 Invalidation: Close below $2.81 = back to cash
🧠 The Trader’s Mindset
TON is moving with the narrative — it’s been strong, it’s caught attention, and it’s holding key levels. But I’m not here to believe in the story.
✅ It’s a structural bounce
✅ The risk is clear
✅ The target is clean
🚫 No emotion, no narrative, just levels
This isn’t marriage. It’s business.
🧩 What’s New in Tron?
Tron is picking up momentum, driven by multiple on-chain and institutional signals:
📈 Whale accumulation & on-chain strength — large holders have been accumulating, while withdrawals suggest long-term conviction
🤝 Strategic partnership with Binance Alpha — a roadmap to DeFi expansion and increased liquidity
🧩 Growing stablecoin & DeFi footprint — over $80B USDT on Tron, 6B+ transactions and $15B TVL
🏛️ Coming U.S. debut via a Nasdaq reverse merger — enhanced credibility and U.S. exposure, paused SEC probe, Trump-linked momentum
The Verge
Tron is evolving—from a memecoin playground to a player ready for institutional-level infrastructure.
One Love,
The FXPROFESSOR 💙
Disclosure: I am happy to be part of the Trade Nation's Influencer program and receive a monthly fee for using their TradingView charts in my analysis. Awesome broker, where the trader really comes first! 🌟🤝📈

Bitcoin price increaseAfter the tensions between traders in the United States and the strong price fluctuations in the dollar and other stocks, and after the 3-month increase in gold, this time it will be the turn of digital currencies to increase again and there are signs of their increase in the market. For Bitcoin, two increase targets can be considered: $110,000 - $120,000.
Sasha Charkhchian

The 1.414 Fib – Smart Money’s Darkpool Fib📐💸 The 1.414 Fib – Smart Money’s Darkpool Fib 🔍🧠
Let’s talk about the 1.414 Fibonacci extension — also known as √2 — a subtle but deadly precise level that smart money uses to trap retail.
We saw this play out perfectly on Solana.
That ~$295 zone (close to 300$ but 'no cigar') ?
That was the 1.414 Fib , and it nailed the top before a brutal reversal — a textbook darkpool distribution move.
But Solana wasn’t alone.
🔁 This Isn't Just About SOL
The 1.414 (√2) level has repeated across the crypto market , quietly acting as a marker for institutional exit zones:
📉 It showed up on multiple altcoins in December 2024, just before the entire altcoin rejection
🟠 It’s even been visible recently on Bitcoin itself — yes, even the king of crypto respects this level
So no — this isn’t random. This level has a story to tell.
🤖 Why 1.414 Matters
Most retail traders fixate on the golden ratio: 1.618.
But the 1.414 (√2) is just as important — and arguably more manipulative.
It allows institutions to:
- Front-run major Fibs
- Exit quietly
- Trap late bulls
It’s less obvious, less crowded, and often more effective.
That’s why I call it the "Darkpool Fib."
💔 Why I’m Divorcing Altcoins — But Not Yet
Solana’s chart — and its story — are symbolic of a deeper shift in me as a trader.
I’ve made the decision: at the end of this cycle , I’ll be divorcing altcoins.
Not out of hate — but out of clarity. I won’t “believe” in them anymore. I’ll just trade them.
But let’s be clear:
That moment isn’t now.
Right now, I’m still bullish. I still see opportunity. I’m here to ride the structure — while it’s still giving, or at least going to give something back.
📍Take Solana...
🔹 It was built on Rust, a language praised for speed and performance — perfect for high-throughput, data-heavy blockchain architecture
🔹 It could have been the chain that led us into the future
🔹 Instead, it’s become a memecoin playground , with repeated outages and centralized concerns
I don’t hate it. I just don’t believe in it the way I used to.
Narratives die. Structure doesn’t.
So yes — I’m trading SOL. I respect its levels. But I’ve let go of the idea that it will “change the game.”
I’ll trade the rally. I won’t marry the story.
📊 The Technical Setup
[📍 Support Zone: $153.48 $140.44
Below that, deeper support at $130.17 and $112.12
📍 Current Price: ~$158
📍 Upside Targets:
Minor: $196.80
Mid-channel: $221.53
Structural resistance: $234.97
Upper red trendline: $271.07
Final Extension: ~$325–$362
Potential: 271$, 362$, 490$(close but no cigar of the 500$ mark), 593$ technically is the ultimate resistance.
If Solana reclaims its momentum, this setup gives plenty of upside. But let’s be surgical. We are traders first.
⚠️ Final Thought
We’re in the phase of the cycle where hope is expensive.
Structure is free — if you choose to follow it.
Buy over support
Exit near resistance
Trade the level — not the label
One Love,
The FXPROFESSOR 💙
Disclosure: I am happy to be part of the Trade Nation's Influencer program and receive a monthly fee for using their TradingView charts in my analysis. Awesome broker, where the trader really comes first! 🌟🤝📈


Gold breaks through. Will it continue?After breaking through the position predicted by Quaid on Friday, gold rose strongly and finally maintained the fluctuation range of 3345-3360 that I predicted. Gold bulls are now strong. If there is no major change in the news over the weekend, the price will likely continue to rise after a slight decline at the beginning of next week. I think we can still follow the strategy of Dutou.
The 1-hour moving average of gold continues to diverge with a golden cross and upward bullish arrangement, and the bullish momentum of gold is still there. The current strong support level of gold has also moved up to around 3330. After gold broke through 3330 over the weekend, the price fell back to 3330 and stabilized and rose twice. In the short term, this position has formed a strong support.
There is a high probability that the price will have a small correction at the beginning of next week. We can continue the bullish strategy after the price falls back.
Market transactions should abandon personal preferences. Preconceived subjective consciousness will eventually be taught a lesson by the market. The market is always right. We should follow the fluctuations of the market. Instead of having a head full of random thoughts. There are always traces of market changes, and you need to have the ability to discover them or follow those who have the ability. The market changes rapidly, so pay attention to more timely changes.

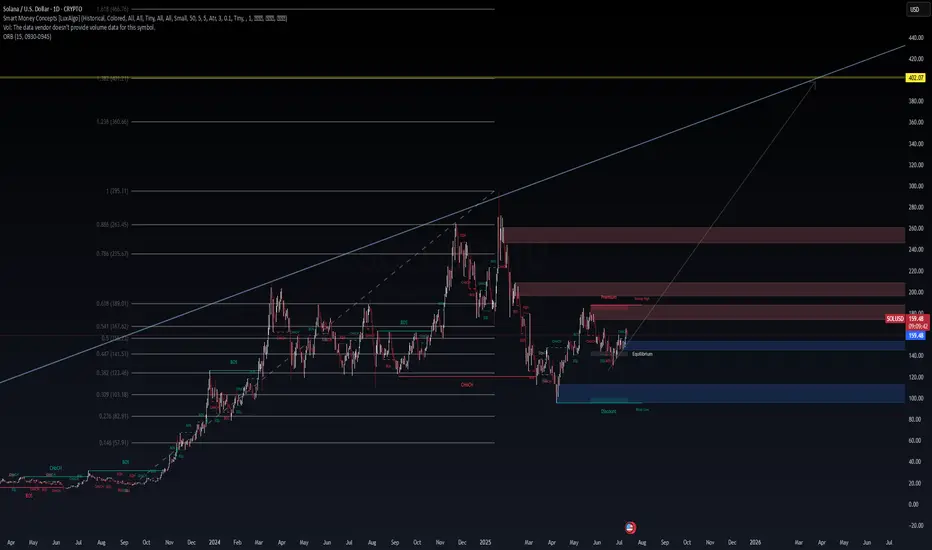
SOL/USD – The War Between Discount & Premium Zones Is Heating Up📈 SOL/USD – The War Between Discount & Premium Zones Is Heating Up
Posted by: WaverVanir_International_LLC
Date: July 12, 2025
Asset: Solana (SOL/USD) | Timeframe: 1D
Strategy Stack: SMC | Fibonacci | Volume Profile | Macro | Catalyst | VolanX DSS Protocol
🔍 Technical Summary
SOL is battling near the 0.5 Fib retracement (~$167), a classic inflection zone. Price is compressing within an equilibrium band bounded by $145–$175. Despite a prior break of structure (BOS) to the downside, recent CHoCH and bullish BOS patterns suggest accumulation may be underway.
Key Zones:
Support (Discount): $123.46 → $103.18 → $82.91
Resistance (Premium): $189 → $235 → $263
High-Conviction Targets:
Bullish Extension: $295 → $360 → $402
Bearish Sweep Zones: $103 → $80 (liquidity pockets)
Structure Readout:
CHoCH (Mar–Apr 2025) suggests reversal potential.
BOS (May–June 2025) confirmed demand stepping in.
Current: Price testing equilibrium mid-zone, low conviction until a clean break of $175 or a flush into $130.
🌐 Macro Context (Q3 2025)
🏦 Federal Reserve Policy
FOMC paused in June, signaling data-dependency.
Market pricing 30–50bps cut by Q4 2025.
Liquidity-sensitive assets like crypto are forward-looking, already attempting to front-run easing.
💰 Global Liquidity Shift
US M2 money supply stabilizing after 2022–2024 contraction.
Global CBs (e.g., ECB, BOJ) showing coordinated signals of easing.
Risk-on flows resurging into high-beta assets → Crypto stands to benefit on the second leg of liquidity wave.
💻 Tech/Crypto Catalysts
Solana Ecosystem rebounding on strong developer metrics, NFT integration, and institutional onboarding (Visa, Shopify integrations).
Tokenization narrative gaining momentum with TradFi firms exploring SOL-based infrastructure.
Regulatory Clarity: US & EU moving toward crypto-safe harbor legislation; positive for altcoin allocation.
⚠️ VolanX DSS Signal Matrix
Module Signal Confidence
Trend Structure Transitional (CHoCH → BOS) Moderate
Fibonacci Levels Compression (0.5–0.618) High
Volume Profile Thin above $175, HVN near $145 High
Macro Liquidity Rising global flows Moderate
Catalyst Tracker Positive (SOL-specific) Moderate
🎯 Execution Framework (2 Scenarios)
🔵 Bullish Bias (Continuation):
Entry Zone: $157–$162 (with SL below $145)
Trigger: Break + close above $175
Targets: $189 → $235 → $263
Invalidation: Daily close below $141.5 BOS zone
🔴 Bearish Bias (Rejection):
Short Zone: $175–$189
Trigger: Rejection w/ CHoCH + imbalance fill
Targets: $145 → $123 → $103
Invalidation: Clean break above $195 with volume
📜 WaverVanir Risk Advisory
This outlook is generated under the WaverVanir DSS (Decision Support System) and is shared strictly for educational and analytical purposes.
We do not manage outside capital, and none of this constitutes investment advice. All systems are probabilistic and adaptive, not deterministic.
🧠 Final Notes:
Solana is at a macro hinge point. Either the liquidity-driven expansion phase begins with force — or we get one more sweep into deeper discount zones before lift-off. With global liquidity expanding and catalysts aligning, the next few weeks will define the rest of 2025’s structure.
💬 Drop your thoughts below.
🔁 Follow @WaverVanir_International_LLC for high-conviction, system-generated macro + SMC trading insights.
🌍
What’s Your Catalyst?
Lately, many QS members have been DM’ing me asking:
“What do you think of this trade idea?”
“Should I go long here?”
“Do you think this setup looks good?”
And my go-to response is always the same:
“What’s your catalyst?”
Because without a catalyst, you’re not trading — you’re guessing.
---
🎮 Trading Is Not a Video Game
New traders often treat the market like it’s a video game.
As long as they “crack the code” of green arrows and red arrows on the chart, they believe they’ll make infinite money.
But that’s not trading.
That’s fantasy.
The harsh truth? Most of these traders haven’t paid their tuition yet.
Some are still in the honeymoon phase.
But the market always gets paid — in blood, time, or money.
---
💀 Real Trading Is Financial Warfare
Trading is not a game.
It’s war.
Behind every price tick, every candle, every fill — is another trader fighting for their financial life.
It’s a sword-to-sword battle. Just because you see it on your phone doesn’t mean it’s not real.
Real trading is life and death for hedge funds, prop firms, and even retail traders trying to survive.
Yet so many jump in, chasing arrows and patterns like they’re spinning a slot machine.
---
🎲 Why You’re Losing with “Green Arrow, Red Arrow”
No offense to TA — it has value. But let’s be honest:
If you’re blindly betting off green and red signals without context, you’re gambling.
You’re just hoping that one of those arrows lines up with a rare, random outlier move — so your one win is big enough to cover all your prior losses.
That’s not strategy.
That’s survival through luck.
---
🔍 What Real Traders Do Differently
To stand out, you need more than pretty charts.
You need information. Insight. Intent.
You need to answer questions like:
Why is this price movement happening?
How far can it go?
What’s driving this move — and what’s the broader context?
You won’t find those answers in price and volume alone.
---
💡 The 4D Framework of Modern Trading
To get an edge, you need to think in 4 dimensions — beyond what most retail traders see:
Market Data – price, volume, trends
Fundamentals – earnings, balance sheets, growth
Macro Forces – rates, inflation, policy, geopolitics
Catalysts – news, events, industry changes
Options Data – implied vol, skew, positioning
This 4D perspective is how modern trading works — and it’s exactly what AI is built to do better than any one trader.
You’re not going to out-research Goldman Sachs.
You’re not going to manually read every 10-K, earnings call, tweet, and Fed update.
But AI can.
---
🤖 AI Isn’t Perfect — But It’s Better Than Gambling
Is AI trading the ultimate answer?
No.
But it’s the closest thing we have to a scalable edge — because it combines massive information processing with human-level reasoning.
The choice is yours:
Stick with “green arrow, red arrow” and hope for Vegas-style luck
Or embrace AI tools that give you a fighting chance through context and analysis
I’ve made my choice.
And every day, my tools — and my edge — get better.
---
🧠 So Next Time You Trade, Ask Yourself
What’s your catalyst?
If you don’t have one, you don’t have a trade.
You have a lottery ticket.

How Much Risk Are You Really Taking?
I get two common horror stories from new QS members:
“I followed a few QS signals, nailed some wins… then bled it all back.”
“My first couple signals lost, and my account was toast.”
My first question to both groups is always the same:
“How much risk did you assign to that trade?”
❌ Why Most Traders Dodge This Question
Risk management isn’t sexy.
Green arrows and slam‑dunk gains are fun to talk about. Stop‑losses and position sizing? Not so much.
Gambling feels easier than math.
Going “all‑in” gives you the casino rush. Calculating max drawdown does not.
Accountability hurts.
If the trade blows up, there’s no one to blame except the person who sized it.
⚔️ Trading = War (No, It’s Not “Fun”)
Like I said in “What’s Your Catalyst?” — trading is financial warfare.
Show up without armor (risk rules) and you’re the first casualty.
In basketball you need defense before dunks.
In war you need body armor before bullets.
In trading you need risk management before any strategy.
📏 My Simple Rule
Only risk what you’re prepared to watch burn—completely.
If the idea of that money turning to ash makes you queasy, you’re oversized. Period.
🧠 Questions to Ask Before Every Trade
Position size: How many dollars exactly can I lose and still fight tomorrow?
Probability: Is this setup strong enough to justify that risk?
Stop‑loss: Where is my hard exit? No “I’ll see how it feels.”
Reward‑to‑risk: Is the upside worth at least 2–3× the downside?
Confidence check: If I’m not 100 % cool watching this cash burn, why am I risking it?
🚀 Pair Your Edge with Protection
AI and QS signals give you edge — a slightly better chance in a brutal game.
But edge without risk control is like a sniper without body armor: lethal until one bullet hits.
Next time you celebrate a hot streak or curse a quick wipe‑out, pause and ask:
“How much risk did I really assign to this trade, and was it worth it?”
If you can answer honestly and still sleep at night, proceed.
If not, size down, armor up, and protect your capital first.
Strong defense wins championships — and trading accounts. 🛡️💰

The Myth of Win RateOne of the most common questions I get from QS members:
“What’s the win rate of the signal?”
Sounds like a smart question. But it's often coming from the wrong mindset — the same mindset as a student cramming for a test, hoping for one perfect answer key that’ll give them a 90% score and an easy win.
Let me break this down for you:
🧮 The Only Two Numbers That Matter in Trading
There are only two math truths that actually grow your account:
Win Rate – how often you’re right
Win/Loss Ratio – how much you make when right vs. how much you lose when wrong
Everyone obsesses over #1.
Almost no one truly understands or applies #2 — and that’s the real killer.
---
🤔 So What’s the Ideal Setup?
In a perfect world, you’d have:
A high win rate (80–90%)
AND a high win/loss ratio (make $3, lose $1)
But guess what?
This isn’t a perfect world — this is a war.
See my earlier post: "What’s your catalyst?"
---
⚔️ Trading Is Like War (or Sports)
In war, victory is rare and costly.
In sports, scoring takes hard work, timing, and discipline.
In trading:
You win big when the odds are stacked in your favor
You cut losses quickly when you’re on the wrong side
That's the gold standard — but few do it.
Even worse, many do the exact opposite:
Take quick profits to “lock in a win”
Let losers run hoping for a miracle
Then they wonder why their account bleeds over time.
---
🎰 Vegas Was Built on 51% Win Rate
Casinos don’t need to win every game. They just need:
Slightly better than 50% edge
Strict control over risk and payout
That 1–2% edge? It built every billion-dollar casino on the Strip.
Now think again:
Why are you chasing a 90% win rate when even 55% + smart risk control can make you rich?
---
🧠 Profitability > Win Rate
You don’t need to win all the time.
You need to win big enough and lose small enough.
Your goal should be:
3 steps forward, 1 step back.
That’s the realistic rhythm of trading success.
---
✅ So Next Time You Ask About a Signal...
Don’t just ask:
“What’s the win rate?”
Instead ask:
“What’s the reward if I’m right?”
“What’s the damage if I’m wrong?”
“How do I size this trade so my wins outgrow my losses over time?”
This is how real traders think.
Not about perfection — but about probability, edge, and sustainability.
---
💬 TL;DR
Win rate is just one piece.
Your win/loss ratio and risk management matter more.
Profitability > accuracy.
The market doesn’t reward perfection. It rewards preparation, defense, and discipline.
Keep playing smart, not perfect.
And remember — it’s a long game. 🧠📈
How I Manage Risk (When Buying Options) If you’ve read my previous post — “How Much Risk Are You Really Taking?” — you already know my view on risk:
Treat every trade like watching your cash burn in front of you.
Ask yourself:
💭 “Would I be OK watching this much money disappear right now?”
If your answer is yes, take the trade and move on.
If it’s no, don’t do it — resize it.
🚫 What Not to Do:
Many traders fall into the trap of:
“I’ll think about it later”
“I’ll set a mental stop and cut if it hits my level…”
That approach has two fatal flaws:
#### ❗ 1. Execution failure
You might not react fast enough when the market hits your level — or worse, you’ll forget to act at all.
#### ❗ 2. Emotional resistance
Even if your stop level is hit, will you actually cut?
Probably not.
Human nature avoids pain and chases pleasure.
Cutting a loss — even a planned one — is painful. That’s why mental stops often fail.
Mental stops:
Add more burden to monitor
Add more emotion to your decision-making
That’s why I keep it simple.
---
✅ My Risk Rule for Buying Options:
Every dollar of premium I spend is 100% acceptable to lose.
This way:
I don’t need a mental stop.
I don’t need to watch it every second.
I sleep well, regardless of outcome.
---
📊 How Much Do I Risk?
It depends on account size and account type:
#### 📌 Main Account:
Risk 1–2% per trade
Never more than 5% on a single trade
Rarely hold more than 3 trades at once
Targeting 6–10% total exposure, only if trades are uncorrelated
⚠️ SPY & QQQ are NOT uncorrelated — don’t fool yourself.
#### 📌 Small Account:
Can risk 5–10% per trade, but only on A+ setups(See: “What’s Your Catalyst?” for what qualifies as A+ in my book)
The goal of a small account is different: it’s about growth — but still must be strategic.
---
💰 “But How Can I Make Big Money Risking So Little?”
This is the common pushback I get:
“Shouldn’t we take big risks to get big rewards?”
Sure — high risk = high reward.
But high risk also = high chance of blowing up.
Even if you hit a few big winners, you’ve compromised your long-term survival.
That’s not trading. That’s gambling.
---
🧠 What I Actually Look For:
Low Risk / High Reward.
Yes, they’re rare.
Yes, they’re like lotto tickets.
But you don’t need to win often if you only risk a little and win big when it counts.
What’s not rare is:
Traders risking big on uncertain setups
Going all in on gut feelings
Wiping out in one or two bad trades
That’s not strategy — that’s self-destruction.
---
🧾 The 2 Core Rules of Risk:
Protect capital at all costs
Only take trades where potential reward outsizes the risk
Don’t flip the logic.
Too many traders hear “high risk = high reward” and assume high risk is required.
It’s not.
That mindset is built for Vegas, not for Wall Street.
---
🧠 If You Want to Be a Trader — Not a Gambler:
You must believe in:
Small risk, big reward
Patience
Discipline
Letting time and luck compound your edge
No other way.
🎯 If you truly get this… congrats.
You’ve crossed the line from gambling to trading.

How to Do Your “Trading Homework” (The Smart Way)
If you’ve been following this channel, you’ve heard me say it many times:
Trading is war — and you should never enter a battle unprepared.
But here’s the real question:
How exactly do you prepare?
The answer lies in a powerful strategy I use called:
💡 Thematic Investing
Read more here →
Instead of chasing news or signals in isolation, thematic investing means:
You first understand where the world is heading
Then you position yourself ahead of that move
It’s not about reacting. It’s about anticipating.
---
❌ What Most Traders Do Wrong
Most beginners:
Follow one tweet
See one red or green arrow
Watch one chart pattern
Then they jump in blindly.
That’s not trading — that’s guessing.
News headlines and chart moves reflect what already happened.
But your edge comes from understanding what’s likely to happen next.
---
✅ What I Do Instead (with QS AI)
Back in the day, doing thematic analysis manually could take hours of reading across dozens of news sites, earnings calls, and macro reports.
But now?
QS AI does the heavy lifting for you — in seconds.
Here’s how I do my “trading homework” every week using QS signals:
---
🧠 Step 1: Start with the News Theme
Go to 📰news-signal — let the AI scan hundreds of headlines and summarize the key themes shaping the week.
Ask yourself:
What’s the main event or policy shift?
Which sectors are directly impacted?
Who are the winners and losers?
---
🔎 Step 2: Zoom Into Sectors or Stocks
Once you spot a theme, use other QS signals to dig deeper:
⏰0dte for fast-moving trades (same-day catalysts)
📅weekly-options for 1–5 day plays
💸earning-signal for earnings-related positioning
🔄swing-signal for broader trend/position trades
---
📈 Real Examples of Thematic Trades
Let me walk you through a few past trades — all built off this exact process:
✅ BBB Defense Play
Theme: Bill passed removing EV credits, boosting defense
Strategy: Long PLTR / Short EV sector using 📅weekly-options
✅ Robinhood Crypto Tokenization
Theme: Robinhood’s crypto product event
Strategy: Crypto stocks pump → took profits early
✅ Tesla Robotaxi Week
Theme: TSLA reveals AI & robotaxi push
Strategy: Long TSLA / Short UBER
✅ Earnings Play: MSFT vs AAPL
Theme: MSFT cloud beat, AAPL revenue drop
Strategy: Long MSFT / Short AAPL using 💸earning-signal
All these trades started with thematic awareness → followed by precise signal-based execution.
---
⚙️ Your Homework Checklist (The QS Way)
Before every week or trade, ask:
📰 What is the major theme driving markets this week?
🧠 What sectors or companies are most impacted by this theme?
🔀 Can I find a relative strength/weakness pair to trade?
⏳ What’s the best time frame? (0DTE, weekly, swing?)
📊 What do QS signals say about timing, momentum, and volatility?
---
🤖 Why QS AI Gives You the Edge
Doing this manually would take you 5–10 hours a week.
But with QS AI:
You scan the entire news cycle in 10 seconds
Get real-time themes and reactions
Pair it with high-quality trade setups
Prepare your game plan before the market opens
This is how we prepare smarter, not harder.
No more chasing arrows.
No more gambling.
Just clean, thematic, risk-aware, high-conviction trades.
---
🏁 Final Thought
There are no guarantees in trading.
But there is a smarter way to prepare.
Thematic investing + QS AI gives you the best shape to step into the market and fight with confidence.
Follow where the world is going — one theme at a time.
That’s how we trade with QS. That’s how we print. 🧠💥💰

Select Your Trading Time
There’s an old saying:
“Plan your trade, and trade your plan.”
But I want to add something even more important:
“Pick your time to trade.”
---
💰 The Market Is Not Your ATM
Everyone enters trading with one goal: make money.
Some even think of the market as an ATM — pull the handle, cash comes out.
But the truth is:
❌ The market doesn’t care about your goals
❌ It won’t move just because you need to make money today
This is a brutal game. And you don’t control the clock.
---
⚠️ When You Force a Trade...
Too many traders say:
“I have to make money today.”
“I need to hit $X this week.”
“I just took a loss, I must come back now.”
That kind of thinking leads to:
Bad entries
Overtrading
Emotional decisions
Big losses
❗ Trading success doesn’t come from forcing outcomes — it comes from waiting for the right moments.
---
🧠 What Happens on Low-Volatility Days
Let’s take today as an example.
SPY moved in a 2-point range all day.
No momentum, no trend, just chop.
Some traders:
Ran one QS signal after another
Forced trades just to feel busy
Got chopped up by fast reversals
Then blamed the signals
But here’s the truth:
AI or not , you can’t expect any long-volatility trade to work when the market is dead still.
The only winners on days like today? Market makers and options sellers.
---
❓ Why Trade at All on a Day Like This?
If the market isn’t offering opportunity,
Why force it? Why chase trades? Why burn your energy?
The smarter move is:
Sit out
Observe
Wait for better setups
Preserve your mental and financial capital
---
🔄 Recovery? Yes — But on Your Terms
Some traders lose money and say:
“I need to make it back today.”
That’s emotional revenge trading.
What if the market doesn’t give you a clean opportunity today?
Are you still going to go all-in, out of frustration?
❌ That’s not a strategy. That’s gambling.
---
📍 QS Signals Are a Map — Not a Magic Button
QS AI signals help you find opportunities — but even the best map won’t help if:
You're in the wrong city (bad market environment)
You’re rushing without checking road conditions (volatility, news, timing)
Even with QS, you don’t have to trade every day, every hour.
---
✅ What You Should Do
Be patient
Respect market conditions
Take a break on slow or tricky days
Come back when the odds are in your favor
---
🧘♂️ Final Words
You don’t have to win every day.
You don’t have to trade every day.
You don’t even have to be active to be successful.
🎯 Trade less. Trade smarter. Select your time wisely.
That’s how real traders survive and thrive in this game.
How We’ll Trade Earnings This Season Earnings season is almost here — and if you're with QS, you’re already holding the most powerful edge in the market.
Let me walk you through how QS trades earnings, why we built 💸earning-signal, and how you can use it most effectively this quarter.
---
📜 A Little History: The Birth of 💸earning-signal
When QS launched in early April, we started with just two short-term signals:
⏰0dte
📅weekly-options
Both focused on short-term options trades.
Then came TSLA earnings in late April. That’s when we launched our very first 💸earning-signal — and nailed the prediction.
Since then?
We’ve had one of the best earnings win streaks on the internet. Period.
📌 Don’t take my word for it — check:
#✅signal-recap for the track record
#🤑profits and #🤩member-testimonials for real wins from members
---
🤖 Why We Built a Separate Earnings Signal
Earnings are not regular trading days. The dynamics are completely different.
On normal days, a stock might move <1%
On earnings? 10–20% swings are common
This is what we call a “pivot event” — and it requires a different engine to predict.
That’s why we separated:
📅 #weekly-options → normal day-to-day setups
💸 #earning-signal → high-volatility earnings plays
---
🧠 How a Human Would Trade Earnings...
If you wanted to manually trade an earnings report, you’d need to analyze:
Past earnings reactions
Analyst expectations
Earnings call language
Financial statement surprises
Options IV & skew
Post-earnings stock behavior
This would take hours (or days) — and most retail traders don’t have time.
---
⚙️ How QS AI Does It Instead
We built 💸earning-signal to do all that work for you — and more.
✅ It pulls in all the data above
✅ Runs it through 5 top LLM models (each acts as an independent analyst)
✅ Aggregates their insights + calculates probability-weighted direction & strategy
✅ Uses fine-tuning to learn from its past prediction success/failures
This means: faster decisions, deeper insights, and better accuracy — every week.
We don’t just run predictions. We let the AI learn from past mistakes and self-improve each quarter.
---
💥 Results Speak for Themselves
Last season, we nailed:
TSLA
MSFT (10x–20x winners!)
NVDA
AAPL
And many more...
All based on this unique AI-driven earnings analysis stack.
This season?
We’re going harder, faster, and even smarter. 📈
🎯 The goal is clear:
Make 💸earning-signal the #1 earnings prediction system in the world.
---
🧩 Final Notes
Earnings are 10x harder to trade than regular days
But with QS, you’re equipped with 500x the speed and insight of an average trader
Upgrade if you haven’t yet: #💰upgrade-instructions
Earnings season kicks off next week
Let’s get it.
Let’s win big.
Let’s make season 2 of 💸earning-signal our most legendary yet. 🚀💸

BTCUSDT[BITCOIN]:Price is Likely to be Heading Towards $144,000.Recently, Bitcoin has shown extreme bullish price behaviour, and there’s no sign of bearish influence in the market. After monitoring the price since May 4th, we believe there’s a high possibility of price hitting the 120k region first. This could be followed by a small correction around 105k, where a strong bullish price influence will lead the price to our final target at 140k. Both fundamental and technical factors support this view, but it doesn’t guarantee the price will follow our expectations.
Before investing or trading cryptocurrencies, do your own research as they carry significant financial risk. This chart analysis is for educational or secondary purposes only.
Good luck and trade safely.
If you want to support and encourage us, you can do the following: ❤️
-Like the idea
-Comment the idea
-Share ;)
Team Setupsfx_

BTCUSDT[BITCOIN]: $150,000 On The Way In Making!Hey there everyone!
Bitcoin took a bit of a dip around 105k, but it’s right back at a crucial level now. We’re keeping a close eye on the daily volume and expecting it to soar towards $115,000 before it might take another dip if the buying pressure dries up.
We’ve got three targets in mind, and you can set or look at them however you like based on your own analysis and preferences. The crypto market is going to be buzzing with volume, so keep an eye on the news and stay focused on the fundamentals. In the world of cryptocurrencies, fundamentals are more important than technicals, and it’s a whole different ball game compared to forex or gold.
Good luck with your trading, and please like and comment on this idea to show us your support. We really appreciate your support throughout our journey, and we’re excited to see it grow and continue.
If you’d like us to analyse a specific pair, just let us know!
Cheers,
Team Setupsfx_❤️

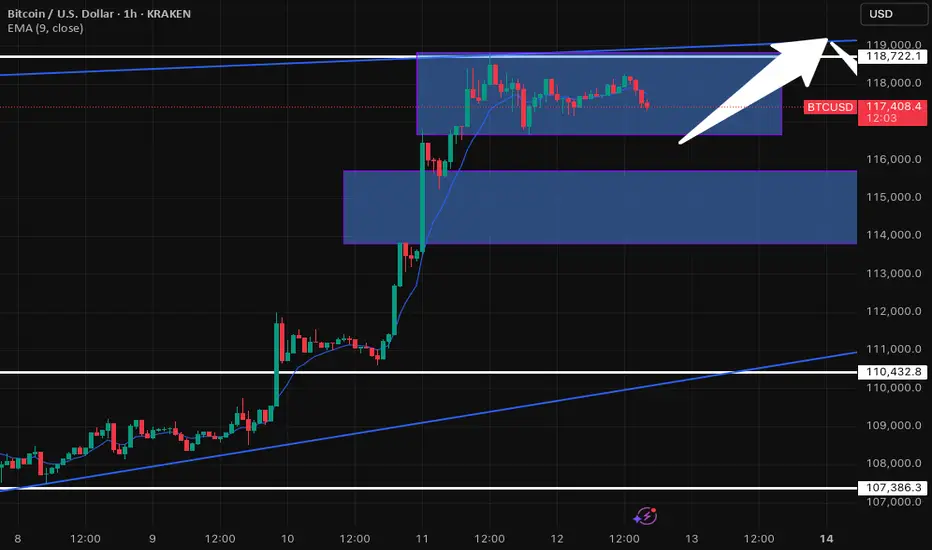
BTC/USD 1H: Uptrend Consolidation - Key Levels to WatchQuick Look at Bitcoin (BTC/USD) on the 1-Hour Chart - Kraken
Alright, let's dive into what Bitcoin's doing on the 1-hour chart. We've seen BTC in a pretty solid uptrend lately, cruising nicely within that ascending channel. It recently had a fantastic run, pushing right past the $110,432.8 resistance level – a great sign!
But now, it looks like Bitcoin is taking a breather. It's currently consolidating in that upper blue box, roughly hanging out between $116,000 and $118,000. This kind of sideways movement often means the market is trying to figure out its next big move after a strong push. Are buyers reloading, or are sellers starting to step in? That's the big question.
Here's what I'm keeping an eye on:
On the Upside: The immediate hurdle is the top of this current consolidation range, right around $118,722.1, which also lines up with the upper trendline of our channel. If Bitcoin can break convincingly above that, we could see another leg up – definitely a bullish signal!
On the Downside: If it can't hold this range and starts to dip, the first area of interest for support is that lower blue box, roughly $114,000 to $115,000. That's where I'd expect some buyers to potentially step back in.
Stronger Safety Nets: Don't forget that $110,432.8 level. It was tough resistance before, so it should now act as a pretty strong support if we see a deeper pullback. And, of course, the bottom trendline of our ascending channel and $107,386.3 are there as well.
My Takeaway:
Bitcoin's in a strong position overall, but this consolidation is key. The next big move will tell us a lot. Keep an eye on those breakout or breakdown points – that's where the action will be!
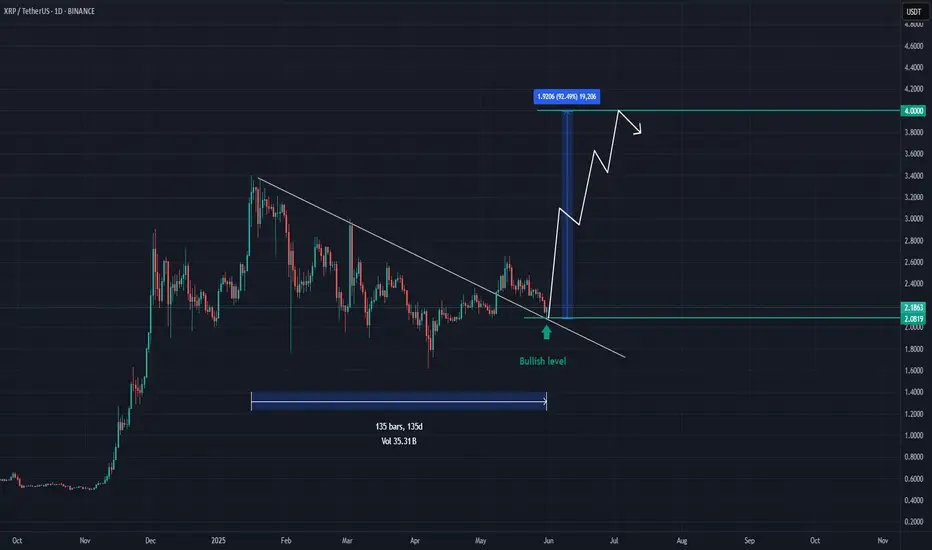
XRP - This is one of many great opportunitiesXRP is reaching a solid level of $2.1.
I believe this level will attract investors for the following reasons :
Technicals :
After breaking the main resistance trendline, XRP is now reaching a solid support level presented in green.
Price action :
- In accumulating since Jan '25
- Resisted to last market dumps
Beyond technicals :
- Very strong community
- Real services and strong team
Market sentiment :
The investors are now looking for a strong asset to invest in. They may switch their alts to any coin that shows strenght. For now, XRP is on the top list.
Recap :
- Risks : bad news from the team , whales dumping , ...
- Main Target : $4
- Reward : near 100%
BITSTAMP:XRPUSD COINBASE:XRPUSD BYBIT:XRPUSDT.P CRYPTOCAP:XRP KUCOIN:XRPUSDT