EURusd short position 18/07/2025English : According to our analysis, we anticipate a bearish scenario.
Morocan Darija : kanchofo d'apres l'analyse dyalna antsanaw hboot
ATENTION : I only share my ideas, not signals
Fundamental Analysis

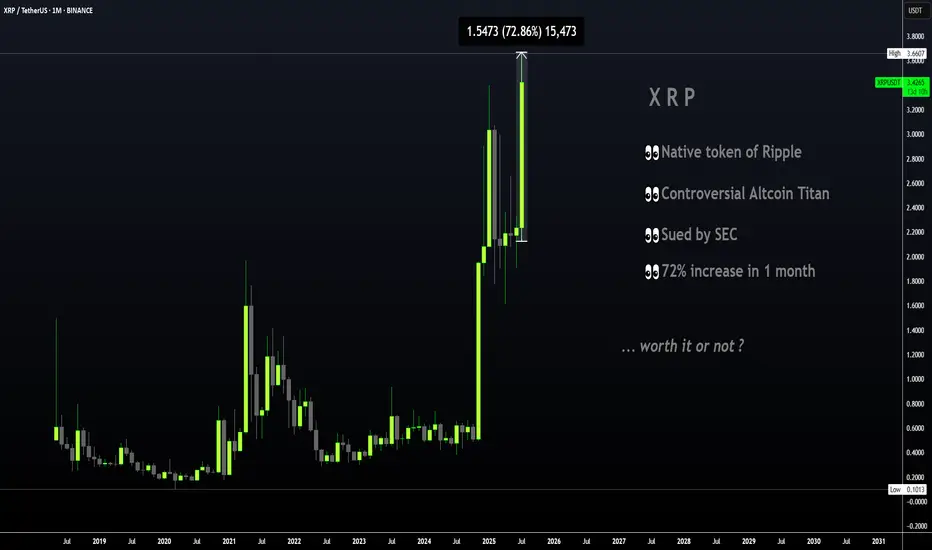
XRP | Great TP Zone is HERE for HODLERSXRP has seen a 62% increase since breaking out above the moving averages in the daily timeframe.
The previous time XRP broke out above the moving averages in the daily, the price increased around 440%:
However, with XRP being the ultimate pumper and dumper, I'll take my chances at 62%! Because this bull run has been anything but ordinary and it's best to avoid being too greedy. The price of XRP falls extremely quick, just as quick as it rises.. ( Maybe not overnight but you know, it has happened before ).
If you're one of few who bought around $1, or heck even later at $2, this is a solid increase and it should not be taken for granted. XRP has gone LONG periods without increases and often stayed behind making new ATH's when other cycles have come and gone (twice), as other alts make new ATH's. Over the years, I've made extensive posts on XRP; documented its use case, followed the SEC case closely and yet, XRP still remains one of the strangest and most unpredictable alts I have ever tried to analyze. Long term followers will remember that a I was bullish in 2018/2019 and then slowly became uninterested up until the point of negative towards XRP for probably the past 3-4 years.
This is not only because of the lagging price compared to other older alts that soared like ETH and even Litecoin. Sure we did not see the growth and the taco stand ( who remembers ) just kept dumping on the market... But the entire "scandal" of the actors marketing/pimping, the dumping behind the scenes by executives to fund Ripple in early days, the lawsuit etc. was just such a colossal mess that I even wonder how XRP is still alive and kicking today.
All I'm saying is that this is truly a spectacular moment - it's hard to even imagine cripple crossed $3 after years and years of waiting on XRP when other alts x1000% and beyond. Point being - Don't miss it! Trading only works when you take profits.
________________________
BINANCE:XRPUSDT
XRP Intra-day Analysis 18-Jul-2025Price action on XRP has shown upward momentum after reaching the 3.7 price level.
Possible scenarios include:
* The 3.3 level could come into focus if the market revisits this area. Market participants may monitor it for signs of seller exhaustion or potential reversal patterns.
* Should the price move lower, the 3.0 level may act as the next key area of interest. This round number is often viewed as a psychological level and may attract increased attention from traders.
* If there is a clear intraday move below the 3.0 level, the 2.6 area could emerge as another notable zone that some participants may consider relevant for future market reactions.
Disclaimer: easyMarkets Account on TradingView allows you to combine easyMarkets industry leading conditions, regulated trading and tight fixed spreads with TradingView's powerful social network for traders, advanced charting and analytics. Access no slippage on limit orders, tight fixed spreads, negative balance protection, no hidden fees or commission, and seamless integration.
Any opinions, news, research, analyses, prices, other information, or links to third-party sites contained on this website are provided on an "as-is" basis, are intended only to be informative, is not an advice nor a recommendation, nor research, or a record of our trading prices, or an offer of, or solicitation for a transaction in any financial instrument and thus should not be treated as such. The information provided does not involve any specific investment objectives, financial situation and needs of any specific person who may receive it. Please be aware, that past performance is not a reliable indicator of future performance and/or results. Past Performance or Forward-looking scenarios based upon the reasonable beliefs of the third-party provider are not a guarantee of future performance. Actual results may differ materially from those anticipated in forward-looking or past performance statements. easyMarkets makes no representation or warranty and assumes no liability as to the accuracy or completeness of the information provided, nor any loss arising from any investment based on a recommendation, forecast or any information supplied by any third-party.

ETHUSD heading towards the top of the D1 frame✏️ CRYPTO:ETHUSD is in a strong uptrend towards the resistance zone of the 3800 daily frame. There are not many conditions for the sellers to jump in and reverse the current trend. Wait for the price reaction at the resistance of the D1 frame to consider the SELL strategy. Because currently if BUY is too Fomo.
📉 Key Levels
Sell trigger: Rejection from 3800
Target 3400, potentially 3,380
Leave your comments on the idea. I am happy to read your views.

DXY LONG SETUP | Skyrocketinggggg
This is a bullish setup on the U.S. Dollar Index (DXY), taken from the 1H timeframe using Smart Money Concepts.
Price retraced into a clearly defined 1H demand zone where it also tapped a trendline support, creating a strong confluence +an LQC. The zone had internal liquidity swept and price mitigated a bullish order block, indicating potential institutional re-accumulation.
Entry was taken after bullish confirmation within the zone (engulfing candle), aligned with my SMC strategy which targets liquidity grabs and mitigation zones.
🔹 Entry: 98.06
🔹 SL: 97.83 (below the zone and structure)
🔹 TP: 99.11 (previous H1 high & clean supply zone)
🔹 RR: Approx. 4.5R
🔍 Technical Confluences:
Demand zone + OB mitigation + LQC
Trendline reaction (support respected)
Liquidity sweep + BOS (Break of Structure)
Clean imbalance above = fuel for price
Bullish engulfing as confirmation
📰 Fundamental Bias:
Today’s U.S. Jobless Claims came in better than expected, signaling labor market strength. Additionally, Retail Sales data was positive, reinforcing USD strength. These support a hawkish Fed narrative, aligning with our bullish technical setup.
Bias remains bullish unless price closes below 97.83 (invalidation level).

Pay attention to the 3350 high point suppression!At present, we are paying attention to the short-term pressure near 3340-3350. If this position is not broken today, the daily line will continue to maintain a downward oscillation state, and continue to pay attention to the short-term competition near 3340-3350. Considering that the US dollar index is at a relatively high level in the short term, there is a certain demand for pressure repair, which may also bring a certain range of fluctuations to gold. Therefore, the gold operation maintains a range of fluctuations of 3300-3350. In the short term, we also need to pay attention to the emotional impact brought by fundamentals. From the current gold trend analysis structure, the short-term support below continues to focus on the vicinity of 3310-3300, the short-term suppression above focuses on the vicinity of 3340-3350, and the key pressure above focuses on the vicinity of 3380. The overall trend is running around the 3300-3350 range. The operation is mainly to participate in the volatile market with the idea of selling high and buying low, and remain flexible in response. It is recommended to wait and see more and do less in the middle position, chase orders cautiously, and wait patiently for key points to enter the market.
Gold operation strategy: Go long when gold falls back to around 3315-3305, with a target of 3335-3340.

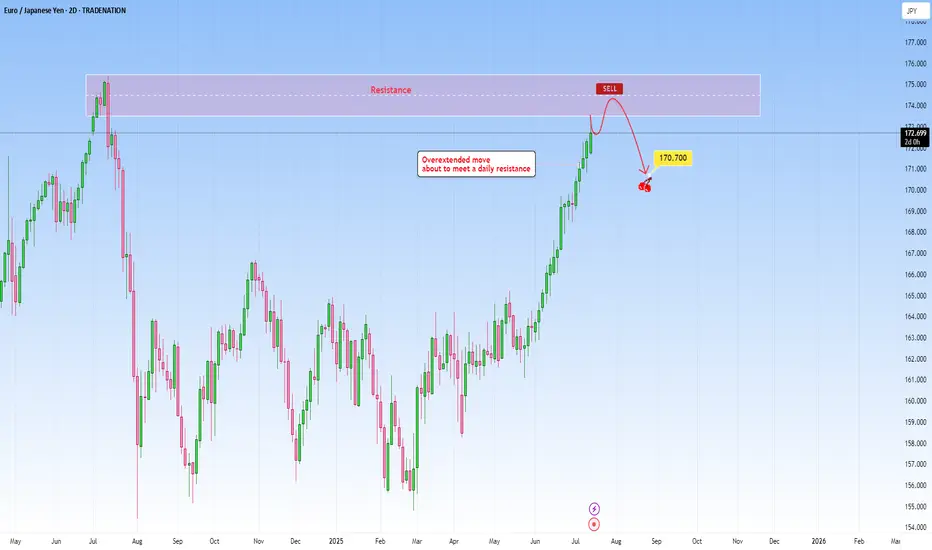
EURJPY: Overextended move to meet daily resistanceThe current market context on EURJPY shows an overextended move that has been pushing higher as price is about to reach a well-established daily resistance. The rally into this resistance lacks healthy retracements, and momentum is likely unsustainable without a deeper correction. The probability of a pause or reversal here under this circumstances increases substantially.
This extension exaggerates this imbalance making it a high probability setup. Volume and price action near this level becomes critical in this case. Signs such as long upper wicks, bearish engulfing patterns will hint that the move may be running out of steam.
I would be targeting a decent pullback towards 170.700.
Just sharing my thoughts for the charts, this isn’t financial advice. Always confirm your setups and manage your risk properly.
Disclosure: I am part of Trade Nation's Influencer program and receive a monthly fee for using their TradingView charts in my analysis.
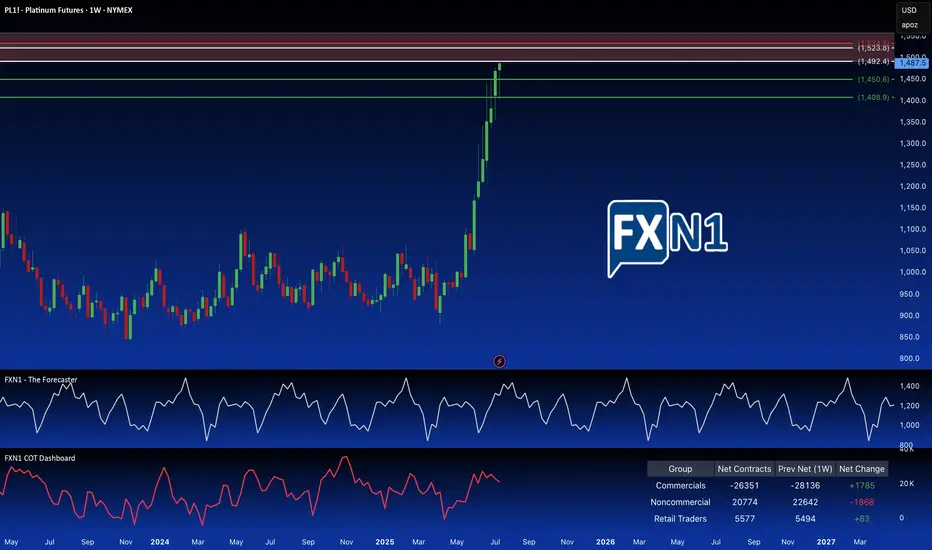
Platinum: Breaking the Supply Barrier?I'm adding a second Platinum position. Price has hit a strong weekly supply area, also a significant monthly supply zone. I'm anticipating a reversal here, as non-commercial holdings are decreasing, and seasonal patterns suggest a potential trend change. To further capitalize on potential upside, I've placed a pending order above the primary supply zone, at a slightly higher, but still relevant. These are older, established and fresh supply zones.
(Note: Reducing the chart size may help to better visualize the long-term significance of these overlapping areas.)
✅ Please share your thoughts about PL1! in the comments section below and HIT LIKE if you appreciate my analysis. Don't forget to FOLLOW ME; you will help us a lot with this small contribution.
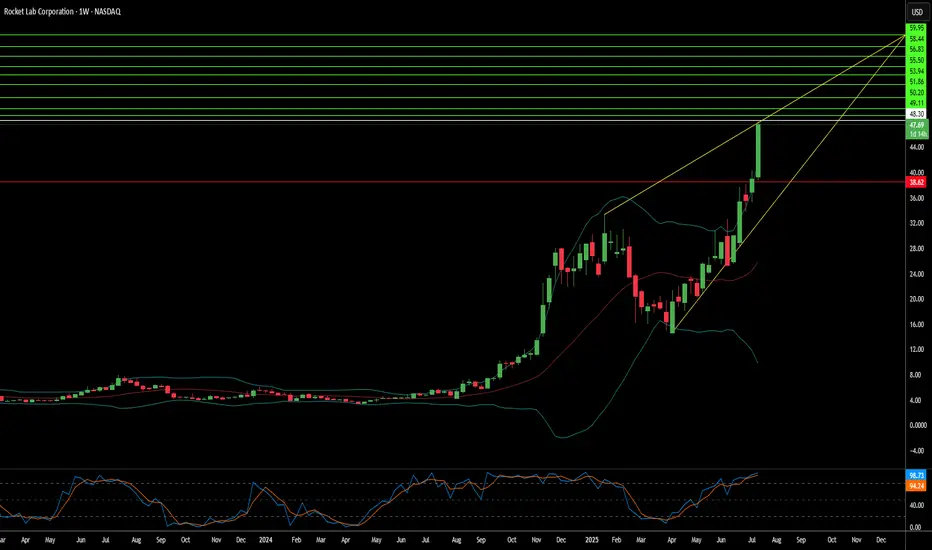
Is Rocket Lab the Future of Space Commerce?Rocket Lab (RKLB) is rapidly ascending as a pivotal force in the burgeoning commercial space industry. The company's vertically integrated model, spanning launch services, spacecraft manufacturing, and component production, distinguishes it as a comprehensive solutions provider. With key operations and launch sites in both the U.S. and New Zealand, Rocket Lab leverages a strategic geographic presence, particularly its strong U.S. footprint. This dual-nation capability is crucial for securing sensitive U.S. government and national security contracts, aligning perfectly with the U.S. imperative for resilient, domestic space supply chains in an era of heightened geopolitical competition. This positions Rocket Lab as a trusted partner for Western allies, mitigating supply chain risks for critical missions and bolstering its competitive edge.
The company's growth is inextricably linked to significant global shifts. The space economy is projected to surge from $630 billion in 2023 to $1.8 trillion by 2035, driven by decreasing launch costs and increasing demand for satellite data. Space is now a critical domain for national security, compelling governments to rely on commercial entities for responsive and reliable access to orbit. Rocket Lab's Electron rocket, with over 40 launches and a 91% success rate, is ideally suited for the burgeoning small satellite market, vital for Earth observation and global communications. Its ongoing development of Neutron, a reusable medium-lift rocket, promises to further reduce costs and increase launch cadence, targeting the expansive market for mega-constellations and human spaceflight.
Rocket Lab's strategic acquisitions, such as SolAero and Sinclair Interplanetary, enhance its in-house manufacturing capabilities, allowing greater control over the entire space value chain. This vertical integration not only streamlines operations and reduces lead times but also establishes a significant barrier to entry for competitors. While facing stiff competition from industry giants like SpaceX and emerging players, Rocket Lab's diversified approach into higher-margin space systems and its proven reliability position it strongly. Its strategic partnerships further validate its technological prowess and operational excellence, ensuring a robust position in an increasingly competitive landscape. As the company explores new frontiers like on-orbit servicing and in-space manufacturing, Rocket Lab continues to demonstrate the strategic foresight necessary to thrive in the dynamic new space race.
USDJPY : More Upside Ahead?USDJPY : More Upside Ahead?
USDJPY remains firmly in a bullish trend, largely driven by renewed tariff concerns.
The yen weakened sharply after U.S. President Donald Trump reaffirmed plans to impose 25% tariffs on Japanese goods starting August 1st.
Since that announcement, USDJPY has rallied nearly 200 pips before encountering some profit-taking.
Despite the brief pause, the broader trend remains intact, and the pair appears poised for further gains.
Key upside targets to watch:
146.95
147.80
148.40
You may find more details in the chart!
Thank you and Good Luck!
PS: Please support with a like or comment if you find this analysis useful for your trading day
Disclosure: I am part of Trade Nation's Influencer program and receive a monthly fee for using their TradingView charts in my analysis.

BABA: triangle with tensionOn the weekly chart, BABA has already formed a golden cross - price is above both MA50 and MA200, confirming a bullish trend shift. The stock is now approaching the upper edge of the symmetrical triangle and the key resistance at $122, which also aligns with the 0.5 Fibonacci level.
The numbers inside the triangle represent the contraction phases, not Elliott waves. This is a classical consolidation before a potential breakout. If the $122 level is broken and retested, upside targets are $128 (0.618), $137 (0.786), and eventually $148–181 (1.0–1.618 extension).
Volume is rising, MACD is flipping bullish, and RSI is climbing out of oversold territory — all signs point to growing bullish momentum.
Fundamentally, Alibaba benefits from China's economic rebound, possible regulatory relief, and ongoing share buybacks. With Chinese tech rotating back into favor, BABA could lead the rally.
So if you're still waiting for a signal - it's already here. The golden cross is done, price is flying above moving averages, and all that’s left is a clean breakout. Watch $122 — that’s the launchpad.

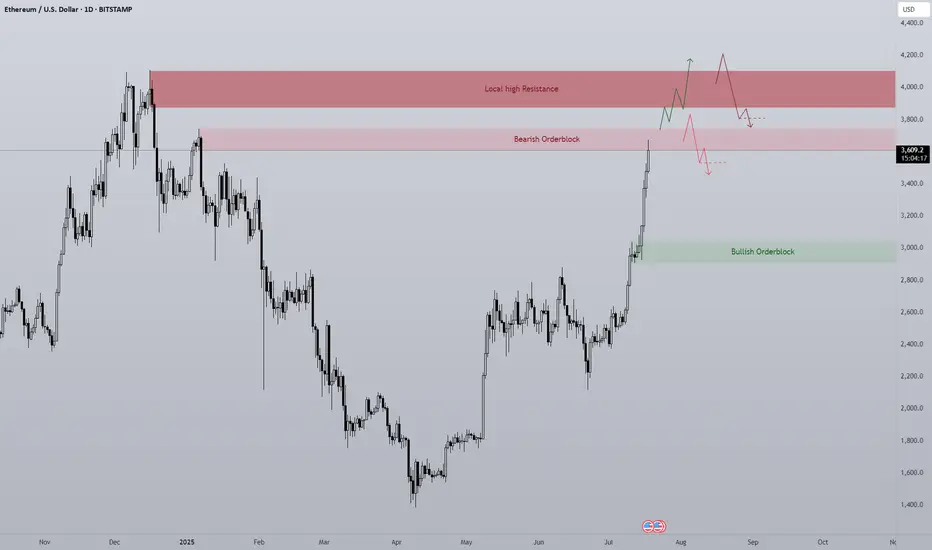
ETH 1D Overview Finally we are seeing altcoins regaining lost ground on Bitcoin and the second largest crypto by market cap is rallying strong.
Since ETH has such strength currently the opportunity to short is quite slim with high risk, however I think it's important to see where ETH may find some resistance or if a pullback was to happen, where would it come from?
The first level is the bearish orderblock level that has just been tapped as of writing. This area previously began the sell-off at the end of 2024 by confirming a new lower high. Naturally this area will present problems for the bulls and so a potential pullback could be initiated from this level. I would like to see a sweep of the stop loss positions just above the area and then a SFP to confirm the pullback is in motion.
Should the bearish orderblock fail the next clear level is the daily local top around $4000. A big even level and the area that started 5 months of downtrend. IMO the most likely level where longs will take profit. I do think if we see any form of consolidation between the bearish orderblock and the local high the bulls will look to carry the rally on, shallow pullbacks maintain momentum
Ten out of the last eleven days have been green candles with the only one day being red just above a key high, I expect if we are to get a pullback that bullish orderblock area ($2900-3000) to be retested as support. Therefor if any of the above areas initiate a pullback this area should provide support and therefor a long entry.
To clarify I am in no way bearish about Ethereum, this is just a plan for different eventualities.
Rob the Rally SPX500: Enter Before Resistance Catches You🦹♂️💰**“SPX500 Street Heist” – Thief-Style Robbery Plan for Bulls!**📈💸
(Powered by Thief Trader's Market Robbing Tactics – Scalp | Swing | Day Trade Edition)
🌍Hello, Global Money Hunters!
📣 Salaam, Bonjour, Ola, Hola, Hallo, Marhaba & Welcome to the heist floor! 🎩💼
Thief Trader is back again with a loaded plan to rob the market clean — this time targeting the mighty SPX500 / US500 🎯. Based on a fusion of technical setups, macro sentiment, and the Thief Trading System, we’ve set our sights on the next breakout vault of Wall Street.
🎯 The Gameplan – Heist the Resistance Vault
The index is entering a high-risk resistance barricade — overbought, consolidated, and heavily guarded by bearish robbers (sellers). This is the zone where the market police lurk and trend reversals often get triggered. However, smart thieves always plan with precision.
Here’s the mission briefing:
🔓Entry Zone (Break-in Point)
💥 “The vault is open — grab the bullish loot!”
Enter Long anywhere close to market price or on pullbacks near recent swing lows/highs.
Preferred timeframes: 15-min to 30-min for sniper-level accuracy.
Deploy DCA-style limit orders (layered entries for maximum control).
🛑Stop Loss (Escape Hatch)
Base SL on recent swing low candle wicks on the 4H timeframe.
Suggested: ~6250.00 — but adapt based on your risk appetite, lot size, and position stacking.
📈Target / Loot Location
🎯 Primary Take-Profit: 6450.00
Or… pull out early if you spot resistance fighters guarding the vault.
Use trailing SL to secure gains and manage getaway.
⚡Scalper’s Notice
Only Long-side allowed!
Got big capital? Jump in now.
Running low? Tag along with swing traders and follow the robbery protocol.
Always protect your bag with dynamic trailing stops.
🧠Fundamental Fuel Behind the Plan
Bullish sentiment across major indices
Macro trends, COT positioning, sentiment outlook, and intermarket analysis all greenlit
Geopolitical and Fed tone supportive — tap into real data before entering
👉 Always analyze: News, Fundamentals, Sentiment, COT reports, and macro conditions.
🚨NEWS ZONE ALERT – No Loud Moves!
Avoid entry during major economic news drops
Use trailing SLs to guard profits
Don’t let your open trades get caught in the chaos of news releases!
💥Let’s Boost the Thief Army!
Smash the BOOST button 💖 to power up the robbery crew.
Support the strategy, share the love, and stay ahead of the game using Thief Trading Style. Every trade is a step closer to freedom from financial traps. 🚀💰🎉
📌Disclaimer: This is a general market analysis for educational purposes and should not be considered personal financial advice. Please evaluate your own risk management strategy before placing trades.
📌Markets shift fast — stay flexible, stay alert, and always rob smart.
🔥Stay locked in for the next heist plan — Thief Trader signing off for now…
💸💼📈 Trade smart. Rob harder. 🤑🦹♂️📊

#USDJPY: Swing Buy Almost +2000 Pips! Dear Traders,
The USDJPY currency pair appears to be in an accumulation phase at the moment, as evidenced by the lack of significant price movement throughout the current week. Several factors contribute to this trend.
Firstly, several significant economic events are scheduled for this week, particularly tomorrow and Friday. These developments will have substantial implications for the future trajectory of the USDJPY pair. Consequently, there’s a possibility that the price may experience a decline before initiating a bullish trend. We’ve recently seen a strong bullish candle, which suggests a strong bullish move in the coming weeks. Additionally, the strong USD could continue rising, while the JPY is dropping.
Secondly, there are two primary areas where the price could reverse its course. The extent to which the USD reacts to the economic data will indicate potential reversal zones.
It’s crucial to conduct your own analysis before making any financial decisions. This chart should be used solely for educational purposes and does not guarantee any specific outcome.
Regarding the stop loss, as this is a swing trade, it’s advisable to employ a larger stop loss if the price reaches entry zones. The take profit level can be determined based on your entry type and analysis.
We wish you the best of luck in your trading endeavours and emphasise the importance of trading safely.
Please share this analysis with others through likes, comments, and social media platforms. If you have any questions or require further assistance, don’t hesitate to comment below. We’re here to provide support.
Team Setupsfx_
❤️🚀

EURUSD on the riseAfter Wednesday’s volatile spike, the market calmed down yesterday, with EURUSD holding above the support zone.
We’re seeing signs of a potential bottom forming — confirmation of this could open the door for a fresh move higher.
The goal remains to follow the bullish trend, but keep an eye out for signs of exhaustion and a possible pullback.
Stay flexible and ready to adapt!

3 month rally just not sustainable SPXThe economy is not doing horribly, but many are citing lagging indicators and there's signs of that this level is just not sustainable. Current levels abouve 9, 50, 200 SMAs! Seriously, what's great that isn't artificially propped up. Highest bankruptcies, highest level of housing unaffordability, dollar losing over 10% of value YTY, unemployment #s but that's bc people are giving up and it's a lagging indicator, hardship withdrawals up, defaults across the board up at over 10 year levels, banks with historic unrealized losses on their books (how much did Wells Fargo drop the other day!), yields going up up up. The Champage effect will end and many will get wiped out, unfortunately. Not being a dooms day person, but this economy is overheated and it's mostly driven by tech, which is over represented in the S&P. VIX is pretty low right now, would be an interesting play when it starts spiking (and it will!) when the deck starts falling apart.
Best of luck and always do your own due diligence.

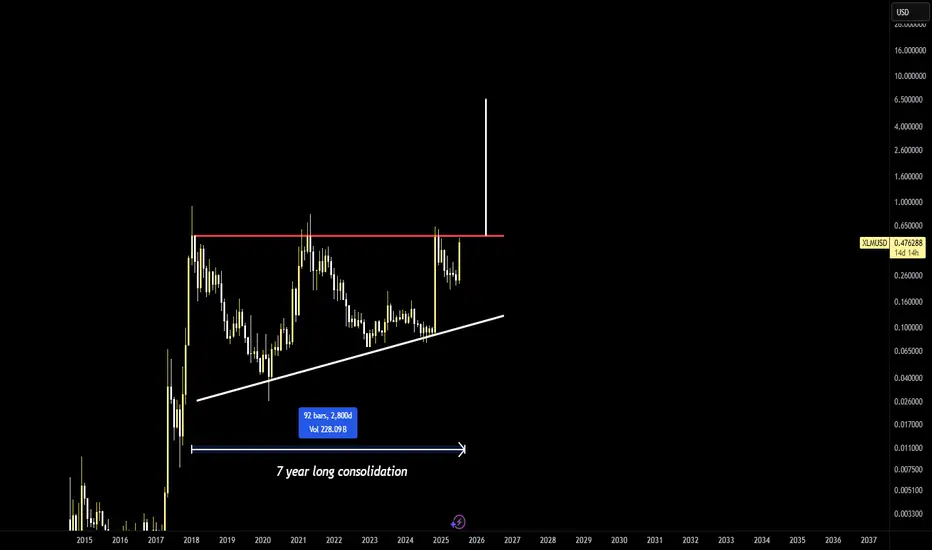
The one chart to rule them all - Stellar- the best looking setup in the crypto market
- the trade of the cycle
- as soon as monthly closes above resistance (red) XLM is likely to skyrocket higher, much higher
- with XLM recently acting as XRP beta, it is likely this move occurs once Ripple is comfortable above its 2017 high and heads to the triangle target of 10-12$
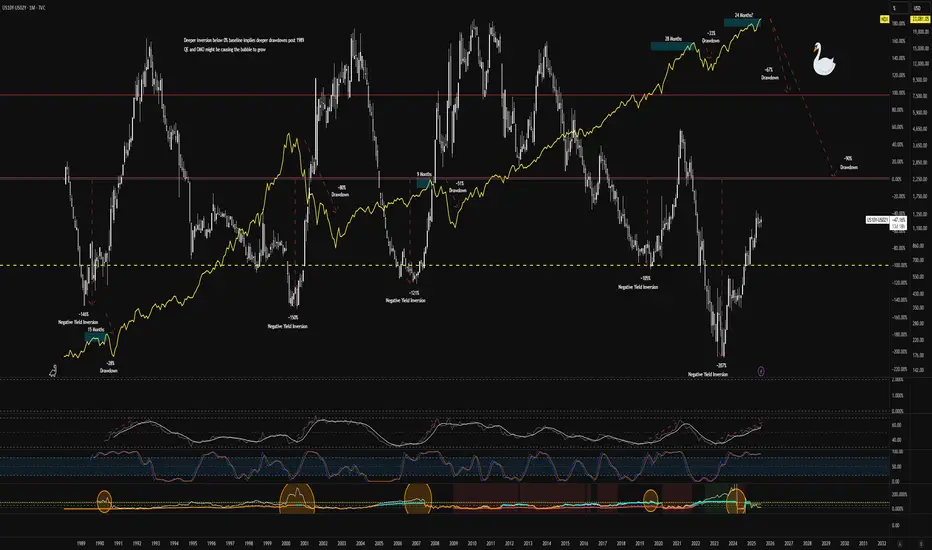
$NDX Black Swan Correlation of Variance from 0% of $US10Y $US02YIt appears that since 1989, deeper inversions of the yield curve have led to deeper drawdowns in the $NDX. Relative strength always appears to be in a steeper move upward coupled with fuzzy signals in volatility before the drawdown. Based on the previous market crashes, anything from a 60% to 90% drawdown appears to be plausible.
Currently buying long-expiry OTM put verticals across tech meme names (think NASDAQ:PLTR ) and potentially on some stalwart Mag7 tickers (maybe NASDAQ:META ) for pennies for potentially massive risk/reward paydays. Nothing more than a few grand, but I'm also long exposure to battery materials, hydrogen, and other energy plays. NASDAQ:ABAT NASDAQ:PLUG AMEX:WWR NYSE:LAC NASDAQ:ENVX NYSE:CHPT AMEX:LEU NYSE:SMR
Best of luck.
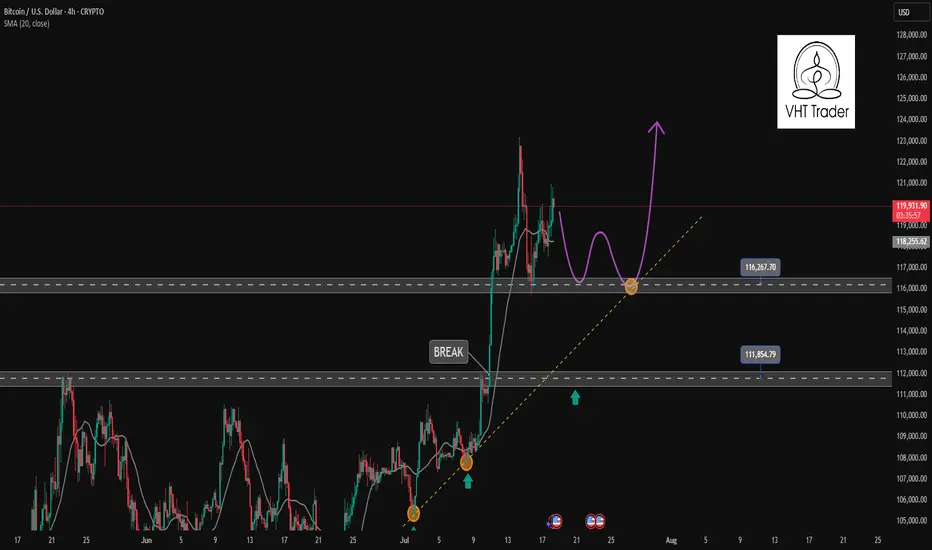
Find a recovery point to continue buying BTC✏️ CRYPTO:BTCUSD is trading near the all-time high. The trading strategy is to wait for some investors to take profit so that the price can return to the nearest support zones and continue to buy to the new all-time high zones.
📉 Key Levels
BUY Trigger: confirms the recovery from the support trend line 116000
BUY zone 112000 (Strong support zone)
Target 129000
Leave your comments on the idea. I am happy to read your views.
GBPJPY - 1D SetupThe Japanese yen may get stronger for a while due to the weakening of the British Economy, which may lead to a pullback of the GBPJPY currency, and this seems to be a good trading opportunity in sells with a strict stop-loss. OANDA:GBPJPY
Note- This is my own view and not a financial advice as trading comes with high risk.

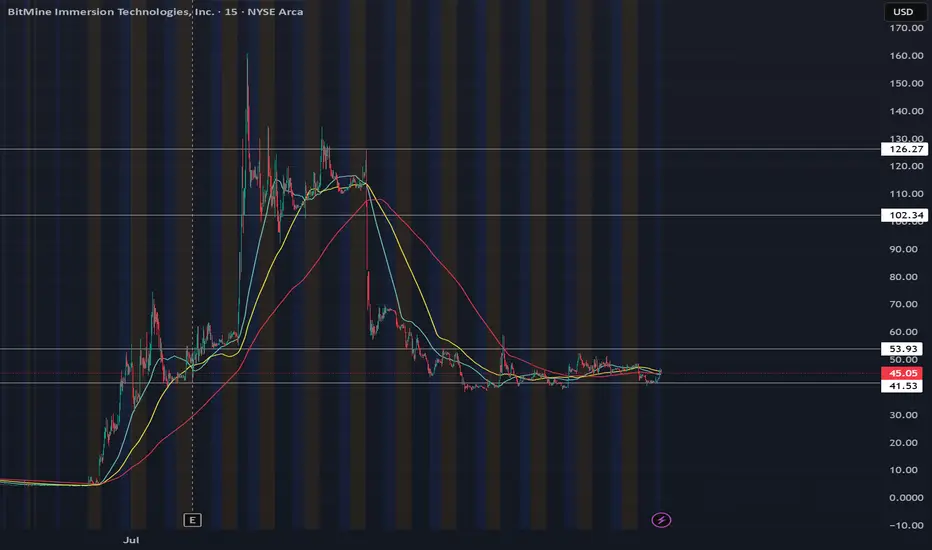
BACK TO 100Bought shares today at close new legislation is going to send this sky high. BMNR just may actually be the MSTR of ETH with the players they have. SBET BTBT COIN all will do great, but BMNR currently holds the lead for largest ETH treasury. Maybe more chop to average shares but this will be going SOON. As long as the daily RSI is above 50, we should be holding local support until breakout of this is accumulation zone.
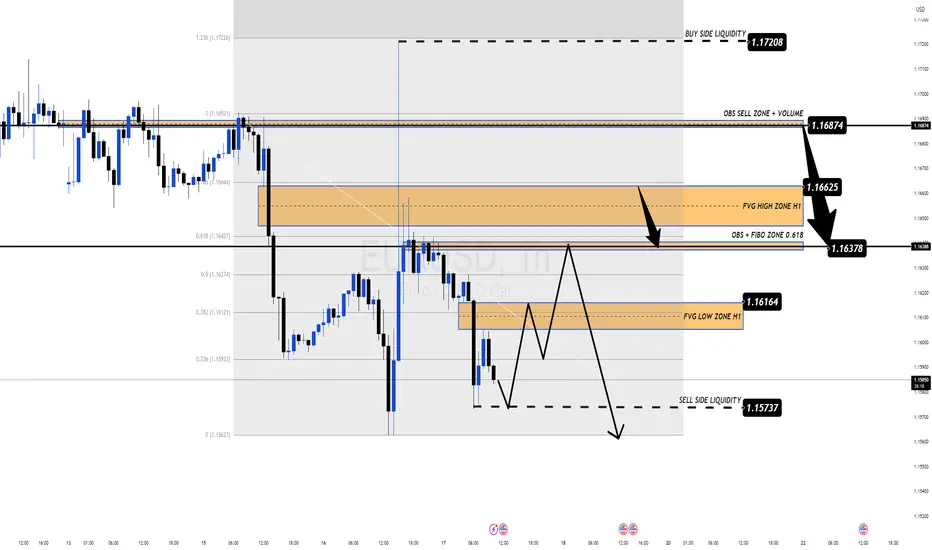
EUR/USD Forecast – Bears in Control Ahead of US Jobless DataEUR/USD Forecast – Bears in Control Ahead of US Jobless Data
🌐 Macro View: Dollar Regains Strength Amid Uncertainty
EUR/USD remains under selling pressure as the greenback finds renewed strength following midweek weakness. The market is bracing for fresh U.S. jobless claims data, expected to show a slight rise to 235K. A print below 220K could reignite USD demand, while a surprise above 240K may offer a temporary lifeline for the euro.
Amid geopolitical and economic turbulence, the euro continues to underperform as investors shift to the dollar for safety and yield advantage.
📉 Technical Outlook – MMF & Smart Money Perspective
The recent breakdown below 1.1600 confirms the bearish momentum. Based on the MMF (Market Momentum Flow) methodology, price action is currently moving within a controlled distribution structure, suggesting further downside potential.
Key zones identified from H1 structure:
OBS + FVG High Zone (1.1662 – 1.1687): Strong supply zone + volume imbalance.
1.1637: Mid-key level and possible liquidity magnet.
1.1616 – 1.1573: Ideal area for sweeping sell-side liquidity before any sustainable bounce.
If price reclaims 1.1662, intraday bullish correction may be in play. However, as long as 1.1687 holds, bears remain in control.
🧭 Trade Plan for Today
🔴 SELL ZONE: 1.1662 – 1.1687 (FVG + OBS Volume Zone)
SL: 1.1710
TP: 1.1637 → 1.1616 → 1.1590 → 1.1573
✅ Preferred entry zone aligned with high-volume imbalance & MMF rejection pattern.
🟢 BUY ZONE (Scalp Only): 1.1575 – 1.1580 (Sell-side Liquidity Zone)
SL: 1.1550
TP: 1.1612 → 1.1630 → 1.1645
⚠️ Use with caution — only upon clear price reaction at lower liquidity sweep area.
🔍 Strategy Insight
This is a classic scenario of a controlled pullback within a larger bearish structure. Patience is key — let price tap into imbalanced zones before executing. Given today's U.S. data, volatility may spike during the New York session, so risk management is crucial.
💬 What’s Your Take?
Do you expect EUR/USD to retest the 1.1550s zone, or could a surprise from U.S. job data flip the narrative?
👇 Drop your analysis below & follow for more MMF-based setups.
Today's GOLD Analysis (MMC) – Bullish Momentum Building Ahead🔍 Market Overview:
Gold is currently showing signs of a bullish reversal structure after experiencing a downward correction. Price action has reacted strongly from well-defined demand zones, suggesting institutional buying activity at key levels. The current setup highlights a clear accumulation phase transitioning into a potential markup phase, driven by buyers regaining control.
🧱 Chart Structure Breakdown:
1️⃣ Initial Channel Formation (Left Side of Chart)
After a major downtrend, price began consolidating within a rising channel, indicating a retracement or correction phase.
This ascending channel showed a short-term bullish effort, but eventually broke to the downside, resuming the dominant bearish flow temporarily.
2️⃣ Previous Reversal Zone ($3,312 – $3,322)
This is the origin of the recent bullish move, where price strongly reversed after heavy selling.
The reversal formed a long bullish wick and an engulfing candle—clear signs of buying absorption.
This level has historical confluence, acting as both support and prior demand.
3️⃣ Mini SR - Interchange Zone ($3,327 – $3,335)
This zone is a mini structure level where previous resistance has now become support (SR Flip).
The area acted as a platform for the recent bullish reaction.
This zone also aligns with the interchange of order blocks, adding more confluence to the bullish argument.
4️⃣ Bullish Pattern Formation
Price formed a micro double bottom/inverse head and shoulders structure just above the Mini SR.
The pattern suggests strong base-building and provides momentum for the current bullish move.
Confirmation came after the neckline breakout and retest within the Central Zone.
5️⃣ Central Zone ($3,340 – $3,345)
This is an intraday pivot area, acting as a decision-making zone between buyers and sellers.
Price is currently testing this zone with strong bullish candles.
A clean break above this level increases the probability of further upside.
6️⃣ Reversal Zone 1 ($3,345 – $3,353) – ✅ Condition 1
Price is now entering this zone, where previous price rejections occurred.
If buyers can maintain momentum and break above this zone on strong volume, it will validate the bullish continuation thesis.
This zone is also an ideal area to monitor for partial profit-taking or potential short-term rejection.
7️⃣ Reversal Zone 2 ($3,365 – $3,375) – ✅ Condition 2
This is the next significant resistance block.
If price reaches this level, it could face heavy resistance and profit-booking from swing traders.
However, a breakout above this zone could lead to a much larger bullish wave, targeting $3,390+.
🎯 Trade Setup Idea:
Long Bias: Above $3,335 with targets at $3,353 (TP1) and $3,370 (TP2)
Risk Invalidation: Break below Mini SR zone ($3,327) may invalidate bullish thesis
Aggressive Entry: At retest of Mini SR after pattern breakout
Conservative Entry: On breakout and close above Reversal Zone 1 with confirmation
🧠 Trader’s Mindset:
The market is showing a clear shift in momentum, but buyers must sustain control above key levels.
Stay patient at resistance zones; avoid chasing.
Watch for rejection wicks or bearish divergence near Reversal Zone 2 if you're looking for a counter-trade.
📌 Summary:
📈 Bias: Bullish (as long as $3,335 holds)
💡 Opportunity: Breakout from Mini SR with structure support
📉 Risk: Failure to hold central zone could trigger retest of lower support
🚀 Potential: If momentum continues, gold could revisit July highs near $3,390–$3,400
