SOLUSDT → Countertrend correction and hunt for liquidityBINANCE:SOLUSDT looks quite promising on the bullish side. The price is testing one of the key resistance levels within the local trend rally. A correction is forming. Is it beneficial for us?
On the higher timeframe, we see a change in character, a breakout of the trend resistance, and the formation of an upward trend support line. Bitcoin is still bullish (locally) at this time, but it is consolidating, which generally provokes a correction in SOL as well. Focus on the 150-149 area. If the bulls are able to keep the price above this zone after the retest, followed by the formation of momentum, this can be considered a positive medium-term sign.
Locally, the price within the trading range of 149.36 - 158 is heading towards the area of interest and liquidity (eql) at 149.36. The current sell-off is most likely triggered by a large player seeking a more favorable entry into the market.
Resistance levels: 154.75, 156.8
Support levels: 149.36, 147.93
In the current situation, it makes the most sense to consider an intraday trading strategy. A countertrend correction and a retest of support could attract buyers...
Best regards, R. Linda!
Fundamental Analysis

Learn the 3 TYPES of MARKET ANALYSIS in Gold Forex Trading
In the today's post, we will discuss 3 types of analysis of a financial market.
🛠1 - Technical Analysis
Technical analysis focuses on p rice action, key levels, technical indicators and technical tools for the assessment of a market sentiment.
Pure technician thoroughly believes that the price chart reflects all the news, all the actions of big and small players. With a proper application of technical strategies, technical analysts make predictions and identify trading opportunities.
In the example above, the trader applies price action patterns, candlestick analysis, key levels and 2 technical indicators to make a prediction that the market will drop to a key horizontal support from a solid horizontal resistance.
📰2 - Fundamental Analysis
Fundamental analysts assess the key factors and related data that drive the value of an asset.
These factors are diverse: it can be geopolitical events, macro and micro economic news, financial statements, etc.
Fundamental traders usually make trading decision and forecasts, relying on fundamental data alone and completely neglecting a chart analysis.
Price action on Gold on a daily time frame could be easily predicted, applying a fundamental analysis.
A bearish trend was driven by FED Interest Rates tightening program,
while a strong bullish rally initiated after escalation of Israeli-Palestinian conflict.
📊🔬 3 - Combination of Technical and Fundamental Analysis
Such traders combine the principles of both Technical and Fundamental approaches.
When they are looking for trading opportunities, they analyze the price chart and make predictions accordingly.
Then, they analyze the current related fundamentals and compare the technical and fundamental biases.
If the outlooks match , one opens a trading position.
In the example above, Gold reached a solid horizontal daily support.
Testing the underlined structure, the price formed a falling wedge pattern and a double bottom, breaking both a horizontal neckline and a resistance of the wedge.
These were 2 significant bullish technical confirmation.
At the same time, the escalation of Israeli-Palestinian conflict left a very bullish fundamental confirmation.
It is an endless debate which method is better.
Each has its own pros and cons.
I strongly believe that one can make money mastering any of those.
Just choose the method that you prefer, study it, practice and one day you will make it.
❤️Please, support my work with like, thank you!❤️
I am part of Trade Nation's Influencer program and receive a monthly fee for using their TradingView charts in my analysis.

Overtrading – The Silent Threat to Consistent PerformanceTrader Psychology | Part 1: Overtrading – The Silent Threat to Consistent Performance
In trading, more does not mean better. One of the most common and damaging psychological pitfalls traders fall into is overtrading — executing too many trades, often without clear setups, simply to stay active in the market.
It’s subtle, it feels productive… but it quietly erodes both your capital and your discipline.
💡 What Is Overtrading?
Overtrading occurs when a trader opens excessive positions, often outside of their strategy or plan. It’s driven by emotions rather than logic, and usually shows up in one of the following forms:
Taking trades without confirmation
Trying to "make back" previous losses (revenge trading)
Forcing trades during low-volume market conditions
Trading simply out of boredom or anxiety about missing out
It’s not just about the number of trades — it’s about why you’re taking them.
⚠️ How to Know You're Overtrading
You're entering trades that don’t meet your criteria
You feel uncomfortable not having an active position
You trade aggressively after a loss
You switch strategies frequently
Your trading feels more like activity than decision-making
You’re losing more in fees/spread than on price movement
🧠 Why Overtrading Happens
🔹 The Need to Be "Active"
Traders often equate activity with productivity. But the truth is, patience is a trading skill — doing nothing is sometimes the most profitable move.
🔹 Pressure to Perform Daily
Some traders feel they must generate daily profits. This mindset leads to forcing trades during uncertain or low-probability conditions.
🔹 Overconfidence After Wins
A short winning streak can create the illusion of control, pushing traders to increase frequency and risk — usually without real setups to back it up.
🔻 The Cost of Overtrading
Rapid Drawdowns: Frequent small losses and transaction costs add up quickly
Emotional Fatigue: Decision-making becomes reactive instead of rational
Loss of Trust in Your System: Not because the system failed — but because it wasn’t followed
Increased Costs: Spreads, commissions, and swaps eat into your margin
Overtrading doesn’t just hurt your balance. It damages your confidence, focus, and mental capital.
✅ How to Stop Overtrading – Practical Fixes
1. Set a Daily Trade Limit
Commit to a maximum number of trades per session (e.g., 2–3 trades). This forces you to wait for the best opportunities.
2. Track Your Trades in a Journal
Log each trade: the setup, your reasoning, emotions, and outcome. Over time, this reveals emotional patterns and helps you regain discipline.
3. Trade Only During Key Market Hours
Avoid trading during illiquid sessions. Focus on London and New York overlaps, where structure and volatility are present.
4. Accept That Flat Is a Position
Not being in a trade is often a smart decision. Staying out preserves capital and prepares you for higher-probability setups.
🎯 Final Thoughts
Overtrading is not a technical flaw — it’s a psychological leak.
If you want longevity in this game, you must master more than charts — you must master yourself.
“The market doesn’t reward activity. It rewards patience, precision, and emotional control.”
Next time you feel the urge to trade "just because" — pause, breathe, and ask yourself: Is this trade part of my edge?
📌 Coming Up Next:
Trader Psychology | Part 2: FOMO – Why Fear of Missing Out Can Destroy Good Traders
🔔 Follow this profile to be notified when the next chapter is live.

NQ: Upcoming Weekly analysis!FA Analysis:
1- Tariff On/Off: The noise will continue this week as well. Europe will be the target this week.
Uncertainty OR Eternity pause? Market might tend towards Eternity pause which is positive for stocks and equities.
2- New Earnings season: This will be on the driver seat for the next few weeks. Positive earnings for major stocks will impact positively NQ and vice-versa.
3- Macroeconomic data:
CPI and PPI will be relevant for July rate cut. Lower and inline inflation will be very good for July Rate cut; hence very good for Equities. Higher inflation data will be bad.
Also, Consumer sentiment and Inflation expectations, later in the week, will be very relevant.
So from FA Analysis, US equities might go either direction based on data outcomes.
TA Analysis:
Weekly TF: Direction is Buy!
The weekly close was irrelevant; it was inside the bullish green candle. Price must break and close below or above the master weekly candle to establish clear direction.
So nothing to trade from weekly perspective.
Daily TF: Direction is Neutral!
Same as weekly TF, we got an irrelevant daily close, inside the previous daily green candle (red dotted lines).
Price must break and close either below or above the dotted red lines for a clear direction.
Hourly TF: Direction is Neutral!
Based on the Weekly and Daily TF, clearly price is consolidating and looking for FA data to make decision on the next move.
Price is making LL-LH-HL-HH... and switching from one side to another reinforcing the consolidation.
Here are two scenarios:
Scenario 1: Good earnings, macroeconomic data and lower inflation will trigger a new ATH.
Scenario 2: Bad earnings, macroeconomic data and higher inflation will trigger a retrace.
Happy green week!

$BAKE Trailing STOPHere is yet another trade on BYBIT:BAKEUSDT.P that pained me.
Not only that I followed it through the breakouts, I ate from the breakout after forming a rising wedge.
Then, I followed a ride back up immediately and had a sumptuous run too but when it started rallying and it was time for bed, I set a trailing stoploss to protect my profit. This stopped me out early before this major move Up.
I’m not angry as much because I protected not just my capital but profit.
But I’m still angry I didn’t win with the move that I foresaw.

$RAYDIUMI pleaded for this trade to pick my entry but it refused.
It hurts to see your prediction play out without getting you some $$$
I am patient and I respect my discipline alot.
I am either making profit or I'm saving my capital.
No two ways!!!

$SYRUP TRADE, BULLISH?This is my setup for the BYBIT:SYRUPUSDT.P trade. having respected the previous Trendlines, i would expect same with higher target.
I have set my target between the higher trendline and lower trendline of the support.
I'm afriad I won't be picked but if the trades gets me into the trade, then I'll feed good.
I'm nearly certain!
#NFA #DYOR

GOLD → Retest of consolidation resistance. Breakout?FX:XAUUSD is consolidating in a symmetrical triangle pattern. The price is stabilizing amid a falling dollar and uncertainty...
Gold is recovering after falling to $3,283 thanks to a weaker dollar and lower bond yields amid concerns over Trump's new tariff threats. The announced tariffs against seven countries, including Brazil and the Philippines, have heightened tensions, partially offsetting the Fed's hawkish signals. Markets are now awaiting new data from the US and speeches by Fed officials, which could influence the further dynamics of gold.
Technically, gold is squeezed between the resistance and support of a symmetrical triangle. The price is being aggressively pushed away from support within a bullish trend, but at the same time, gold is testing resistance for the fifth time, which only increases the chances of a breakout.
Resistance levels: 3330, 3345, 3358
Support levels: 3308, 3295
If gold continues to storm the local resistance at 3330 and the triangle resistance during consolidation, we will have a good chance of catching the breakout and growth. An additional scenario could be growth after a shake-up of the triangle support and the global trend.
Best regards, R. Linda!

Soybeans Loading a Bounce? Demand Zone + COT1. Price Action & Technical Structure
Price has bounced off a strong daily demand zone (1011–969).
Today’s daily candle shows a clear rejection wick from the low, and RSI is signaling a potential reversal.
The market is trading inside a falling channel, currently near the lower boundary — setting up a possible breakout move.
Technical Targets:
• First upside target: 1039–1049
Invalidation: daily close below 990, which would confirm structural breakdown.
2. COT Report – Soybeans Futures (as of July 9, 2025)
• Non-Commercials:
+11,539 spreads | +7,017 shorts | –7,520 longs → Slight bearish pressure, though spreads suggest growing speculative complexity.
• Commercials:
+7,876 longs | –9,084 shorts → Moderate commercial bullish bias.
• Open Interest:
+8,076 contracts → Market activity increasing.
Overall COT positioning is neutral to slightly bullish, with growing signs of accumulation around the 1000 level.
3. Seasonality – MarketBulls
Historically, July is one of the weakest months for Soybeans:
• –44.82 (20Y avg)
• –36.86 (15Y avg)
• –34.74 (10Y avg)
However, early August shows signs of seasonal recovery, and price action is already diverging from typical seasonal behavior.
This makes a deeper breakdown less likely — we could be nearing the end of the seasonal weakness.
Operational Takeaway
Current Bias: Neutral-to-Bullish
Confluence of signals supports the idea of a technical rebound:
✅ Bullish reaction candle in demand
✅ Fibonacci support + lower trendline touch
✅ COT data stabilizing with rising open interest
✅ Seasonal weakness possibly exhausted

EURJPY Hits Supply | Pullback Is ComingPrice has entered the daily supply zone (red area) between 170.80 and 171.80, showing immediate rejection with a long upper wick — a signal of potential short-term bearish reaction.
The RSI is turning lower, indicating loss of momentum, although it hasn’t reached extreme levels yet.
The current map suggests a technical pullback toward the 169.40–168.50 zone (FVG + dynamic support) before any potential bullish continuation toward 174+.
The overall structure remains bullish, but a correction looks likely due to technical exhaustion and retail positioning.
📊 2. COT Report (JPY Futures – as of 2025-07-01)
Non-Commercials (speculators) reduced long positions on the JPY by -7,779 contracts, and also slightly trimmed shorts → clear sign of position reduction.
Net positioning remains strongly negative (JPY weakness), but it's starting to recover slightly.
Commercials added both longs (+2,830) and shorts (+5,977), indicating indecision but growing interest.
Open interest slightly decreased (–516), though it remains elevated.
👉 The market has not yet reversed, but the JPY downtrend may be approaching exhaustion.
🧠 3. Retail Sentiment
86% of retail traders are short EUR/JPY — a strong contrarian bullish signal.
Average retail short entry: 166.27, while current price is 171.55 → retail traders are trapped and under pressure.
A short squeeze is likely underway or already completed, increasing the risk of a technical correction after distribution.
📅 4. Seasonality
July is historically weak for EUR/JPY:
20Y: -0.35
15Y: -0.49
10Y: -0.18
August tends to be even worse from a seasonal perspective.
This supports the idea of a potential pullback in the coming days or weeks.
Trading Conclusion
Current Bias: Short-term Neutral–Bearish, Medium-term Bullish.
✳️ Potential pullback from 172.30 toward 169.40–168.50
🎯 If price holds and builds clean bullish structure, expect continuation toward 174.00–175.00
❌ Invalidation on daily close below 167.80

EUR/USD Reversal Ahead? COT + DXY Strength Signal Price has broken below the ascending channel that started in mid-May.
The current candle is rejecting the weekly supply zone (1.17566–1.18319), leaving a significant upper wick.
Daily RSI is losing strength but has not yet reached extreme levels.
A key daily Fair Value Gap (FVG) lies between 1.1600 and 1.1480, with the first potential downside target at 1.14802, which aligns with support and the FVG zone.
A deeper bearish continuation could push price towards 1.1350, but only if the FVG lows are clearly broken.
📊 COT Data (CME - Euro FX & USD Index)
Euro FX
Net long: +15,334
Commercials increased both longs (+13,550) and shorts (+9,913) → mild divergence.
Non-Commercials (speculators) increased shorts (+4,786) more than longs (+1,188) → speculative bias tilting bearish.
USD Index
Strong net long accumulation across all trader types: +4,597 net.
Non-Commercials added +3,590 longs, with only a minor increase in shorts.
→ USD strength continues, reinforcing potential weakness in EUR/USD.
🧠 Retail Sentiment
67% of retail traders are short EUR/USD → typically a contrarian bullish signal.
However, the price is already showing distribution, not accumulation, so we may see price push lower first to trap remaining retail longs, invalidating the contrarian signal in the short term.
📅 Seasonality
July is historically bullish, especially on the 2Y (+0.0142) and 10Y (+0.0106) averages.
However, the 15Y and 20Y averages show a much more moderate performance (+0.007 / +0.0025).
Based on current price action, the seasonal rally may have already played out with the run-up to 1.1830. A correction now seems likely, even if the broader macro remains supportive mid-term.
🧩 Conclusion
Despite historically bullish seasonality for July, both price action and COT data indicate distribution with early signs of reversal.
Retail sentiment is too skewed short for a major breakdown just yet, but the technicals support a short-term pullback toward more balanced levels.
USD strength from COT and DXY structure reinforces a corrective short bias for now.

EURAUD Breakdown Incoming? Price + COT + Seasonality🧠 MACRO & INSTITUTIONAL FLOWS (COT)
EURO (EUR)
Strong increase in net long positions by non-commercials: +16,146
Commercials also added long exposure: +25,799
Bias: moderately bullish
AUSTRALIAN DOLLAR (AUD)
Non-commercials remain heavily net short (long/short ratio: 15% vs 63.6%)
Slight increase in commercial longs: +2,629
Bias: still bearish, but showing early signs of positioning exhaustion
COT Conclusion: EUR remains strong, AUD remains weak — but the recent extension calls for caution on fresh EURAUD longs.
📊 SEASONALITY (JULY)
EUR shows historically positive July performance across 2Y, 5Y, and 10Y averages
AUD also shows mild strength, but less consistent
🔎 Net differential: No strong seasonal edge on EURAUD in July
📈 RETAIL SENTIMENT
54% of retail traders are short EURAUD, 46% long
Slight contrarian bullish bias, but not extreme yet → neutral to slightly long
📉 TECHNICAL STRUCTURE – MULTI-TIMEFRAME
1. Weekly Chart
Strong bearish engulfing candle after 4 weeks of upside
RSI dropped below 50 → clear momentum shift
1.7960–1.8100 is now a liquidity zone that’s been tapped
2. Daily Chart
Confirmed break of the ascending channel formed since May
Price reacted from demand zone around 1.7460–1.7720, signaling potential pullback
Watch for rejection around 1.7910 (50% body of the weekly engulfing candle)
3. Entry Setup
Key area for short entries: 1.7910–1.7940
This zone aligns with:
✅ Former support now turned resistance
✅ Inside a valid bearish order block
✅ Ideal retracement level (50% engulfing body)
🎯 OPERATIONAL CONCLUSION
While the macro context still favors a stronger EUR against AUD, price action tells another story.
The weekly engulfing candle is a strong technical reversal signal, and the daily structure confirms the break.
→ Shorting the pullback into 1.7910–1.7940 could offer an excellent R/R trade setup.
Bias: Short-term bearish – Targeting 1.7700, 1.7550, and potentially 1.7315
Invalidation: Daily close above 1.8040

EURUSD LONG The dollar is looking to fall hard as the euro continues to gain we still see the market long on the euro in terms of institutions etc. we had a weak push to the downside and have now met trend line resistance will be interesting to see what happens from here . The trade isn’t perfect yet but this is what I’m looking at so far .

Bitcoin DominationHistorical cycle data on the indicator points to the possible end of bitcoin's dominance growth. This may indicate the beginning of capital reallocation in favor of altcoins. At least until May 7 we will have a short-term altcoin season, but if we are lucky, even until the end of May.
⚠️ Caution Amid Geopolitical Factors
While a temporary altcoin season may be on the horizon, it's essential to consider broader economic factors. Ongoing trade tensions, particularly involving the U.S., could introduce volatility into the markets. Such geopolitical uncertainties might render the current altcoin rally a bull trap, with potential downturns in the summer months.

USD/JPY - H1- Wedge Breakout (07.07.2025)The USD/JPY pair on the H1 timeframe presents a Potential Buying Opportunity due to a recent Formation of a Wedge Breakout Pattern. This suggests a shift in momentum towards the upside and a higher likelihood of further advances in the coming hours.
Possible Long Trade:
Entry: Consider Entering A Long Position around Trendline Of The Pattern.
Target Levels:
1st Resistance – 148.00
🎁 Please hit the like button and
🎁 Leave a comment to support for My Post !
Your likes and comments are incredibly motivating and will encourage me to share more analysis with you.
Best Regards, KABHI_TA_TRADING
Thank you.
Disclosure: I am part of Trade Nation's Influencer program and receive a monthly fee for using their TradingView charts in my analysis.

GBP/USD - H1- Bearish Flag (07.07.2025)The GBP/USD Pair on the M30 timeframe presents a Potential Selling Opportunity due to a recent Formation of a Bearish Flag Pattern. This suggests a shift in momentum towards the downside in the coming hours.
Possible Short Trade:
Entry: Consider Entering A Short Position around Trendline Of The Pattern.
Target Levels:
1st Support – 1.3520
2nd Support – 1.3460
🎁 Please hit the like button and
🎁 Leave a comment to support for My Post !
Your likes and comments are incredibly motivating and will encourage me to share more analysis with you.
Best Regards, KABHI_TA_TRADING
Thank you.
Disclosure: I am part of Trade Nation's Influencer program and receive a monthly fee for using their TradingView charts in my analysis.

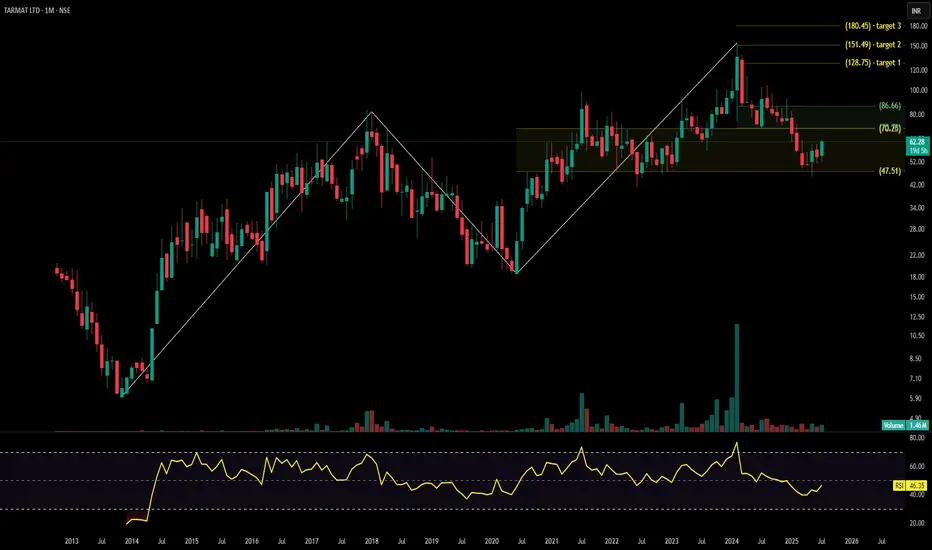
TARMAT LTDTarmat Ltd. is a mid-cap infrastructure development company specializing in engineering, procurement, and construction (EPC) of roads, highways, bridges, and airports. Operating across multiple Indian states, it works with government agencies and defense sector clients. The stock is currently trading at ₹62.28, showing signs of base formation with volume expansion and a well-defined Fibonacci breakout structure.
Tarmat Ltd. – FY22–FY25 Snapshot
Sales – ₹150 Cr → ₹178 Cr → ₹195 Cr → ₹215 Cr – Gradual revenue growth with stable order execution
Net Profit – ₹6.2 Cr → ₹7.5 Cr → ₹9.0 Cr → ₹10.6 Cr – Margin visibility improving with better project mix Company Order Book – Moderate → Moderate → Strong → Strong – Increasing inflow from central and state contracts Dividend Yield (%) – 0.00% → 0.00% → 0.00% → 0.00% – No payouts, reinvestment-focused approach
Operating Performance – Weak → Moderate → Moderate → Moderate – Cost efficiency gains visible
Equity Capital – ₹15.52 Cr (constant) – Stable ownership structure
Total Debt – ₹42 Cr → ₹40 Cr → ₹37 Cr → ₹34 Cr – Deleveraging in progress Total Liabilities – ₹89 Cr → ₹96 Cr → ₹103 Cr → ₹109 Cr – Aligned with order book expansion
Fixed Assets – ₹33 Cr → ₹35 Cr → ₹38 Cr → ₹41 Cr – Controlled capex, capacity-based investments
Latest Highlights FY25 net profit rose 17.7% YoY to ₹10.6 Cr; revenue increased 10.3% to ₹215 Cr EPS: ₹6.83 | EBITDA Margin: 14.6% | Net Margin: 4.93% Return on Equity: 13.52% | Return on Assets: 7.64% Promoter holding: 55.18% | Dividend Yield: 0.00% Recent order wins in Maharashtra, Karnataka, and airport runway expansion projects Improved cost controls and execution pace supporting profit momentum
Institutional Interest & Ownership Trends Promoter holding has remained stable at 55.18%, showing confidence in long-term strategy. Institutional interest is picking up post Q4 FY25 results, with DIIs adding 0.8% stake in April 2025. No signs of dilution or pledging activity observed. Overall ownership structure remains lean, and recent delivery volumes suggest selective accumulation by mid-cap trackers.
Business Growth Verdict Yes, Tarmat is showing promising signs of infrastructure-driven growth Margins and asset turnover improving steadily Debt profile is conservative and manageable Capex strategy is paced with execution capabilities
Company Guidance Management expects moderate revenue growth in FY26 with stable margins, supported by a healthy project pipeline. No major capex planned beyond routine equipment upgrades.
Final Investment Verdict Tarmat Ltd. offers a value-focused opportunity in India’s infra build-out cycle. The company’s small but stable base, growing order book, and improving margins suggest credible bottom-line visibility. While topline growth remains moderate and dividend payouts are absent, the low equity dilution, rising contract inflow, and renewed institutional interest make it an attractive candidate for staggered accumulation by investors seeking infra exposure in the mid-cap segment.
Xauusd Up Gold stabilizes near $2,030, eyes on FOMC Minutes
Gold clings to marginal daily gains at around $2,030 on Wednesday after closing the first two days of the week in positive territory. The benchmark 10-year US Treasury bond yield edges lower ahead of FOMC Minutes, helping XAU/USD hold its ground.
From a technical perspective, sustained strength and acceptance above the 50-day SMA will set the stage for an extension of the recent recovery from the $1,984 region, or a two-month low touched last week. Given that oscillators on the daily chart have been gaining positive traction, the Gold price might then accelerate the positive move towards an intermediate hurdle near the $2,044-2,045 region en route to the $2,065 supply zone.
Gold now 2028
Target 2032
Target 2036
Target 2050
Target 2059
SL 2015
FOMC signal confirm

Gold #gold god currency
Doesn't restore to earthly realm default i.e safe heaven (haven)🌠
RALLY & correction
🪽Trade wars
✒️ Tariffs threat's stocks
🪽Geopolitics war's i.e rising lion
✒️ Loose confidence fiat & bond
🪽 Inflation concern i.eFed talk
🪽 central banks buying gold i.e french bank
✒️ Institution money invested in gold
Technical analysis
☄️
H/H $3500
L/L $2828
#intergalactic
💌Trend line Support
$3285
$3245
$3120 @gold_pullback
$2958
$2828
Rally I $2536
Rally base $2958
Rally II. $2958 to $3500
🔗Swings
A trend is over if recent swing is beyond/below previous swing
Bullish continuation patterns
🌻$3360 swing high
🌻$3245 swing low
🍁 #Bullish flag 🏁support $3285
🌻$3450 swing high
🌻$3245 swing low
🦸 bullish falling 🌠 wedge

NY Model Triple Confluence Buy GoldHello Traders! This video speaks on the most recent NY Model that was a great trade idea for this week.

$UBER: Why $UBER Is a Robotaxi WinnerUber is on the verge of a major transformation, with robotaxis set to become a game-changing profit engine.
Technical charts indicate we can enter a long position today with low risk, while aiming for a long term rally resumption from here. Monthly and quarterly timeframe Time@Mode trends are bullish, suggesting price can reach heights between $111, $176 and $265 per share long term.
Here’s why the future looks bright for Uber investors from a fundamental perspective:
The global robotaxi market is projected to surge from $0.4B in 2023 to $45.7B by 2030, with Uber aggressively expanding its autonomous fleet in the U.S. and Europe through partnerships.
Uber’s approach is to integrate autonomous vehicles from partners (Waymo, May Mobility, Momenta, Avride, Volkswagen) into its platform, avoiding the massive costs and risks of building its own AVs.
Autonomous vehicles will slash Uber’s largest expense -driver payments- unlocking higher margins and scalability. CEO Dara Khosrowshahi calls AVs Uber’s “greatest future opportunity” for profit expansion.
Robotaxi pilots are already live in cities like Austin, with plans to expand to Atlanta, Dallas, and Europe by 2026. The average Waymo vehicle on Uber is busier than 99% of human drivers, showing strong demand and efficiency.
Uber’s core business is robust: Q1 2025 gross bookings up 14% to $42.8B, net income of $1.8B, and adjusted EBITDA up 35% to $1.9B. This profitability funds AV investments without sacrificing financial health.
Uber is uniquely positioned to lead the robotaxi revolution, leveraging its platform, partnerships, and financial strength. As AVs scale, expect a step-change in profitability and long-term shareholder value.
Best of luck!
Cheers,
Ivan Labrie.

Profit takingThe structure in the S&P 500 daily chart implies profit taking on Friday. The expectation is there will not be dramatic selling on Monday. It is important to keep in mind a broader structure is a potential double top which could present a long-term high for this market.

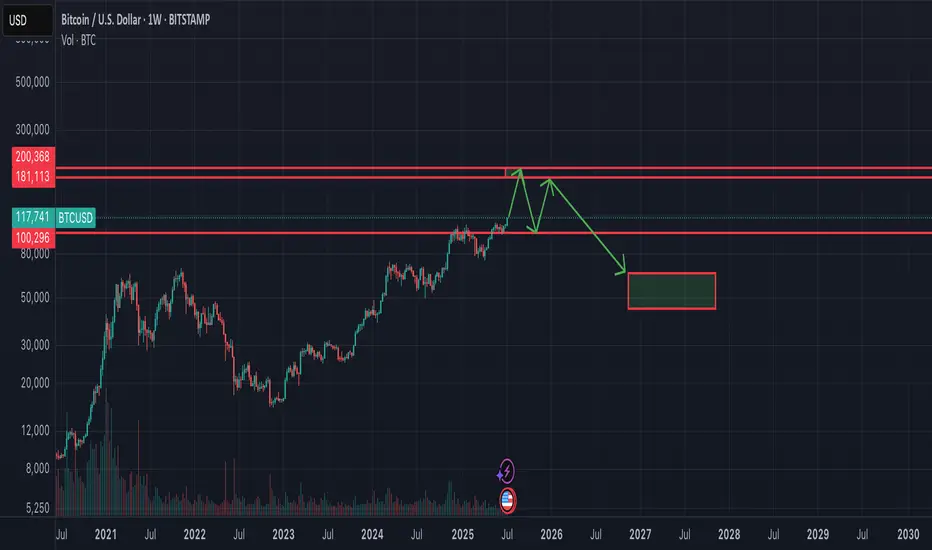
End of Bitcoin cycle this Year nearly 180-200k$ The Great Depression 2.0 ahead and all politicians already know it and prepare to blame all their troubles on the crisis.. I think Bitcoin will reach 180-200k$ till the beginning or the end of september. Need to track the price of gold - Bitcoin ATH near the 55 oz of gold!
After reaching the peak - there will be dump -50%. September and October as the best months for bitcoin in 2025 would be the worst months. November and December maybe green - to close some nice year candle (giving to altcoins last chance for performing) and after that going into the bear market.