Gold is weak. It may break through next week.This week, gold rose and fell, rising for two consecutive days on Monday and Tuesday, and falling for three consecutive days from Wednesday to Friday. The weekly line finally closed with a small real body negative line with a long upper shadow.
Gold's trend this week was due to the strengthening of the US dollar and the progress in US-EU trade negotiations, which hit the safe-haven demand, leading to a decline in gold prices.
Next week, focus on multiple time points that may trigger market trends, including the Federal Reserve's decision, non-agricultural data, the August 1 tariff deadline, and the economic and trade talks between Chinese representatives in Sweden and the United States. These events may set the tone for the market in the second half of the year and need to be paid attention to.
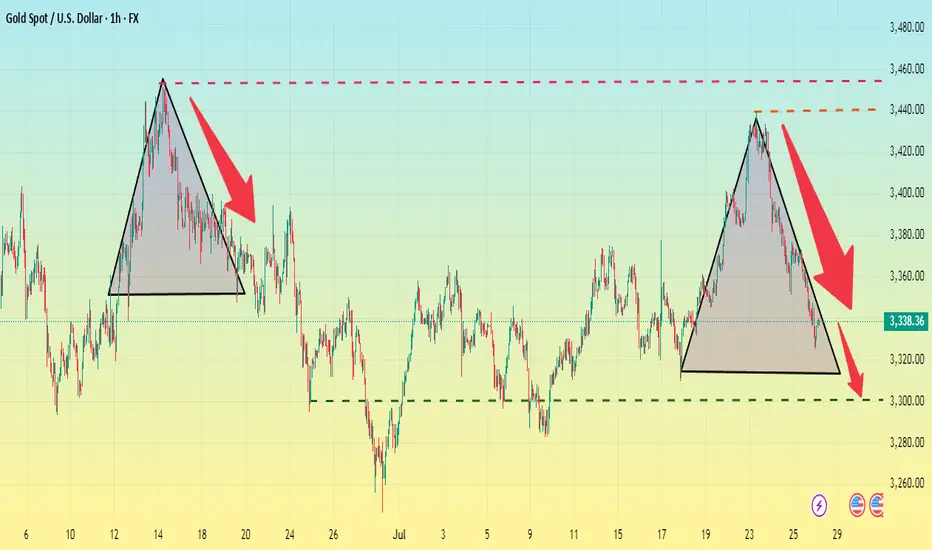
At the beginning of this week, we focused on the triangular convergence pattern formed by the high and low points since 3500 points. On Tuesday, gold broke through the pattern upward, but failed to stand firm on Wednesday. Instead, it fell to form a false breakthrough, and on Friday it fell to the lower edge of the triangular convergence range. However, from the perspective of the international futures market, the overall situation is still in the triangular convergence pattern and has not achieved an effective upward breakthrough. Based on this, we need to continue to keep a close eye on the changes in the triangle convergence pattern next week. The direction of its next breakthrough will have an important impact on the short-term trend.
Operation strategy:
Short near 3350, stop loss 3360, profit range 3320-3315. If the price continues to fall, you can hold a small position, and the area near 3300 is likely to be touched.
Fundamental Analysis
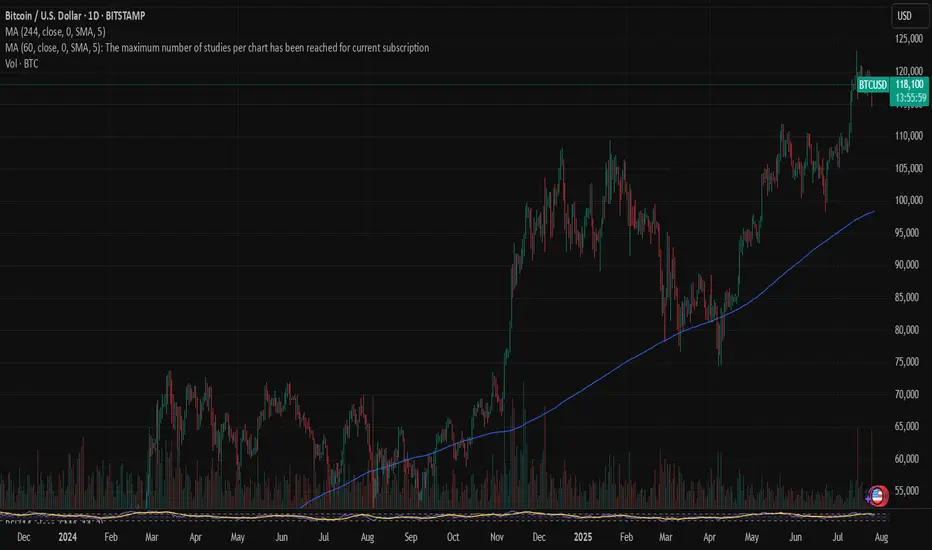
"Bitcoin’s Big Heist – Are You In or Out?"🚨 BTC/USDT HEIST MISSION – SWIPE THE BULL RUN BEFORE THE BEARS WAKE UP 💰💣
🌟Hi! Hola! Ola! Bonjour! Hallo! Marhaba!🌟
Money Makers & Robbers, assemble! 🤑💰✈️💸
Here’s your decoded BTC/USDT “Bitcoin vs Tether” Crypto Market Heist Plan, fully loaded with Thief Trading Style 🔥 TA + FA combo. We’re prepping for a bullish breakout loot – eyes on the vault, ignore the noise.
🎯 PLAN OF ATTACK:
🎯 ENTRY (BUY ZONE):
💥 “The vault’s open—time to sweep!”
DCA/Layer your buy limit orders near the 15–30 min swing lows/highs for sniper pullback entries.
Use multi-entry method to stack positions (layering / DCA) as per your ammo (capital 💵).
🛑 STOP LOSS:
Set SL at the nearest swing low wick (4H TF) — around 115000.00, adjust based on your risk/load.
SL = insurance. Not optional.
🏁 TARGET:
Lock sights on 125000.00
🎉 Or… vanish with profits before the bear cops arrive.
🔎 MARKET BACKDROP & ANALYSIS:
📈 BTC/USDT currently signals bullish vibes on the swing/day horizon — fueled by:
Macro Fuel & Fundamentals
Sentiment Radar
COT Reports
On-Chain Pulse
Intermarket Clues
🚀 Connect the dots. The smart money's already prepping a breakout move.
🧲 Scalpers Note:
Stick to the long side only. No shorting the beast — unless you’re made of diamonds.
Secure your bag with trailing SLs.
⚠️ NEWS TRIGGER ZONE – TRADE WITH TACT:
📢 Upcoming high-volatility news events can spike charts.
Avoid new entries during releases and guard open trades with trailing SLs.
Protect the loot. Always.
💖 SUPPORT THE HEIST GANG: BOOST IT!
Smash that ❤️ to boost our thief squad’s momentum!
Every click powers this underground mission – making money with style, one pip at a time. 🎯💣💵
🚀 See you in the next heist drop.
Until then – Stay stealthy. Stay profitable. Stay legendary. 🐱👤💸🏆

ETHUSD : Good luck :-)A lot of people get carried away easily.
It is ALWAYS a MISTAKE to buy at the TOP. You have already missed the boat.
Trade with common sense, not with emotion.
Good luck.

DOW: Dow Inc. cut its dividends in half !High dividends no longer !
I was waiting the stock to reach the support level to benefit from the 10% high dividends yield... but the company cuts its dividends yield from 10% to 5%, so it is no longer valid to me.
Disclaimer: This content is NOT a financial advise, it is for educational purpose only.

GOLD MARKET ANALYSIS AND COMMENTARY - [Jul 28 - Aug 01]This week, OANDA:XAUUSD prices had a positive start, rising sharply from 3,345 USD/oz to 3,439 USD/oz because investors were concerned about the risk of financial market instability when US President Donald Trump continuously pressured the FED Chairman to reduce interest rates, and there were even rumors of the Fed chairman resigning.
However, the upward momentum in gold prices was not maintained when the US continuously reached trade agreements with partners such as Japan, Indonesia, Philippines..., cooling down the trade war. This caused gold prices to drop sharply for three consecutive trading sessions, at one point the gold price dropped to 3,325 USD/oz and closed at 3,336 USD/oz.
Trade war worries are starting to subside. Therefore, we continue to witness a shift of investment capital flows from gold to risky assets such as stocks..
Notably, this week is the fourth time gold prices broke the $3,400 threshold but did not stay above this level.
Next week, in addition to the FED meeting, the market will also receive information about US non-agricultural employment (NFP) data. If this index falls stronger than expected, it will further strengthen expectations that the FED will continue to keep interest rates at the current level in upcoming meetings, causing gold prices to drop even more sharply next week.
📌In terms of technical analysis, the three crows pattern (3 long red candles) appeared on the D1 chart, showing that sellers were still in control throughout the past 3 trading sessions without much buying power. This technical pattern often suggests that gold prices may be shifting from their recent upward trajectory into a more prolonged period of decline. This technical signal also quite coincides with the context of many fundamental factors, such as geopolitical conflicts, trade wars, low physical gold demand in the summer... no longer strongly supporting gold prices as before. However, according to many experts, if the gold price drops sharply, it will be a good opportunity to buy, because the gold price is forecast to still increase strongly in the long term.
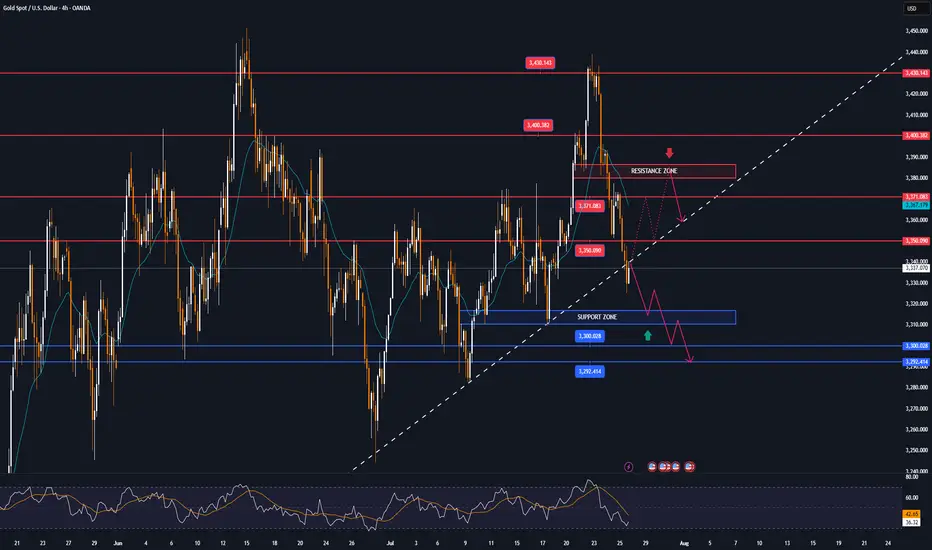
On the H4 chart, gold price may continue to adjust down below the 3,285 USD/oz mark, before recovering again. Meanwhile, the 3,450 USD/oz area is still a strong resistance level for gold prices next week.
Notable technical levels are listed below.
Support: 3,310 – 3,300 – 3,292USD
Resistance: 3,350 – 3,371 – 3,400 – 3,430USD
SELL XAUUSD PRICE 3383 - 3381⚡️
↠↠ Stop Loss 3387
BUY XAUUSD PRICE 3316 - 3318⚡️
↠↠ Stop Loss 3312
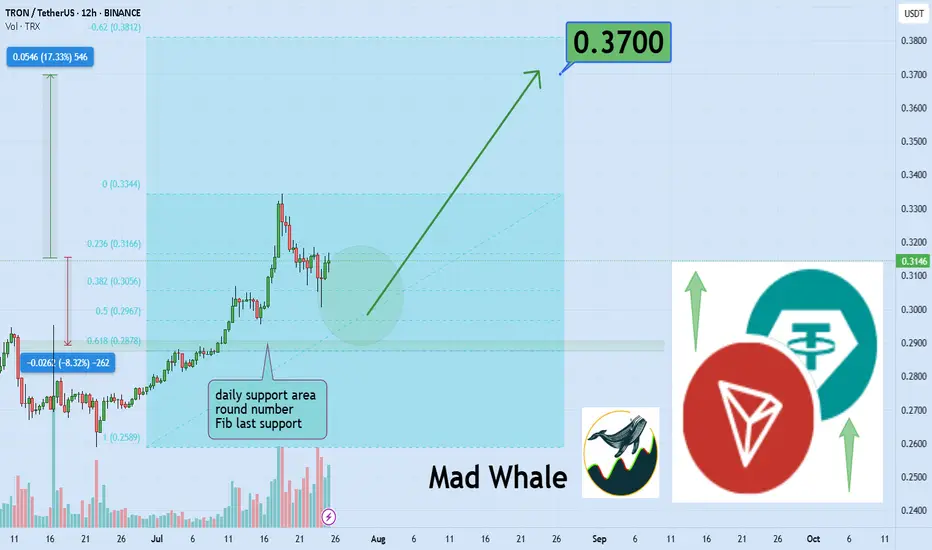
TRON Eyes 17 Percent Surge Toward Explosive 0.37 Breakout TargetHello✌
Let’s analyze TRON’s upcoming price potential 📈.
BINANCE:TRXUSDT is currently approaching a key daily support zone that aligns with a notable Fibonacci retracement level 🧭. This technical confluence suggests a potential short-term rebound, and I’m watching for a possible move of around 17% toward the 0.37 target 🎯.
✨We put love into every post!
Your support inspires us 💛 Drop a comment we’d love to hear from you! Thanks , Mad Whal
Technical bounce back on cardsRevenue: ₹8,545 crore (~11% YoY increase)
Net Profit (PAT): ₹1,418 crore (~2% YoY growth)
North America generics revenue declined ~11% to ₹3,412 crore due to pricing pressures, while Europe surged 142% YoY
Consensus estimates (SimplyWall.st): Average target at ₹1,289, with bullish/bearish range ₹1,660–₹990. Growth forecast modest (~2.9% revenue CAGR through 2026) — down from 13% historical average
Despite milestones in revenue, margins remain under pressure from global competition
For long-term investors: A conservative growth stock with moderate dividend income—best suited for those seeking stability with exposure to generics in key markets.
For traders or momentum players: Watch India- and Europe-driven growth and pipeline developments. U.S. competition remains a major swing factor.

XAUUSD SNIPER OUTLOOK – JULY 28, 2025🔥 Macro & Sentiment
The dollar remains dominant — DXY holding above 105 keeps gold under pressure. No fundamental support for bullish continuation unless major macro shifts. Risk flows are defensive, not aggressive. FOMC and US GDP data remain key drivers for direction this week.
BIAS:
• Short-term bearish under 3350
• Market still in distribution mode — every bounce gets sold
• Real buy interest only deep below 3315
🔻 INTRADAY SUPPLY ZONES (Short Only With Rejection)
1. 3382–3370 (H1/M30 Premium Supply)
🔹 H1 order block, FVG alignment, EMA21/50/100 convergence
🔹 Liquidity inducement above → then rejection
📍 Short only if rejection shows via engulf / upper wick.
2. 3355–3340 (Decision Zone / Micro Supply)
🔹 EMA100/200 alignment, former support flipped resistance
🔹 M30 FVG fully filled, structure flip from mid-July
📍 Short bias below. Long only if reclaimed with H1 close above 3355.
🔵 NEUTRAL / PIVOT ZONE
3. 3338–3326 (Decision Band – M30/M15)
🔹 Consolidation area post-BOS, internal liquidity sweeps
🔹 EMA21 base on M15, no clear dominance
📍 Wait for clean reaction. Bullish engulf = scalp long to 3355. Failure = slide to demand.
🟢 DEMAND ZONES (Buy Only On Strong Reversal Confirmation)
4. 3314–3302 (M30/M15 Deep Demand)
🔹 H1 OB + hidden FVG + fib 38.2%
🔹 First real demand zone where buyers may engage
📍 Long only if strong M15 confirmation: engulf + RSI cross + EMA5/21 angle change.
5. 3289–3272 (True Reversal Demand – H1/M30)
🔹 Full NY reversal origin (July 18), major FVG left unfilled
🔹 Institutional volume + liquidity grab zone
📍 Buy only on full flush + fast snapback with BOS on M15/H1.
🧭 BIAS & EXECUTION BY TIMEFRAME
H4 Bias:
Bearish while below 3350. No valid supply above until 3370+. Avoid longs unless price sweeps 3314 or 3272 and confirms.
H1 Bias:
Sell clean rejection at 3355 or 3370–3382. Only flip long above 3355 with full-bodied close.
M30 Bias:
Watch decision zone 3338–3326 for direction. No-man’s land in between — don’t force trades.
M15 Bias:
Scalp long from 3314 or 3272 only on full confluence (OB + RSI + EMA realignment). Short only confirmed rejections above.
📊 FULL INTRADAY KEY LEVELS (Top → Bottom)
Level Context
3405 Fib ext. 127% (HTF sweep target only)
3385 OB
3375–3350 Valid Premium Supply (H1 shelf)
3350–3340 Micro Supply / Flip Zone
3338–3326 Decision Zone – watch reaction
3314–3302 Deep Demand (H1/M30 confluence)
3289–3272 Extreme Demand Base
3260 Fib 61.8% + HTF support
3250 Minor volume node
3240 Final structural floor
✅ EXECUTION NOTES
⛔ Avoid entering inside 3340–3326 → fakeout zone
✅ Play only clean sniper triggers with structure
⚠️ Wait for macro — FOMC / GDP releases may fake both sides
💡 Patience wins. Pick your zone, wait for setup, strike.
Which zone are you watching to strike? Drop your bias below.
📍 Like, comment & follow GoldFxMinds for the most precise sniper maps on TradingView.
Disclosure: This plan is based on the Trade Nation chart feed. I am part of their Influencer Program.

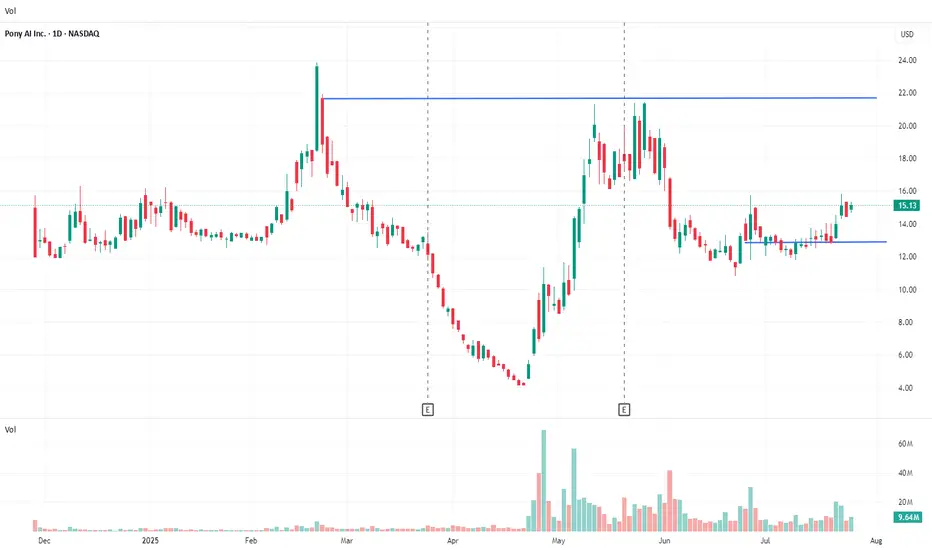
Pony.ai is a cutting-edge autonomous driving company.Revenue: Still in early-stage / pre-revenue phase
Heavy R&D spending
Backed by over $1B in funding
Valuation during last private round: ~$8.5 billion
✅Strong partnerships (Toyota, Hyundai)
✅ Dual-market presence: US + China
✅ Leader in AV permits in California
✅ Advanced AI and simulation tech stack
PONY is a speculative play in the autonomous vehicle space. Great for long-term investors who believe in AV tech and are okay with volatility.
Risk: 🔴🔴🔴🔴⚪
Growth Potential: 🟢🟢🟢🟢⚪
Dividend: ❌ None
Ideal For: Long-term tech investors, AI/autonomous sector enthusiasts
BTC SELL?A nice short opportunity for sell on Btc/Usd.
Intraday trade.
If it get continuation BTC could drop to lower levels.
Aiming for at least 3R
Let’s see how it plays out.

GBPCHF - Classic 'W' PatternGBPCHF has been setting up for the next impulse phase as we can see common 'W' price action pattern which has made the last swing low in this reversal structure to see buyers step in and push price upward.
Always wait for confirmation, Good Luck

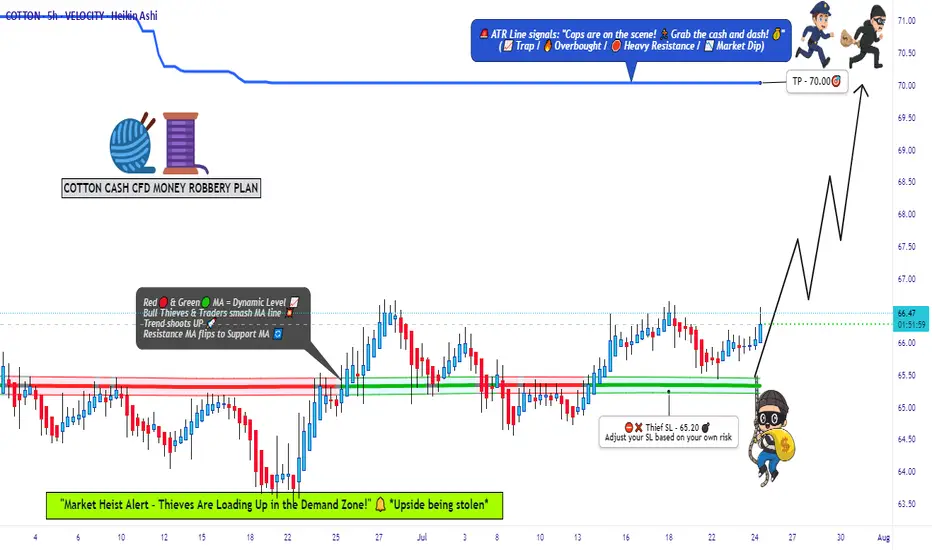
COTTON QUICK TRADE: Low Risk, High Reward Setup!🚨 COTTON HEIST ALERT: Bullish Bank Robbery in Progress! (CFD/Commodity Raid Plan) 🚨
Thief Trader’s Master Loot Strategy – Long Entry, Escape Before the Cops Arrive!
🌟 Greetings, Fellow Market Bandits! 🌟
Hola! Bonjour! Hallo! Marhaba! 🤑💸 Money Makers & Midnight Robbers, it’s time to execute the COTTON COMMODITY HEIST with precision. Based on 🔥Thief Trading Style Analysis🔥, this is your VIP invite to the biggest bullish swipe of the season.
🔓 THE VAULT IS OPEN – ENTRY PLAN (LONG RAID)
📈 "Break the Lock & Loot!"
Ideal Entry: Buy limit orders within 15-30min pullbacks (swing lows/highs).
Pro Thief Move: Layer your entries (DCA-style) for maximum stealth.
Aggressive Robbers: Charge in directly if liquidity is high.
🚨 STOP-LOSS (ESCAPE ROUTE)
🛑 "Hide Your Loot or Get Busted!"
Place SL below the nearest swing low (5H MA @ 65.20).
Adjust based on your risk tolerance & loot size (multiple orders = tighter escape).
🎯 TARGET: CASH OUT BEFORE THE COPS ARRIVE!
🏴☠️ Take Profit Zone: 70.00 (or escape earlier if the market turns shaky!)
Scalpers: Trailing SL = your best ally. Stick to LONG-ONLY quick hits!
Swing Bandits: Ride the wave but don’t get greedy—exit before the pullback trap!
🔥 WHY THIS HEIST WILL WORK (BULLISH CATALYSTS)
🧵 Cotton’s Price Surge Fueled By:
Supply Squeeze (Storage/Inventory Data 📉).
COT Report Shows Big Money Going Long 🏦.
Seasonal Trends + Macro Sentiment Shift ☀️📈.
Intermarket Signals Aligning (Commodity Supercycle?).
(Full analysis? Check the FUNDAMENTALS & KLICKK! 👉🔗)
⚠️ WARNING: NEWS TRAPS & VOLATILITY AHEAD
📰 "Cops (News Events) Can Crash the Party!"
Avoid new trades during high-impact news (liquidity dries up = slippage risk!).
Lock profits with trailing stops—don’t let the market reverse-steal your gains!
💥 BOOST THIS HEIST – STRONGER GANG = MORE LOOT!
💖 "Smash the 👍 LIKE button to support the crew!"
More boosts = more heist plans (next target: OIL? GOLD? STOCKS?).
Daily profit raids await—follow & stay tuned! 🤝
🚀 See you at the escape zone, bandits!💨
🎯 FINAL THIEF TRADER RULE:
"Steal Fast, Exit Faster—No Prison Trades!" 🏃♂️💨
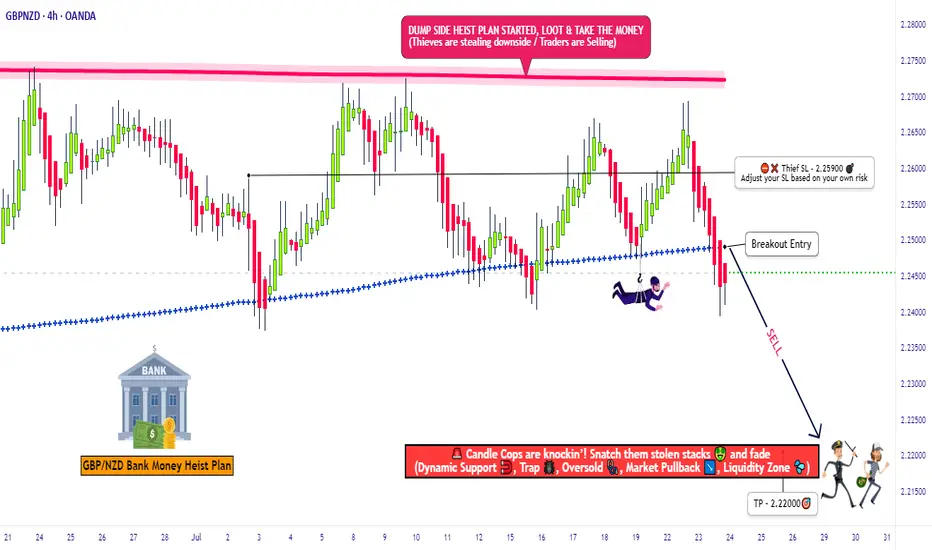
"GBP/NZD: Bearish Storm Brewing – Get Ready!🚨 GBP/NZD HEIST ALERT: "Pound vs Kiwi" Bearish Trap Setup! 🚨 (Scalping/Day Trade)
🌟 Attention, Market Robbers & Profit Pirates! 🌟
🔥 Thief Trading Strategy Activated – Time to short the GBP/NZD like a pro! This pair is setting up for a bearish heist, and we’re locking in entries before the drop. High-risk, high-reward? You bet.
🎯 TRADE PLAN (Bearish Ambush)
Entry Zone (Short) 📉:
Optimal: Sell limit orders on retests (15m/30m timeframe).
Thief’s Trick: Layer entries (DCA-style) near recent highs for max efficiency.
"Enter like a sniper, escape like a ghost." 👻
Stop Loss 🛑:
4H Swing High/Wick (Near 2.25900) – Adjust based on your risk & lot size.
"A smart thief always has an exit route." 🏃💨
Target 🎯: 2.22000 (or escape early if the trap snaps shut!)
💣 WHY THIS HEIST? (Bearish Triggers)
Technical Setup: Oversold bounce? Nah. Consolidation → Reversal trap.
Fundamentals: Weak GBP sentiment? Strong NZD data? Check the news!
Market Psychology: Bulls are getting trapped at resistance—time to fade them.
⚠️ THIEF’S WARNING
News = Volatility Bomb 💣 – Avoid new trades during high-impact events.
Trailing SLs = Your Best Friend – Lock profits & dodge reversals.
💎 BOOST THIS IDEA & JOIN THE HEIST!
🔥 Hit 👍 LIKE, 🚀 BOOST, and FOLLOW for more lucrative robberies!
💸 "Steal the market’s money—before it steals yours." 🏴☠️
🔔 Stay tuned—next heist coming soon! 🔔
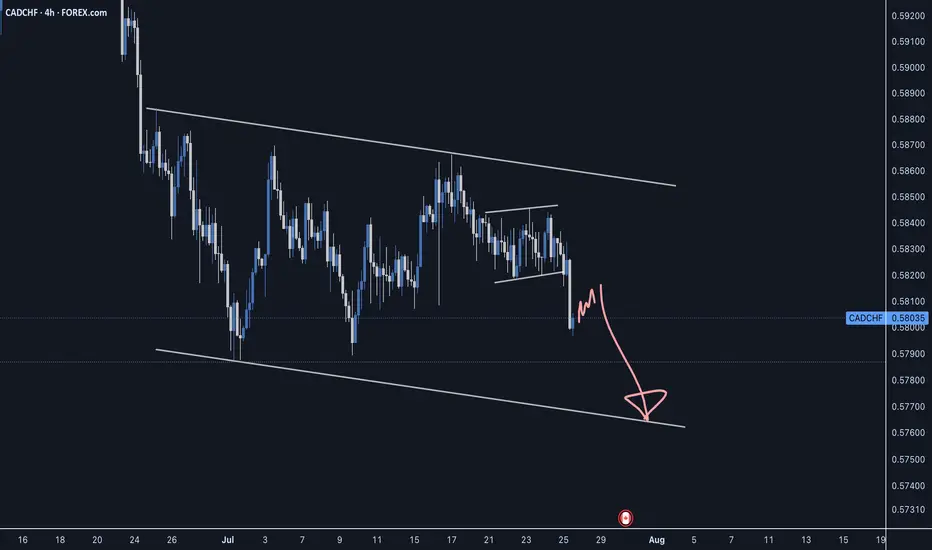
CADCHF - Sellers still in controlCADCHF has been moving within a reversal structure which could make another swing low to complete this pattern before the next move up.
Good Luck
Euraud daily timeframe
"Hello friends, focusing on EUR/AUD on the daily time frame, the price is currently in a bullish trend and appears to have completed its pullback to a critical level on the daily chart. In the 4-hour timeframe, there are indications of upward momentum.
After observing the price behavior this week, I believe that higher prices are more likely. However, it is important to note that if the price closes below the 1.7100 level on the 4-hour chart, this analysis may prove incorrect."
If you have any more details to add or need further assistance, please let me know!

Gold on high time frame
"Hello traders, focusing on gold, the price recently swept liquidity around $3,250 and displayed strong signals indicating a potential upward movement. The next target could be around $3,400."
If you need further clarification or have more details to discuss, feel free to share!

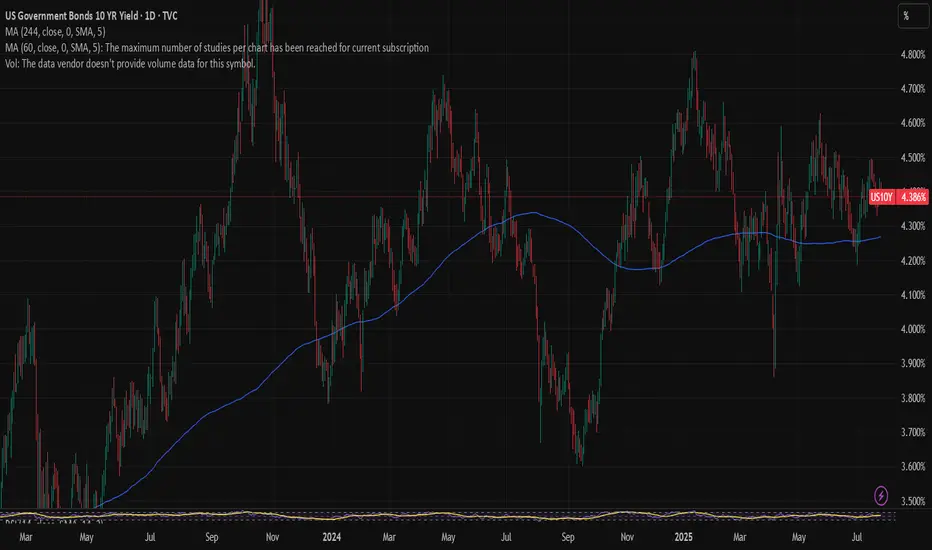
US 10Y TREASURY: FOMC week During the previous week investors were digesting the latest macro data aiming to set expectations for the forthcoming FOMC meeting, which is scheduled for Wednesday, July 30th. The 10Y Treasury yields were moving between 4,32% and 4,44%, closing the week at 4,38%. The drop in yields during the second half of the week was impacted with a trade deal between the US and Japan. Negotiations with the EU are taking place during the weekend in Scotland, whose outcome will be known at the start of the week ahead.
Regardless of trade negotiations, the week ahead will bring a lot of currently important US macro data, as well as the FOMC meeting. Current expectations with 95% odds is that the Fed will keep interest rates unchanged in July. Also, it is expected that Fed Chair Powell will inform the public about the latest Feds members view on the US economic developments. In case of any information that the market still has not priced, the higher volatility will take place. For the week ahead, there is both probability for a further modest relaxation in yields, at least till the level of 4,35%, and also potential for testing of 4,4% for one more time.
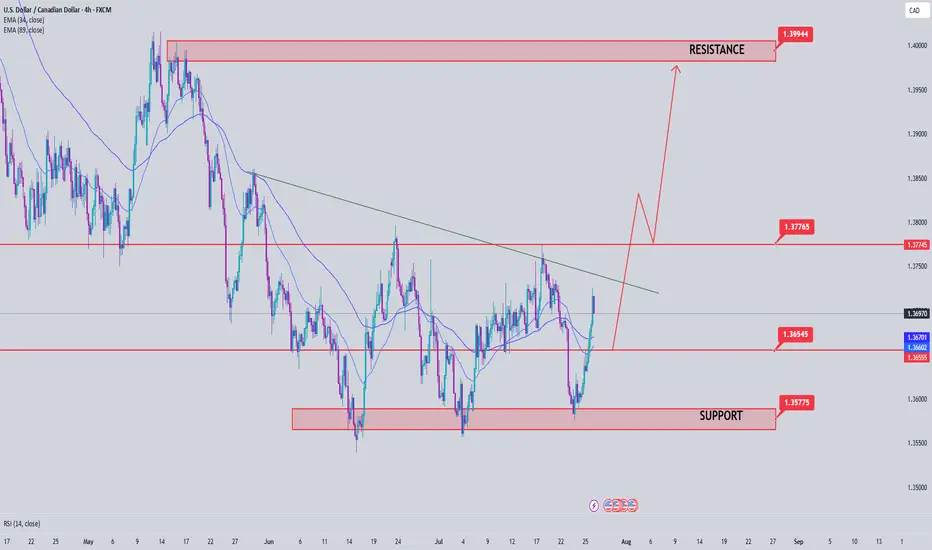
USDCAD Analysis week 31🌐Fundamental Analysis
The Canadian dollar continued to decline against the US dollar on Friday. Trump returned to threatening tariffs on Canada as trade deals remain limited. The August 1 deadline for tariffs is approaching and Canada has not made much of a move so far.
🕯Technical Analysis
USDCAD continues to rally towards the 1.4000 resistance zone. A recovery of the pair to 1.365 is a good momentum for USDCAD to break the trendline and break 1.37700. The trading strategy for next week is mainly to look for BUY points when there is a recovery of the wave structure. If the important support of the week 1.357 is broken, the uptrend will reverse.
📈📉Trading Signals
BUY USDCAD 1.365-1.363 Stoploss 1.360
BUY Break out 1.37700
Gold: dropped on trade deals The safe-haven asset had its ups and downs during the previous week. The week started with an uptrend, where the price of gold reached its highest weekly level at $3.430, on trade tariff tensions. However, the deal made between the US and Japan, pushed the price toward lower grounds, ending the week at $3.340. In addition, Friday's drop was supported by announced tariffs negotiations between the US and EU in Scotland during the weekend.
The RSI dropped below the level of 50 on Friday, ending the week at the level of 48. The MA50 slowed down its divergence from MA200, however, the potential cross is still far away. Still, weekly lows of the price of gold found support at MA50 levels.
The week ahead brings several currently very important US macro data, including JOLTs, PCE, NFP and Unemployment data. In addition, the FOMC meeting will be held where the market will receive the latest Fed's view on economic developments in the country and future expectations. Also, further news on trade tariff agreements, especially regarding ongoing negotiations between the EU and the US in Scotland, might make an impact on investors sentiment for safe-haven assets. As per current charts, the price of gold might revert a bit to the upside, after a drop during the last three days of the previous week. In this sense, the resistance level at $3,4K might be tested. On the opposite side, the situation on charts is a little bit tricky. Namely, there is a line which perfectly connects all lows from February this year. Friday's closing was exactly at this line, which again adds to the probability of a short reversal. However, if, in any case, the price of gold breaks this longer term trend, then it will indicate that the longer path to the downside is in store for gold.

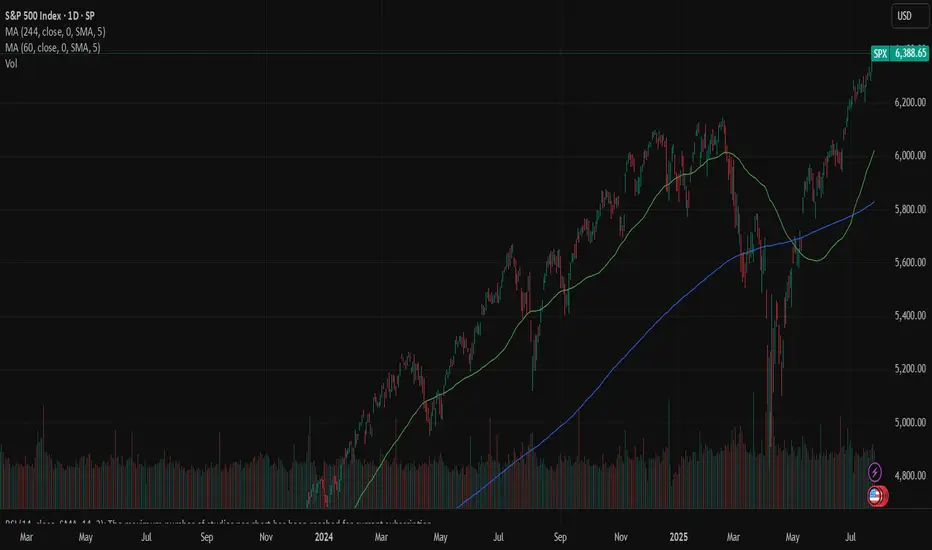
SPX: Tariffs deal (un)certainty Investors' optimism continued to hold at the U.S. equity markets another week in a row. The S&P 500 posted another weekly winning streak, supported by solid earnings of companies included in the index. The index also reached another all time highest level, with Friday's level of 6.388, gaining around 1,5% for the week.
Tech companies were once again main contributors to the surge of the index. Alphabet posted better than expected quarterly results, supporting the surge in share price of 4%. Tesla shares gained 3,5% for the week. The company reported strong vehicle delivery numbers and progress in AI-driven autonomous driving technology. Analysts are noting that 82% of all companies included in the S&P 500 index, that have already reported quarterly results, have beaten the market expectations.
Alongside strong earnings reports, recent advancements in U.S. trade negotiations have contributed to market gains. Earlier this week, President Donald Trump announced a significant trade agreement with Japan, which includes a 15% reciprocal tariff arrangement—an important step toward redefining trade terms between the two nations. Additionally, the U.S. and Indonesia have reportedly reached a framework agreement for a trade deal, reflecting a broader U.S. effort to strengthen and stabilize trade partnerships in Asia. On Friday, President Trump expressed confidence that more trade agreements will be finalized ahead of the August 1 deadline for new tariffs. One of these possible deals involves the European Union. Investors have welcomed these developments, as they help reduce tariff-related uncertainties and ease concerns about escalating trade disputes that could disrupt global supply chains and impact corporate earnings.
The week ahead brings a bunch of important macro data for the U.S. as well as the FOMC meeting, where Fed members will discuss a potential change in interest rates. Markets are currently not expecting that the Fed will make a move at this meeting. Certainly, with JOLTs, NFP, PCE data in combination with the FOMC meeting, the week ahead might bring back some higher volatility in the US equity markets, in case of any unexpected news.
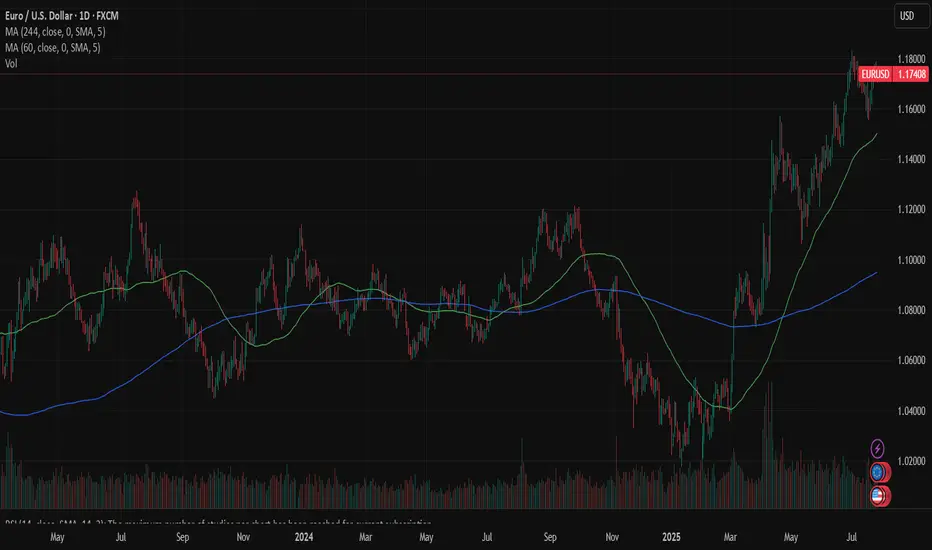
EURUSD: FOMC, PCE, NFP, JOLTs - busy week guaranteedThe ECB meeting was one of the major events during the previous week, when it comes to macro data. As it was widely expected, the ECB left rates unchanged, amid uncertainties related to trade tariffs with the U.S.. The ECB maintains its previous macro outlook, viewing the Euro Zone economy as resilient but facing downside risks. President Lagarde highlighted global trade tensions, geopolitical instability and negative shifts in market sentiment as key risks to further growth. At the same time, Lagarde dismissed concerns about the stronger euro, reiterating that the ECB does not target the exchange rate directly. With the inflation level of 2% and deposit rate of 2%, the ECB is in the position to take a wait-and-see stance on further rate cuts, although some analysts are mentioning the possibility of another 25bps cut in September.
Other macro data for the Euro Zone and Germany include the HCOB Manufacturing PMI Flash for July, which stood at 49,8 for the Euro Zone and 49,2 for Germany. Both indicators were standing in line with market expectations. The Ifo business Climate in Germany in July reached 88,6, in line with market forecast.
The previous week was relatively weak when it comes to currently important macro data for the U.S. economy. Posted data include Existing Home Sales in June, which reached 3,93M and were a bit lower from forecasted 4,0M. The indicator dropped by 2,7% compared to the previous month. The S&P Global Manufacturing PMI flash for July reached 49,5 a bit lower from market forecast of 52,6. At the same time the S&P Global Services PMI flash for July beat market expectation with the level of 55,2. The durable Goods Orders in June dropped by -9,3% compared to the previous month, which was a bit lower from -10,8% expected by the market.
The ECB meeting left its mark on the parity of eurusd currency pair during the previous week. The euro strengthened till the level of 1,1786, but eased as of the end of the week, closing it at 1,1742. The currency pair was testing the 1,17 support line on Friday's trading session. The RSI continues to move at levels above the 50 line, ending the week modestly below the level of 60. The MA50 continues to diverge from MA200, without an indication of a potential cross in the near term period.
The week ahead is an important one from the perspective of macro data. A bunch of currently closely watched data for the U.S. will be posted, including PCE, NFP, JOLTs, Unemployment rate in July. In addition to data, the FOMC meeting will be held on Wednesday, July 30th, where the Fed will decide on interest rates. Current market expectation is that the Fed will leave rates unchanged at this meeting. However, the final decision is with the Fed, in which case, any surprises might significantly move the currency pair toward one side. Also, in case of surprises with any of the above mentioned macro data the market reaction could bring higher volatility. Precaution in trading with eurusd in the week ahead is highly advisable. As per current charts, there is a high probability that the currency pair will move to the downside to test the 1,17 support level for one more time. Levels around the 1,1650 might also be shortly tested. In case that the market decides for a higher ground, there is some probability for the level of 1,18, as the next resistance level to be tested shortly.
Important news to watch during the week ahead are:
EUR: GDP Growth Rate for Q2 for both Germany and the Euro Zone, Unemployment rate in Germany in July, Inflation rate in Germany and the Euro Zone preliminary for July,
USD: JOLTs Job Openings in June, GDP Growth Rate for Q2, Pending Home Sales in June, the FOMC meeting and Fed interest rate decision will be held on Wednesday, July 30th, PCE Price Index for June will be posted on Thursday, July 31st, Non-farm Payrolls for July, Unemployment rate in July, ISM Manufacturing PMI in July, University of Michigan Consumer Sentiment final for July.
Bitcoin: Spiked liquidations The optimism that held the market sentiment after the adoption of the Genius Act on July 17th, slowly faded during the previous week. As it was expected, traders were closing their positions in order to book profits, spiking the liquidations of positions. The price of BTC reached the lowest weekly level at $114,8K at Friday's trading session, however, it was only during the short period of time. The BTC swiftly recovered, turning back toward levels above the $118K. The highest weekly level reached was $120K.
The RSI is still holding high, around the level of 60, but went out from the overbought market side. This increases potential for a further move toward the oversold market side, however, it might take more than a week in order for the market to actually turn their course toward the downside. The MA50 is still diverging from MA200, indicating that the potential cross is still not in the store.
BTC continues to hold higher grounds, which indicates that investors are still eager to hold and buy this coin, especially on a dip, like it happened at Friday's trading session. Indications over potential short reversal of BTC are emerging on charts, however, the timing of it is unclear at this moment. In the week ahead there are several quite important US macro data scheduled for a release (NFP, PCE, Unemployment, JOLTs) as well as the FOMC meeting, which all might bring some higher volatility back on markets. BTC might also react, as a part of mainstream markets. At this moment on charts, there is indication that BTC might shortly test lower grounds, probably around the $116K level. If this level sustains the selling pressure, then BTC will revert back, most probably toward the $120K for one more time. Still, there are small odds that the $116K might be breached toward the lower grounds, in which sense, $112K will be level to watch. However, odds for this level are quite low at this moment.
MARKETS week ahead: July 27 – August 2Last week in the news
Trade tariff (un)certainties shaped market sentiment during the previous week. The US-Japan trade deal was settled which brought some relaxation among investors. The US equities continued with a positive trend, with the S & P 500 reaching fresh all time highest level, ending the week at 6.388. On the same ground the price of gold turned a bit toward the downside, closing the week at $3.336. The relaxation was evident also in 10Y US Treasury yields, which closed Friday trading session at 4,38%. BTC had a short liquidation session on Friday, shortly reaching the $115K level, however, swiftly returned back toward the $118K.
The European Central Bank (ECB) held its July meeting during the previous week, where it held interest rates steady after seven consecutive cuts, signalling a more cautious approach going forward. While its macroeconomic outlook remains unchanged, the ECB sees downside risks to growth, including global trade tensions and weak market sentiment. President Lagarde downplayed concerns about the stronger euro and minor inflation undershooting, emphasizing a data-dependent, meeting-by-meeting policy stance. Although the ECB appears comfortable with its current position, a final rate cut in September is still possible if inflation or macro data disappoint.
President Trump announced a major trade deal with Japan this week, featuring a 15% reciprocal tariff, marking a shift in bilateral trade relations. The U.S. also reached a framework agreement with Indonesia, reinforcing efforts to strengthen trade ties across Asia. Trump signalled that more deals may be finalized before the August 1 tariff deadline, including potential progress with the EU, as a meeting with Commission President von der Leyen is set for Sunday in Scotland. These developments have been well received by investors, easing concerns over trade uncertainty and potential supply chain disruptions.
China unveiled a global AI action plan at the World Artificial Intelligence conference in Shanghai, calling for international cooperation on technology development and governance. Premier Li Qiang proposed establishing a global AI cooperation organization to coordinate regulation and infrastructure, emphasizing equitable access. The plan positions China in contrast to the U.S., favoring multilateralism over America's more block-oriented approach to AI strategy. Featuring participation from over 800 companies including domestic giants Huawei and Alibaba, the conference showcased thousands of AI innovations and signals China's ambition to challenge U.S. dominance in the field.
Palantir's stock achieved a new record high last Friday, rising over 2% and lifting its market cap to around $375B. With the latest move, the company is now holding 20th place as the most valuable U.S. company. The company's shares have more than doubled this year as investors' enthusiasm grows around its AI capabilities and government contract momentum. Analysts attribute the rally to Palantir's strengthened role in AI analytics and expansion in defence-related software and data contracts.
CRYPTO MARKET
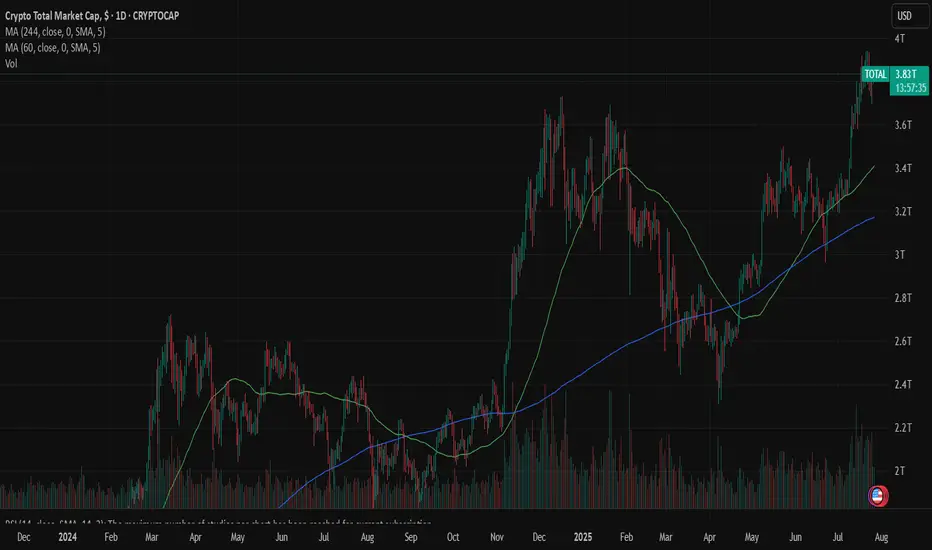
The crypto market was traded in a mixed mode during the previous week. Some liquidations were made in BTC, followed by altcoins, however, there were also coins with relatively solid weekly performance. Total crypto market capitalization was increased by 1% on a weekly basis, adding total $39B to its market cap. Daily trading volumes were modestly decreased to the level of $275B on a daily basis, from $333B traded a week before. Total crypto market capitalization increase from the beginning of this year currently stands at +19%, with a total funds inflow of $600B.
BTC had a relatively flat week, with only $3B of funds inflow. On the other hand ETH continues to perform strongly, with another week in a positive territory of 5,3%, increasing its cap by $23B. XRP did not perform well on a weekly basis, as the coin had a drop in value of 7,4% and outflow of $15B. Some of the significant weekly gainers include Litecoin, with a surge of 13% on a weekly basis, Maker was traded higher by 14%, BNB gained 7%, while Solana was higher by 5% same as Uniswap. Other altcoins were traded either with a modest drop in value or with a modest increase in value.
There has been increased activity with circulating coins. Another week in a row, IOTA is increasing the number of coins on the market by 0,8% w/w. EOS had an increase of 0,6%, same as Polkadot. The majority of other altcoins had a modest increase of circulating coins of 0,1%, including XRP.
Crypto futures market
This week the crypto futures market reflected perfectly developments on the spot market, with ETH long term futures managed to pass the $4K level.
BTC futures were traded mostly flat compared to the previous week. Futures maturing in December this year closed the week at $120.810, and those maturing in December 2026 were last traded at $127.500. At the same time, ETH futures were traded around 2,5% higher for all maturities. Futures ending in December 2025 reached the last price at $3.779, while those maturing in December 2026 for the first time ended the trading week at $4.058.