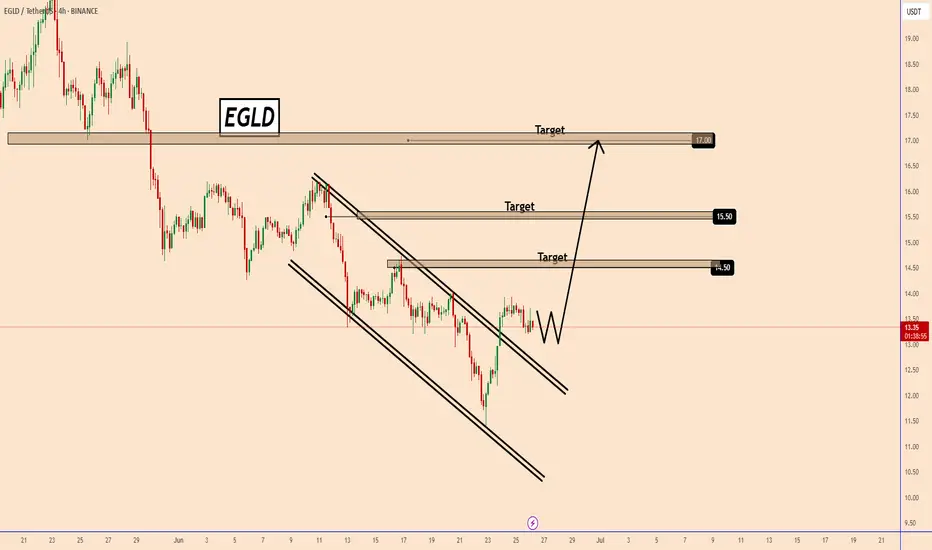
EGLD: Potential Rally as Altcoins Reclaim MomentumEGLD: Potential Rally as Altcoins Reclaim Momentum
EGLD has broken out of a clear ascending channel pattern. The move was initiated by optimism for BTC price recovery to 108k.
BTC was the first to move, and today's indicators are showing a pause in BTC.
Meanwhile, Alcoins started the move and dominated the market today. Many altcoins are very undervalued, and EGLD is one of them.
RGLD is likely to take a small pause and could rise these days to 14.50; 15.50 and 17.00 on its first move if that happens.
Later, we should re-evaluate the analysis. There is a great potential if the growth wave starts from this area.
You may watch the analysis for further details!
Thank you and Good Luck!
❤️PS: Please support with a like or comment if you find this analysis useful for your trading day❤️
Fundamental Analysis
Shorting Isn’t the Problem. Being a Psycho Bear Is.😵💫🪓 Shorting Isn’t the Problem. Being a Psycho Bear Is. 🔻📉
Hollywood is never wrong:
The genius from The Big Short is the psycho from American Psycho .
Same actor (C. Bale) — two sides of the same trader.
🎭 I made this chart because I see this often on TradingView:
People who prefer to short. Hoping for collapse.
Even Rooting for war. To Celebrating blood short profit.
Perma-bears who hate seeing price go up because they missed the trade.
Let’s be real — that’s not trading.
That’s emotional self-destruction masked as 'strategy'.
We just saw over $1B in shorts liquidated as Bitcoin ripped through $118K.
And still — some refuse to let go of their bias.
This chart says it all:
🔹 The "Smart Bear" — does research, uses structure, trades what’s real.
🔻 The "Psycho Bear" — needs things to collapse, just to feel right.
💔 And here’s the truth I want to share with you today:
If you catch yourself unable to celebrate others making money ,
If you feel angry when price pumps and you missed it,
If you’re wishing for collapse or chaos just so you feel seen...
Something’s off. That’s not trading. That’s pain talking.
Buying is more than just a trade — it’s hope , it’s optimism , it’s love .
Being bullish is an act of belief in the future.
And yes — we sometimes need to short. We do it with clarity.
But I’m a bull who sometimes must go short. Not a bear who wants the world to burn.
“We go long. We go short. But we never go blind.”
📉 Don’t let bitterness guide your charts.
📈 Let discipline, structure — and a bit of heart — guide you instead.
One Love,
The FXPROFESSOR 💙
⚠️ Disclosure:
Disclosure: I am happy to be part of the Trade Nation's Influencer program and receive a monthly fee for using their TradingView charts in my analysis. Awesome broker, where the trader really comes first! 🌟🤝📈

British Pound Futures (6B1!) Face Supply Area.Pound Futures: 6B1 Area Tests Bearish Resolve
Pound Futures are approaching a critical weekly supply zone (6B1). Today's price action saw a touch and rejection of this level, marked by a bearish candlestick. This suggests a potential for a short-term pullback, and we're eyeing a re-entry opportunity at this level, watching for a drop to the next significant demand zone on our chart.
Further reinforcing the bearish outlook is an intriguing divergence in the Non-Commercial trader positions revealed in the latest Commitment of Traders (COT) report, noticeable on the daily chart. This divergence hints at a possible shift in sentiment, paving the way for a short position. Should the price successfully breach the 6B1 area, our chart indicates another supply zone as the next potential target.
✅ Please share your thoughts about 6B1! in the comments section below and HIT LIKE if you appreciate my analysis. Don't forget to FOLLOW ME; you will help us a lot with this small contribution.

Silver: Daily Reversal Possible at Supply ZoneI'm anticipating a potential daily reversal in silver prices. Retail traders are maintaining a bullish stance, while commercial traders remain heavily short. The current price action suggests a possible reaction to a key supply area. What are your thoughts on the likelihood of a reversal, and what technical indicators might support or refute this potential shift?
✅ Please share your thoughts about SI1! in the comments section below and HIT LIKE if you appreciate my analysis. Don't forget to FOLLOW ME; you will help us a lot with this small contribution.

[CRYPTO] - Last Pump of the BULL CYCLE is ComingWe can see a highly organised bull cycle , with each multi-month consolidation wedge followed by a major leg upward, ending in breakout and continuation.
At the moment the CRYPTOCAP:TOTAL is breaking through the descending resistance again and ready to break thorough the 0.786 Fibo level as well - clear sign of the new up-rally beginning. Prior patterns (Q3 2023 and Q2 2024) led to vertical rallies , and the current structure suggests another leg may target the $6T+ zone in coming quarters.
What makes this different from past cycles is the underlying strength in Ethereum and other Altcoins. CRYPTOCAP:BTC.D has started to roll off highs, while projects like CRYPTOCAP:SOL , CRYPTOCAP:SUI and AI-related chains ( NYSE:FET , GETTEX:TAO , EURONEXT:RNDR ) are gaining TVL and developer traction. This is not just retail speculation—institutional capital is increasingly driving flows.
Moreover , Bitcoin ETF keeps getting huge daily inflows, the narrative of Coinbase including in S&P500 and Stablecoins velocity rising helps in spreading the crypto narrative between insituational & retail investors.
You can read more about why I expect a ton of money to inflow crypto in the next 6 - 12 months in one of the previous ideas: Again/
Overall , the chart structure, macro catalysts, and expanding adoption point toward a potential parabolic leg into late 2025 or early 2026. As long as the market holds above $3.3T, the breakout is valid and bulls are in control. The target is $5.5T —and possibly higher.

Try shorting once below 3355!The market closed at 3326 on Thursday and still failed to break through the small range of long and short positions. The overall market is in a strong bullish trend and this trend indicates the possibility of a breakout in the future. In this week's trading example, after confirming that the 3315 low support is effective, a short-term long operation was successfully carried out below the area and profited. The picture and truth can be checked in the article on Thursday. In the short term, continue to pay attention to the range shock and pay close attention to the breakthrough direction of key points. The first thing to pay attention to is the strong pressure of 3355. If it breaks through and stands firmly at this position, it will open up further upward space, and the potential target can be seen in the 3365 or even 3400 area. On the contrary, if the gold price is always under pressure below 3355, the market is likely to continue the current shock and consolidation rhythm. Therefore, breaking through the 3355 mark will be a key signal to judge whether the market can release significant upward momentum in the future. Before the effective breakthrough, continue to intervene in the low-long opportunity at the 3325-15 support level of the shock range. On the upper side, you can arrange short positions at 3345-3455.

XRP SKYROCKETS AND BREAKSOUT PRICE RANGE! ⭐️In a pretty crazy twist and turn of events we're seeing XRP absolutely skyrocket and breakout with this morning's announcement on behalf of President Donald Trump with his Truth Social media platform announcing it had filed for a Crypto Blue Chip ETF with the SEC.
⭐️ The Blue Chip ETF proposal includes 70% holdings in Bitcoin, 15% in Ethereum, 8% in Solana alongside 5% in XRP and 2% in CRO which is from Crypto.com. This notably has led to the breakout with XRP that we're currently seeing with the crypto already up 12% since the day started and news broke out. It's still early morning too so we'll see how the market reacts as the day continues and traders wake up to the news.
⭐️The past few weeks have seen XRP stuck within this horizontal channel and constant tug a war between $1.90-$2.30 with this breakout and the last week signaling bullish optimism towards the crypto alongside news of the BNY-Mellon deal with BNY Mellon set to become the Custodian for Ripple's RLUSD Stable coin. And for those that don't know BNY-Mellon is America's oldest bank having been founded in 1784 and with an estimated $45.7 trillion in assets under custody and/or administration. To say in the least this is a big step for Ripple showing more institutional growth.
⭐️To note also is this as I'll show below on Bitcoin's chart:
⭐️ It's crazy to say but we've just seen Bitcoin form a new All-Time High at $118,100 alongside the Crypto Blue Chip announcement, more than likely with investors and institutions flocking to buy in before the ETF get's approved and likely in anticipation of a bullish shift.
⭐️ We've already seen the crypto space weather the storm through the last few weeks and months with everything that's happened from global escalations to all the new bills and changes in the government. Through thick and thin the crypto space has proved resilient and investors are taking note.
⭐️ Have to run for work but wanted to get a quick idea out there, especially since this news just broke out. Some pretty crazy stuff and I'll be watching these levels here to see if things continue or if the news has simply given us a breakout, regardless it's a win-win with all this news only pushing the directive and story towards crypto and digital assets for many. I'll attach a link below to an article on the Blue-Chip ETF for reference as well.
⭐️ Thanks so much as always and all the best till then, feel free to keep posted for more updates and ideas as we continue on this journey we've been riding the last few years already. It's been a lot but it's got much more to go. Let's keep at it and keep our heads up.
⭐️ Reference on Crypto Blue Chip ETF:
apnews.com
Best regards,
~ Rock'

Trump's tariff news stimulates gold to explode!
📌 Driving Events
Gold prices rose for the third consecutive day and are expected to close higher this week. The trend turned in favor of gold buyers as tariff tensions intensified. US President Trump announced new tariffs, exacerbating concerns about a trade war.
📊Personal Comments:
Signs of instability in Trump's trade policy have once again hit investor confidence, reviving safe-haven demand for gold. In the absence of any top US economic data, the market will continue to focus on trade headlines. Weekend fund flows may also drive gold price movements.
⭐️Set Gold Price:
🔥Sell Gold Area: 3360-3369 SL 3374
TP1: $3355
TP2: $3342
TP3: $3325
⭐️ Note: Labaron hopes that traders can properly manage their funds
- Choose a lot size that matches your funds
DXY strengthens but can it break THIS key level?The US dollar has gained ground this week, with the Dollar Index rising to retest the previously broken April low near the 97.92 level—an important technical zone. The short-term bias would flip to being bullish if this area breaks.
The greenback’s strength has been underpinned in part by unexpectedly strong economic data. For instance, Thursday’s weekly jobless claims came in at 227,000, below the forecast of 235,000. This marks the fourth consecutive weekly decline and the lowest reading in seven weeks, reinforcing the view that the US labour market remains tighter than anticipated.
Adding to this backdrop are President Trump’s threats of higher tariffs and expansive fiscal plans—described as “big, beautiful” spending and tax initiatives. These factors increase the risk of more persistent inflation.
While the Federal Reserve is still widely expected to initiate rate cuts in September, the rising inflationary pressures could slow the pace of easing thereafter. This shift would likely provide support for the dollar so long as investors don't lose trust in US monetary policy.
By Fawad Razaqzada, market analyst with FOREX.com

BTC BULLS IS IN CONTROL Bitcoin holds strong in its bullish sentiment, securing a fresh high at 111K.
With momentum on its side, a new projection toward 120K is now firmly in play — the bullish trajectory stays intact. 📈
Momentum traders, stay alert. This leg might just be getting started. follow for more insights , comment and boost idea .

BANK OF KIGALIThe Bank of Kigali has strong fundamentals that can go unnoticed to most. It is a strong Bank serving one of the fastest growing economies in Africa, with about a 30% holding of Rwanda's Banking sector.
Fundamentally, the Bank of Kigali is undervalued. We will be looking at accumulating the Bank of Kigali in the coming months..

Gold Market Rejects 3330 – Bullish Sweep Targets 3356Gold market forms a new stance as 3330's fail to hold significant supply. This rejection triggers a bullish sweep, with price now poised to target 3356 for the next leg of movement. Watch for continuation signals as momentum builds.follow for more insights , comment and boost idea
THE LONG SHOT 〉POTENTIAL OUTLOOKAs illustrated, I'm trying to visualize how a potential continuation impulse could look like during " Bullish July " and toward the end of the year (depending on how aggressive buyers step in; specially central banks and institutions).
As you can see on this Daily chart, price respected a long term trend line + is forming higher lows, funneling into a shorter and shorter range of accumulation.
This is a very strong bullish behavior; when price gets tighter and tighter respecting a resistance level, but making higher lows. It tends to indicate that price is accumulating and "loading" (sort of speak).
Now, analyzing gold from the fundamental aspect, one MUST align those factors with price. In other words: DOES IT MAKE SENSE TO BE BULLISH OR "THINK" PRICE COULD RISE?
Well, ask yourself and do the research on the following (but not limited to) questions:
1. How is the US dollar doing? (Since it is the world's "reserve" currency)
2. Are the interest rates in the USA favoring the economy?
3. How is the world economy as a whole doing?
- inflation in the top world powers and important economies?
4. How is international trade policy looking like for the world?
- Positive or negative? Are countries happy with each other currently, trading without any issues? (Or maybe... there's a tariff war and a trade war goin on?...)
5. Politically speaking, is the general public UNITED or POLARIZED? (politics is a key fundamental aspect for the price of gold, as it either adds to uncertainty and tensions, or it calms things down).
6. Geopolitically speaking (and most importantly); is the "conflict" (war) ending, getting better, resolving? ...
7. Where is the money going and flowing? Black rock, vanguard, and other top hedge funds; where are they investing their money? ( because central banks keep BUYING gold... )
Those are some of many many questions one must study and understand, in order to align the technical aspects of the price of the yellow metal.
If any question/factor DOES NOT POINT to bullishness in price, then the technical and price projection of any analysis starts to have weakness.
On the other hand, if the fundamental factors and questions in play INDEED POINT toward an uncertain situation, adding bullishness to the price, any analysis and bullish projection simply has those aspects to its favor.
--
GOOD LUCK!
persaxu

Overall Trajectory BullishEntering long positions on XAU/USD based on a confirmed 3-Drive pattern on the H4 timeframe, aligning with confluence from the 61.8% Fibonacci retracement zone.
As long as price stays and holds above 3200 I will remain bullish, if there is a close below 3200 then my analysis will be subject to change. Strong resistance will be at 3400 if it holds then the target is 3641 with a minor pullback at 3548.

PHM (PulteGroup) – High-Probability Swing Trade Setup📈 Symbol: PHM (PulteGroup)
⏳ Timeframe: Daily Chart
⚡ Strategy: Swing Trade (2-4 Weeks)
🎯 Trade Setup
Entry Zone: $114.00 (Daily SMA 20 + Psychological Support)
Stop-Loss (SL): $104.80 (8% below entry, below SMA 50)
Take-Profit (TP): $133.10 (+16.7% upside, Historical Resistance)
Risk-Reward Ratio: 1:2.4 (Controlled Risk, High Reward)
📊 Technical Analysis
✅ Trend:
Strong Uptrend across all timeframes (Daily, 4H, 1H).
Higher highs & higher lows confirmed.
✅ Key Support Levels:
$114: Confluence of Daily SMA 20 + 38.2% Fibonacci retracement.
$110: Daily SMA 50 (Institutional accumulation zone).
✅ Indicators:
RSI (14): 69.51 (Neutral, no extreme overbought signal).
MACD: Bullish crossover + Positive histogram expansion.
Volume: Rising on bullish candles (Confirms buying interest).
Key Levels:
Resistance: $120 (Recent High), $133.10 (Final Target).
Strong Support: $104.80 (Technical SL level).
💰 Fundamental Backing
Strong Growth:
+Strong Growth in Net Income (+18.5% YoY).
Stable revenue in a resilient housing market.
Healthy Balance Sheet:
Minimal Debt (Score 10/10, Debt/Equity: 0.17).
Fair Valuation (P/E 8.13 – Undervalued vs. sector).
Catalyst: U.S. Housing Demand + Pro-Housing Policies.
⚡ Trade Execution Plan
1️⃣ Entry: $114.00 (Confirmed Technical Support Zone).
2️⃣ Stop-Loss: $104.80 (Protects against trend reversal).
3️⃣ Take-Profit: Scaled Exit –
TP1: $120.00 (Sell 50% to lock in profits).
TP2: $133.10 (Trailing stop to capture momentum).
4️⃣ Dynamic Management:
Move SL to $110 after reaching $120 (Secures gains).
📌 Why PHM?
Strong Sector: Housing market recovery with sustained demand.
High Liquidity: Avg. Volume ~2.5M shares (No slippage risk).
Technical + Fundamental Alignment:
Uptrend + Strong Fundamentals = High Probability Trade.
⚠️ Risk Management
Max Risk per Trade: 1-2% of capital.
Avoid Key Events: Interest rate reports (Check economic calendar).
🎯 Final Call: BUY PHM at $114, SL $104.80, TP $133.10.
🔔 Follow for More Swing Trade Setups!
👍 Like if You Find This Helpful!
#TradingView #Stocks #PHM #SwingTrading #RealEstate #TechnicalAnalysis
(Disclaimer: Not financial advice. Do your own research.)

ITS TIMEGME coiled on the 4hr RSI break 50 were launching from the POC area to 24.50 to next MA. Overall target after taking 26 is VAH around 27.58. The drop down was profit taking/ overextended /sell the news after all the hype leading into the btc purchase announcement they didn't disclose purchase price either from what I know. But btc is at ATH the 500M is now in decent profit and last quarter rev and earnings were good. Last time gme broke out was 17% on a overall stock market correction day, seems like thats going to be the case again for now im in the Aug 1 25 calls for .6 looking to close these in profit and roll to higher further out strike like the jan 26 35. cheers, here kitty kitty.

Gold Possible Retest of $3,365 Before Downside MoveGold is currently trading around $3,335, approaching a critical resistance level at $3,365, which has been marked as a “Main Resistance” on the chart. The recent price movement shows a strong bullish rebound from the $3,293–$3,300 support zone, breaking above two key trendlines labeled "Breakout."
The chart suggests a potential “retest” of the $3,365 resistance before another downward move, as marked by the annotation "Possible Retest and Then Down." This idea is reinforced by the broader descending channel pattern visible from late June, indicating that the larger structure still favors bearish continuation unless a strong breakout occurs above $3,365.
⚠️ Bearish Confluence
Price is inside a corrective channel, repeatedly failing to sustain above prior highs
$3,365 has held firm multiple times as resistance — a strong horizontal and trendline convergence zone
Price is still well below the swing high at $3,392
🟩 Bullish Scenario (If Invalidation Occurs)
If price breaks and closes above $3,365, it would invalidate the current bearish structure and open the door for upside targets like:
$3,392 (previous high)
$3,412
Possibly $3,434, which is a longer-term diagonal trendline resistance
At present, gold is in a corrective upward move within a broader bearish channel. The zone between $3,337–$3,365 will be key. A bearish rejection here would confirm downside continuation, with price potentially targeting $3,265–$3,220. However, a bullish breakout above $3,365 could invalidate the bearish view and suggest strength returning toward $3,392 and above.
Note
Please risk management in trading is a Key so use your money accordingly. If you like the idea then please like and boost. Thank you and Good Luck!

How to seize gold trading opportunitiesNews:
On Friday (July 11) in the Asian time zone, US President Trump posted a "tariff change" on social media, announcing that a 35% tariff would be imposed on all Canadian goods from August 1, a 10 percentage point increase from the current rate. This decision was like a thunderbolt, instantly igniting the market's risk aversion sentiment, and the spot gold price soared, reaching a high of $3,344 per ounce during the session. Although Trump extended the tariff agreement to August 1, which once suppressed the gold price, he subsequently stated that it would not be extended after the expiration, and launched further tariff attacks after the expiration, announcing a new 50% tariff on copper imports from the United States and a 50% tariff on goods from Brazil, which increased concerns about tariff risks and pushed the gold price to rebound from the bottom;
Gold trend analysis:
The market is fluctuating repeatedly now, and it is possible to rise or fall, but under the bullish trend, the main force is still rising. Therefore, this week's trading is to fall back and do more at a low price. Whether it is the previous 3285, 3304, or 3317, there are good profits. Although it is temporarily unable to break out of the bullish volume, at least the trend remains unchanged, and there will definitely be a large upward space in the future. Today is Friday, and we still pay attention to the possibility of bullish volume. This Monday has been emphasizing that if it rises during the week, it will look at the 3345 high point. If 3345 breaks, there are still 3365 and 3400 above. Friday will see whether this idea is realized.
From a technical point of view, all cycles are obviously bullish now. The daily line bottomed out on Tuesday, and Wednesday and Thursday were all small broken Yang rising. If it continues, we will first see whether the daily Bollinger middle rail 3345 pressure is broken. After the break, the big Yang closes high. This wave of rise may reach 3400. Therefore, the daily cycle has a lot of room for growth and should not be taken lightly. The H4 cycle needs to see whether today's rise can break 3345, because if it breaks 3345, there is a possibility of the upper rail opening. After the upper rail opens, gold will have a unilateral trend. Therefore, today's bullish target is 3345. If 3345 is not broken, there is still a possibility of a decline. If 3345 breaks, there will be 3365 and 3400 above. Here, it is clearly bullish and optimistic about the break of 3345. After determining the direction, the trading idea on Friday is also clear. It must be mainly long on the decline. The support below is 3320-3310. Don't chase more in the European session. Trade again if there is a decline.
Gold operation strategy: It is recommended to go long if it falls back to around 3315-3325, with the target at 3335-3345; it is recommended to consider shorting if it touches 3345 but does not break, with the target at 3335-3325.

AAPL: The Rally Might Not Be OverWhile many tech giants have already reached new all-time highs, Apple is still lagging behind — NASDAQ:AAPL hasn’t yet broken out. This may represent both a risk and an opportunity for latecomers.
Investor caution remains due to potential tariffs on Apple products from China, with the decision now postponed until August.
This uncertainty may be holding the price back, but could also lead to a strong accumulation phase if no negative headlines emerge in the near term.
Technicals:
• A breakout above $215 could open the way toward $249 (previous high).
• Support at $197 remains strong.
• Stochastic is in overbought, but MACD confirms bullish momentum.
NASDAQ:AAPL may start catching up with the broader market — especially if tariff fears subside. Watch closely for a confirmed breakout above $215.

GOLD → Distribution. There is potential for growth to 3450–3500FX:XAUUSD breaks through consolidation resistance and forms a distribution pattern. A breakout of 3345-3358 could lead to another rally amid high economic risks...
Gold is rising for the third day in a row amid growing concerns about new tariffs announced by Trump. He threatened to impose tariffs on Canada and most of its trading partners, as well as the EU. Despite the strengthening of the dollar, demand for gold remains strong due to uncertainty and expectations for US inflation data next week. Investors are cautious ahead of CPI and the Fed's possible response
The correlation between gold and the dollar is declining, with gold rising due to geopolitical reasons amid high economic risks.
If the bulls keep the price above 3300-3345, the market could be extremely positive for 3400-3500.
Resistance levels: 3345, 3358
Support levels: 3330, 3308
Gold has broken through the resistance of the “triangle” consolidation pattern and is forming a distribution phase towards the zone of interest 3345 - 3358, from which a small correction may form before growth. Since 3345 is an intermediate level, the focus is on 3358. I do not rule out the possibility of a long squeeze of the support levels 3330, the triangle support, and 3310 before the growth continues.
Best regards, R. Linda!

Ready to Ride the Wave? Let’s Go Long — Together.Market momentum is shifting — and opportunity awaits. This is more than a bullish move; it’s your moment to elevate your trading game. Whether you're just starting or refining your edge, clarity and confidence are key.
If you’re tired of second-guessing setups and want guidance that brings structure and consistency to your trades, now’s the time to level up. I help traders align with the market, build smart systems, and take charge of results — no fluff, just precision.
🚀 Tap into growth with mentorship that works. Let’s go long — on your potential.
#tradingview #forexmentor #buysetup #tradingeducation #marketmomentum #consistencyiskey

Skeptic | Why did Bitcoin grow? What’s the next move?Unemployment rate’s up...
lemme explain short and sweet. When unemployment —a key factor for setting interest rates —rises, the Federal Reserve’s got no choice but to lower rates so companies can hire. Lower rates = more liquidity = Bitcoin and stocks go up.
What’s the next move?
Around $ 120,000 , there’s about 1 billion in short liquidity positions. also it overlaps with the weekly pivot point level 4 . I see a high chance of correction or ranging here. Personally, I opened a position before the $ 110,513 breakout ( i shared in this analysis ) and only took profits. If you’re still holding, I suggest not closing yet—once the $ 110,000 resistance broke, Bitcoin’s major weekly trend woke up, so we could see more growth.
If this analysis helped you, hit that boost—it fuels my mission! 😊 Stay disciplined, fam! ✌️

XAUUSD Approaches Key Resistance – Will 3,345 Hold or Break?As of July 11, 2025, gold (XAUUSD) is showing a mild recovery around 3,331 USD, following a rebound from the 3,318–3,322 USD support zone. This move comes amid a wave of macroeconomic data and global monetary policy expectations that continue to weigh heavily on gold’s intraday direction.
1. Key Fundamentals Impacting XAUUSD Today
Dollar Index (DXY) remains strong near 106.0 – sustaining pressure on gold due to a firm greenback.
U.S. 10-year Treasury yields are holding above 4.36%, reflecting persistent market expectations that the Fed may keep interest rates elevated in the near term.
June CPI data (YoY) came in at 2.4%, slightly below forecast (2.5%), increasing hopes for a potential rate cut in Q4 – a short-term bullish catalyst for gold
Geopolitical tensions remain subdued, limiting safe-haven inflows into gold in the medium term.
Upcoming U.S. PPI data this week could trigger volatility, depending on whether it surprises to the dovish or hawkish side.
2. Technical Analysis – XAUUSD on H4 Timeframe
Support zone: 3,316 – 3,322 USD, aligning with the 0.5–0.618 Fibonacci retracement of the latest bullish leg.
Resistance zone: 3,345 USD – a confluence of previous highs and 0.618 Fibonacci level of the prior correction wave.
EMA outlook: Short-term EMA is turning upward, indicating potential bullish momentum building.
RSI: Recovering toward 60 but not yet overbought – a sign of healthy upside potential, though confirmation is still needed.
3. Trade Scenarios to Consider
Bullish Breakout Scenario (if price breaks 3,345 USD):
Entry: Buy on H4 candle close above 3,345 USD
Target: 3,357 – 3,370 USD
Stop-loss: Below 3,322 USD
Bearish Rejection Scenario (if price fails at 3,345 USD):
Entry: Sell on bearish reversal candlestick (e.g., pin bar, engulfing) at 3,345 USD
Target: Revisit support at 3,318 – 3,309 USD
Stop-loss: Above 3,350 USD
Gold is trading in a decision zone between short-term support and a major resistance barrier. While macro fundamentals are slightly leaning bullish after soft CPI data, strong dollar strength and high bond yields still cap upside momentum. Traders are advised to wait for price confirmation at 3,345 USD before committing to directional setups.
Follow for more daily gold trading strategies, and save this analysis if you found it useful!
