$UBER: Why $UBER Is a Robotaxi WinnerUber is on the verge of a major transformation, with robotaxis set to become a game-changing profit engine.
Technical charts indicate we can enter a long position today with low risk, while aiming for a long term rally resumption from here. Monthly and quarterly timeframe Time@Mode trends are bullish, suggesting price can reach heights between $111, $176 and $265 per share long term.
Here’s why the future looks bright for Uber investors from a fundamental perspective:
The global robotaxi market is projected to surge from $0.4B in 2023 to $45.7B by 2030, with Uber aggressively expanding its autonomous fleet in the U.S. and Europe through partnerships.
Uber’s approach is to integrate autonomous vehicles from partners (Waymo, May Mobility, Momenta, Avride, Volkswagen) into its platform, avoiding the massive costs and risks of building its own AVs.
Autonomous vehicles will slash Uber’s largest expense -driver payments- unlocking higher margins and scalability. CEO Dara Khosrowshahi calls AVs Uber’s “greatest future opportunity” for profit expansion.
Robotaxi pilots are already live in cities like Austin, with plans to expand to Atlanta, Dallas, and Europe by 2026. The average Waymo vehicle on Uber is busier than 99% of human drivers, showing strong demand and efficiency.
Uber’s core business is robust: Q1 2025 gross bookings up 14% to $42.8B, net income of $1.8B, and adjusted EBITDA up 35% to $1.9B. This profitability funds AV investments without sacrificing financial health.
Uber is uniquely positioned to lead the robotaxi revolution, leveraging its platform, partnerships, and financial strength. As AVs scale, expect a step-change in profitability and long-term shareholder value.
Best of luck!
Cheers,
Ivan Labrie.
Fundamental Analysis

Profit takingThe structure in the S&P 500 daily chart implies profit taking on Friday. The expectation is there will not be dramatic selling on Monday. It is important to keep in mind a broader structure is a potential double top which could present a long-term high for this market.

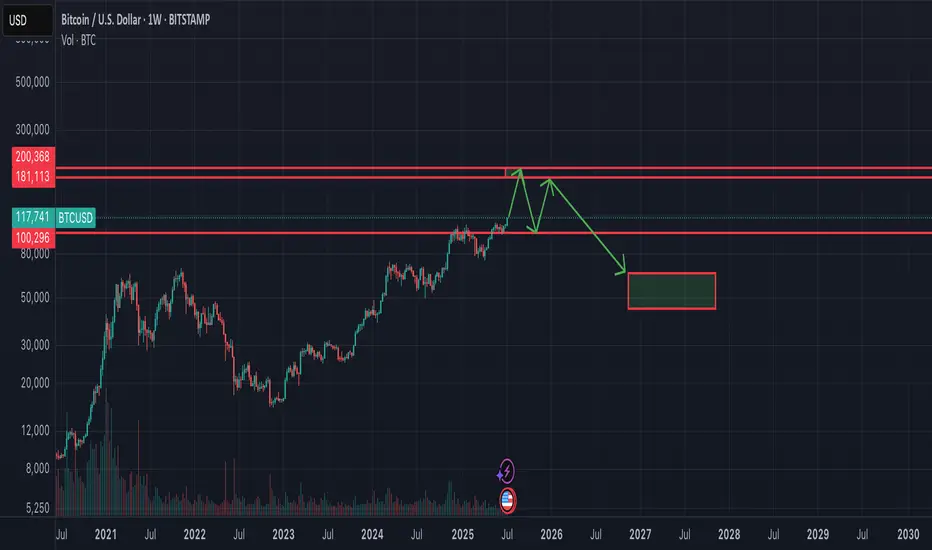
End of Bitcoin cycle this Year nearly 180-200k$ The Great Depression 2.0 ahead and all politicians already know it and prepare to blame all their troubles on the crisis.. I think Bitcoin will reach 180-200k$ till the beginning or the end of september. Need to track the price of gold - Bitcoin ATH near the 55 oz of gold!
After reaching the peak - there will be dump -50%. September and October as the best months for bitcoin in 2025 would be the worst months. November and December maybe green - to close some nice year candle (giving to altcoins last chance for performing) and after that going into the bear market.
What's the deal with BRK.B?! Where is the short term bottom?I'm pretty new to this, so I'm looking to see if anyone has any thoughts about BRK.B. The best looking support is the April low, but it seems like it could fall below to the Jan 2025 low with the way it is steadily dropping. That would suck! I'm averaged at $491 and prefer not to see it go that low, but I will be holding very long-term anyway.
Any thoughts on a bottom? They hold 300+ billion in cash, so surely they'll figure out what to do with it soon. *Fingers crossed*

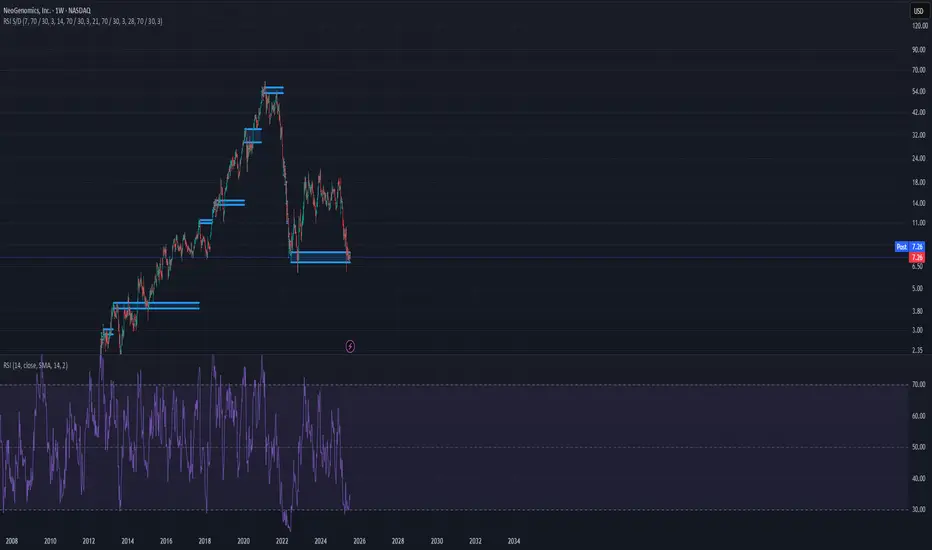
A 50% increase in a short time This stock presents a compelling opportunity, backed by strong fundamentals and a healthy financial outlook. On the technical side, it's forming a bullish chart pattern with clear support levels — indicating strong institutional interest. The setup suggests potential for a breakout if current momentum continues.
DIYWallSt Trade Journal: Missed Entry & Climbing Back From Loss **07/11/25 Trade Journal, and ES_F Stock Market analysis **
EOD accountability report: -46.25
Sleep: 5 hours
Overall health: Good
** VX Algo System Signals from (9:30am to 2pm) 3/3 success**
— 9:41 AM Market Structure flipped bearish on VX Algo X3!
— 10:15 AM VXAlgo ES X7 Buy signal,
— 10:23 AM Structure flipped bullish
— 11:30 AM VXAlgo ES X3DD Sell Signal
**What’s are some news or takeaway from today? and What major news or event impacted the market today? **
I was a little busy this morning and missed the chance to short the market at MOB with Bearish market structure at 9:30, so I had to wait for the next chance but when i shorted the MOB on the move up, the X7 buy signal came out and pushed market structure bullish.
Ultimately If i had a better entry on my short, I would have been okay, but since i shorted early, i got stopped at at 6306 and it ended up dropping right after that. So the day actually started pretty bad and i was -300 from there and was just trying to climb back and forth the next few hours.
News
*LATEST TARIFF THREATS COULD DELAY RATE CUTS, CHICAGO FED’S GOOLSBEE SAYS - WSJ
**What are the critical support levels to watch?**
--> Above 6290= Bullish, Under 6280= Bearish
Video Recaps -->https://www.tradingview.com/u/WallSt007/#published-charts

Where will gold prices go at the weekly close?The mentality of trading is very important. At the same time, you must have clear ideas and decisive actions. Gold has been in a state of rapid growth. Many people are easily led to big losses by a small mistake. If you are worried about the loss at this time, you can choose to observe our daily operations in the group. The operations in the group are reasonable and well-founded, with real-time current price orders, and the returns are also considerable. Everyone is welcome to come and verify.
Gold risk aversion has driven gold to strengthen. The current bullish trend of gold is strong. The decline during the US trading session is still dominated by long positions. Technically, the 1-hour moving average forms a golden cross upward, indicating sufficient bullish momentum. After the gold price breaks through, it is confirmed that the support level of 3330 is effective, and the short-term support structure has been formed. It is recommended to wait for the second opportunity for the gold price to step back! Although the 1-hour chart shows that the current trend remains strong and the step-back amplitude is small, it is necessary to maintain a cautious attitude-even if the market is strong, it is not recommended to chase more, and it is necessary to guard against the risk of a deep correction in the gold price. In terms of operation, it is reminded that you can focus on the support level below: the first support level is 3345 (bull-bear watershed). If it falls below, pay attention to the key support of 3330. If the gold price falls back to around 3345 and stabilizes, you can consider a light position to try more.

ConAgra Brands | CAG | Long at $19.38ConAgra Brands NYSE:CAG , maker of Marie Callender's, Healthy Choice, Birds Eye, Orville Redenbacher's, Slim Jim, and many more, has seen a continuous drop in share price since the rise of interest rates, inflation, and tariffs. The stock is currently trading near its book value of $18.71 and has a dividend yield of 6.9%. Debt-to-equity is reasonable (0.9x), but the company does have a Quick Ratio of 0.2x (short-term liquidity issues) and a Altman's Z Score (bankruptcy risk) of 1.7, which should ideally be 3+. Like almost every large-scale food company, earnings growth is relatively low, but 2025 is anticipated to be its worst performing year - which explains the price.
While the stock is not likely to generate triple-digit returns in the near-term, NYSE:CAG is a strong company with a nice dividend and some growth ahead. I foresee such stocks getting new life with drops interest rates. However, a dip near $17 (into my "crash" simple moving average area) or even slightly lower is possible - which may likely result in another stock entry.
Thus, at $19.38, NYSE:CAG is in a personal buy-zone with future entries planed near $17 or below.
Targets into 2028
$22.00 (+$13.5%)
$25.00 (+29.0%)

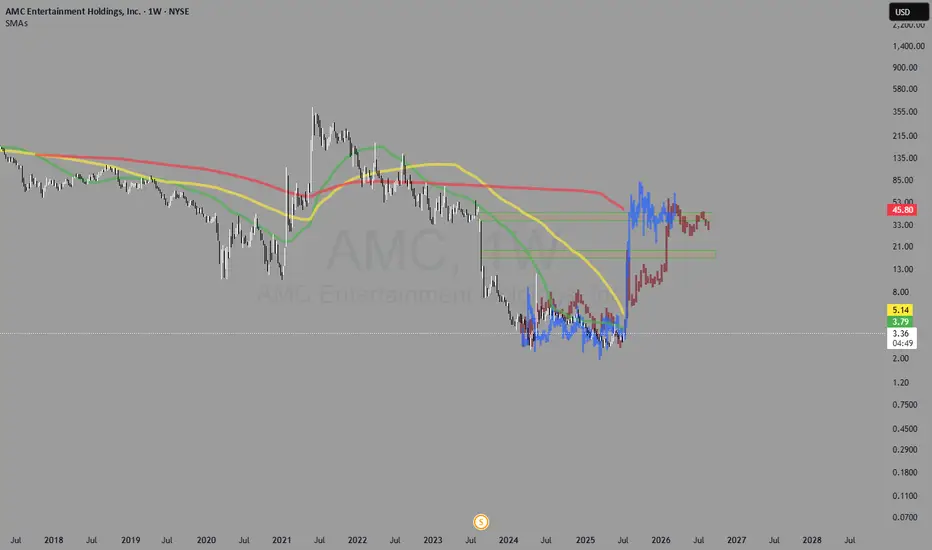
Call your mom. This stock has taught me how to trade. I found it. I bought it for the first time in 2021 and that's how my trading journey began.
Now in July of 2025, I think we might see movement we have been waiting for over the past years.
I remembered a documentary I watched over 15 years ago about a trader making unreal returns (1000s% per year) discussing his strategy. The key points I remember are the deviation from the SMAs. Stocks, that are laggers, kissing/sitting at/over moving averages, especially sitting right above the 100 day moving average for a prolonged period of time (just watch BX:GMES weekly on the 100 SMA;)) and how those stocks see INSANE amount of gains, when they move. I wish I remebered the exact documentary. I see it coming to life in these memes, it seems.
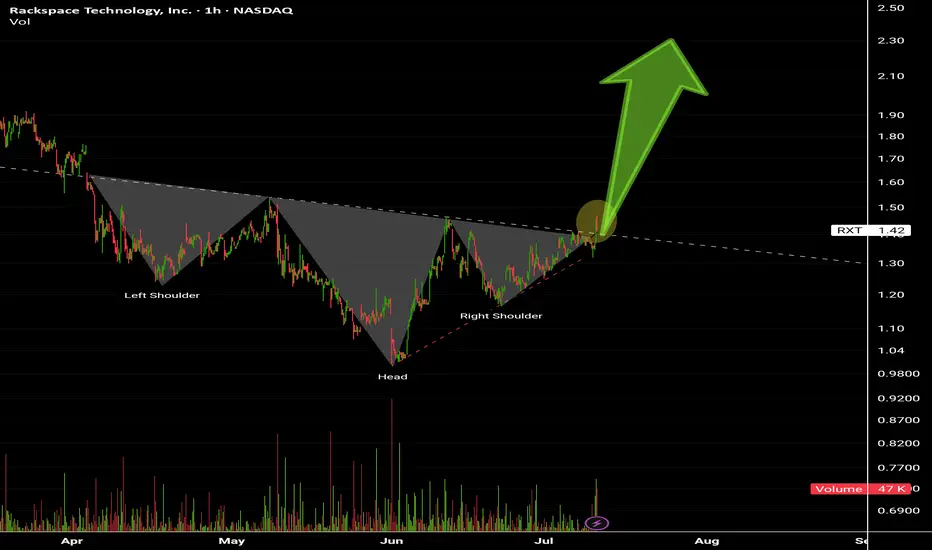
Rackspace Technology inc Inverted Head and Shoulders pattern.
Breaking 1.42$ Today.
Target price above 2.2$ .
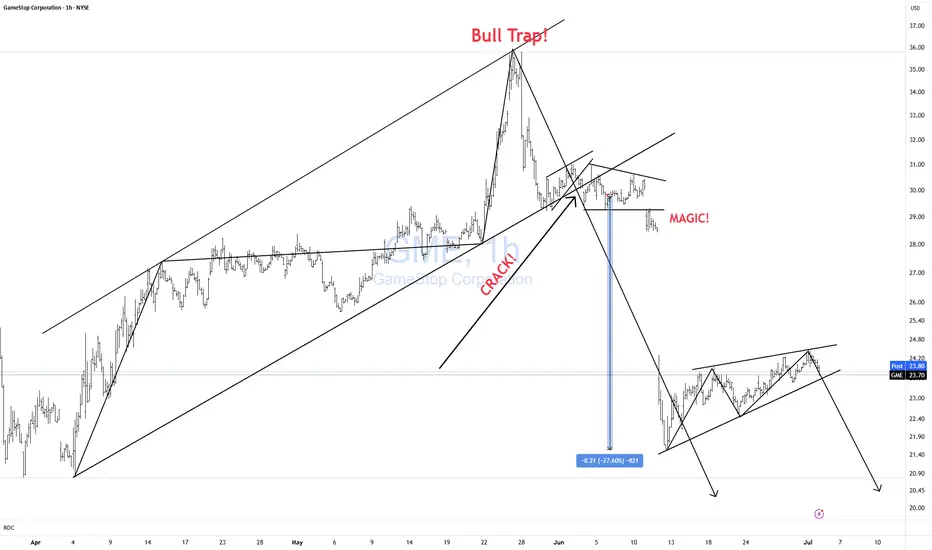
GME CRACK?Unfortunately, I keep getting forced to create new posts for the same Isea bc TV forces me to "target reached" on updates. Here is my previous post.
We have yet another bearish formation setting up in GME. Rising bearish wedge.
Wait for the CRACK!
Click Boost, like, follow, and subscribe for more!
NFLX CRACK!!Classic breakdown move from a rising F flag!
Massive Head and shoulders formed, that head test followed through, taking out stops, and now failing off the top of the channel.
Screaming CAUTION to the bulls!
Nice simple short setup for bears.
Click boost, follow, and subscribe. Let's get to 5,000 followers. ))

Rejection from Supply Zone, Bearish Continuation Toward PDLAfter failing to break out with strength and confirm the demand zone, EUR/USD is showing signs of a bearish continuation. The price was rejected from the Demand Zone near the NY High, indicating a possible shift in momentum.
This setup suggests the pair may continue its downward trend, aiming for the Previous Day Low (PDL) around 1.16620. With a favorable risk-to-reward ratio of 1:5, this move could present a clean and high-probability short opportunity as long as bearish structure holds.

Although the bulls are strong, don't chase them at high levelsGold trend analysis:
The market is fluctuating repeatedly now, and it is possible to rise or fall, but under the bullish trend, the main force is still rising. Therefore, this week's trading is to fall back and do more at a low price. Whether it is the previous 3285, 3306, or 3315, there are good profits. Although it is temporarily unable to break out of the bullish volume, at least the trend remains unchanged, and there will definitely be a large upward space in the future. Today is Friday, and we still pay attention to the possibility of bullish volume. This week, we have been emphasizing that if it rises during the week, we will see the 3370 high point. If 3370 breaks, there are still 3380 and 3400 above. On Friday, we will see whether this idea is realized.
From a technical point of view, there was a sharp pull this morning, with the big sun breaking through the upper track of the downward channel 3326 in the above figure, and then stepping back to confirm stabilization and bottoming out, which means that the breakthrough is effective, so you can directly follow the bullish trend in the morning, and during the European session, it repeatedly went up and down around the 3345-3332 range. With the experience of yesterday's trend, today we have been waiting for it to approach the 10-day moving average and then continue to be bullish on dips, and the entry point is basically good; currently it has broken through the resistance level of 3345 in the European session, so it depends on whether it can stand directly on it tonight. Once it stands, it can gradually rush to 3370, and the second is 3374, etc.; Of course, if it just pierces but does not stabilize, it will continue to spiral slowly upward around the yellow channel in the figure, so continue to wait patiently for the 10-day moving average, which is also the lower track position to grasp the low and long; Therefore, tonight gold 3345-3333 continues to rise on dips, with 3330 top and bottom positions as nodes, resistance at 3370, further resistance at 3374, etc.; If there is an unexpected big negative inducement to empty the market like yesterday, pay attention to stabilization above 3320 and still bullish;
Gold operation strategy: It is recommended to go long when it falls back to 3333-3345, and the target is 3360-3370.

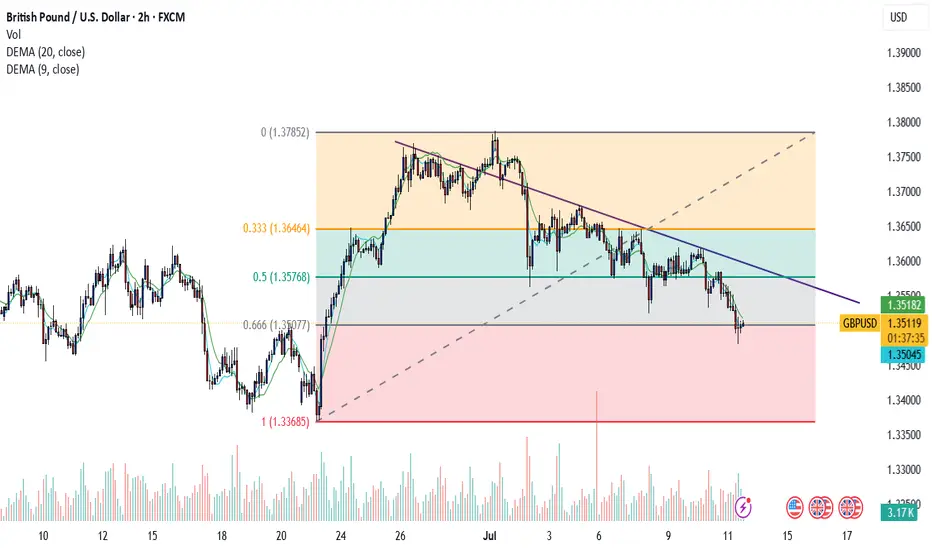
STRONG BUY BRITISH POUNDits getting close from the 33 line of the fibo and its creating a bullish engolfing , take your position tight
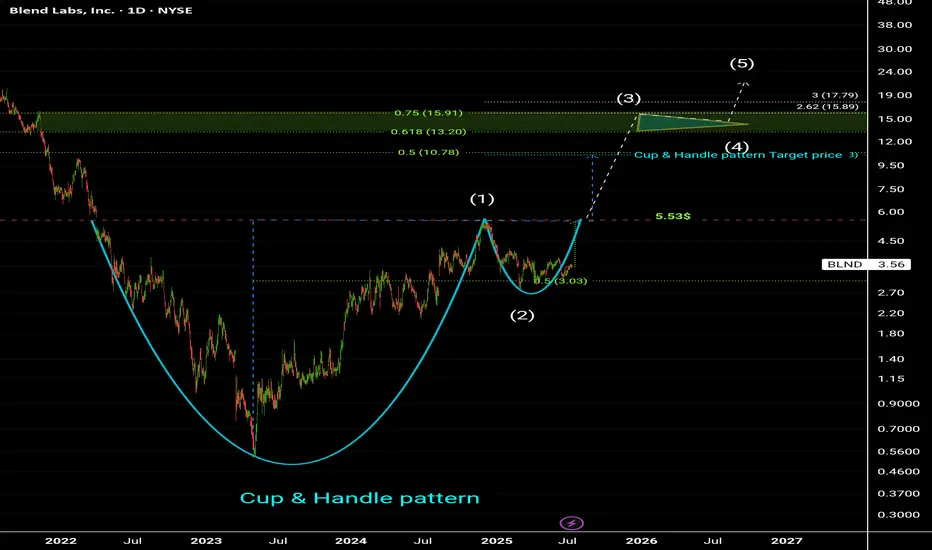
Blend labs inc (BLND).Cup and Handle pattern at the bottom
Target prices on chart.
Highly recommended for Buying now 👌
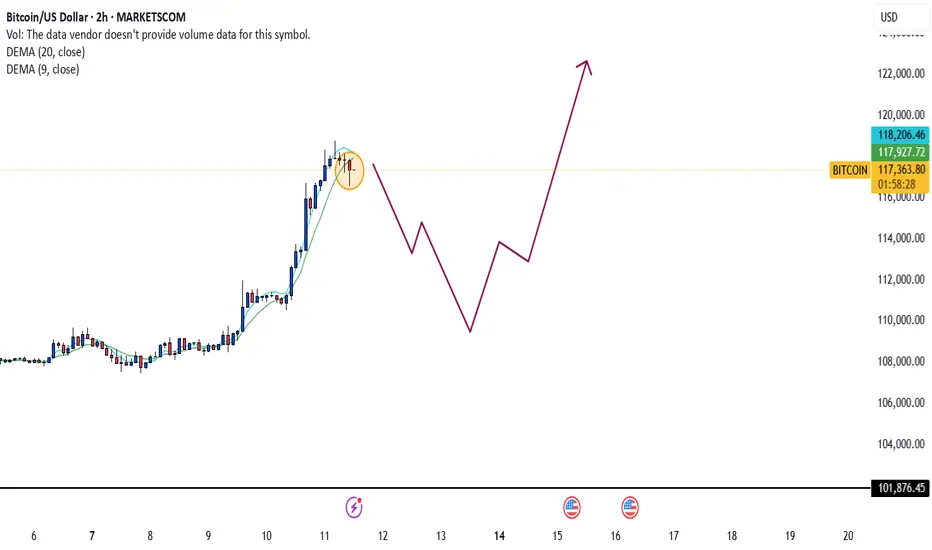
Bitcoin Money machinebeautiful bearish candlstick has been created a the top of the wave , thechnicaly the price might go for a retracement to fuel back up again , place a short position while maintaining a good money management its tricky some time with what's going on
barrick, run it hotfiscal dominance adding downward pressure on dollar. long term chart look favourable with key fib levels being touched. added copper exposure in usa, abx has some legs

Green Plains | GPRE | Long at $4.18Green Plains NASDAQ:GPRE , a company involved in the production of fuel-grade ethanol and corn oil, and grain handling/storage has seen a significant decline in stock price since 2023. Analyzing the company's historical stock performance shows it is highly cyclical and goes through "boom and bust" cycles every 4-8 years - whereby during booms the price has typically 10x'ed from the lows. History may not repeat, though.
From a pure technical analysis perspective, the company has already entered and slightly exited by "crash" simple moving average zone (green lines). While the lows may not be in yet, this zone (currently between $1.20 and $3.30) typically represents a longer-term bounce area or price consolidation.
Fundamentally, the company is currently unprofitable but expected to become profitable in 2026 and beyond. Debt-to-equity = 0.72x (low/moderate). Price-to-book = 0.31x. During the most recent earnings call, Chief Legal and Administration Officer at Green Plains noted the company’s past performance has not met expectations, but stressed “that is changing.” This includes exiting non-core operations and launching the sale of non-strategic assets in a commitment to achieve $50 million in cost reductions. The company is on track to meet that goal and has already achieved $30 million in annualized cost savings.
It's a speculative play that could go to $0. But at $4.18, NASDAQ:GPRE is in a personal buy zone based on technical analysis as well as future fundamental predictions (which could be BS...).
Targets:
$6.00
$8.00

Where Can Bitcoin Go? Part 9 – Breakout and History in Motion🌋🚀 Where Can Bitcoin Go? Part 9 – Breakout and History in Motion. 🔓💥
The breakout over 114900 has happened.
After 2 rejections, years of preparation, and countless fakeouts… Bitcoin has finally cleared the $114,921 barrier.
We are now officially in price discovery mode within the upper resistance channel.
📍 As long as BTC stays above $114,900 – we are long.
This level is now our trigger line. Lose it? Flip back to short bias. Hold it? There’s only one word: 🚀
🔑 Context:
We’ve tracked this structure since 2023 using a 1-2-3 model based on macro highs. The third test is always the decider — and this time, we broke through.
✅ Test 1: Rejected (2021)
✅ Test 2: Rejected (2025)
✅ Test 3: Breakout confirmed (July 2025)
Now compare that to previous cycles:
2016 halving → ATH in 2017
2020 halving → ATH in 2021
2024 halving → ATH coming by end of 2025?
🧭 Based on this map, BTC’s next structural targets are:
→ $137K
→ $160K
→ $182K+
But there’s a catch: if we fall back below 114,900, the entire breakout thesis is at risk. This is now a binary zone.
⚠️ What to Watch:
📌 Support Retests:
Expect volatility around the 114.9–116K level. This zone will now be stress-tested.
📌 Media Frenzy vs Structure:
As hype increases, stick to levels — not noise.
📌 Ultimate FOMO vs Breakdown:
Hold structure = ATH potential
Lose structure = Down we go, potentially hard.
🎥 Missed the full structural breakdown?
👉 Watch “Where Can Bitcoin Go? Part 8” for the blueprint
👉 This is now Part 9 – The terminal move has begun
We are now playing for cycle maturity – this could be the final leg before topping out in late 2025.
Let’s trade it with clarity, not emotions.
One Love,
The FXPROFESSOR 💙
Disclosure: I am happy to be part of the Trade Nation's Influencer program and receive a monthly fee for using their TradingView charts in my analysis. Awesome broker, where the trader really comes first! 🌟🤝📈
🚨 BITCOIN HAS BROKEN OUT but keep in mind: under 114900 be OUT!

MicroStrategy ($MSTR) – Bitcoin Proxy Setting Up AgainMicroStrategy Incorporated NASDAQ:MSTR remains the definitive institutional proxy for Bitcoin exposure, uniquely combining its enterprise software operations with a high-conviction, leveraged Bitcoin accumulation strategy. Its $1.42B BTC purchase in April 2025 further cements this thesis, making MSTR a prime vehicle for traders seeking amplified BTC exposure via equities.
Since our May 5th analysis, MSTR has rallied ~14.61%. We’re now eyeing a re-entry opportunity on a pullback to the $394–$387 zone, aligning with technical support and previous consolidation.
🎯 Bullish targets remain unchanged: $490.00–$500.00, backed by Bitcoin strength and MicroStrategy’s unwavering strategy.
🔁 Re-entry: $394–$387
🟩 Targets: $490–$500
#MSTR #Bitcoin #CryptoStocks #BTC #StockMarket #TechnicalAnalysis #MicroStrategy #HighBeta #CryptoExposure #TradingSetup

Momentum’s Here. Don’t Miss Out.Opportunity favors the prepared. The market’s shifting, and this setup is your signal to rise. If you're aiming for growth, consistency, and a clear path forward — you're in the right place.
No more solo trades with shaky confidence. It’s time to align with a professional approach that focuses on results, not guesswork. I help traders navigate, structure, and succeed — and I’m here for those ready to take the next step.
🚀 Growth isn’t accidental. Let’s build it together.
#buysetup #forexmentor #tradingmindset #tradingconfidence #tradingeducation #consistentprofits

Navitas Semiconductor Corporation ( NVTS )Unfortunately, W1 completed at 7.52$, then we started W2 formed as a Running Flat correction with strong (b)= 162% of starting wave (a) and it come as zigzag correction, we are Today at the End of wave (c) that comes as an contracting ending diagonal which is supposed to end at 60%(5.98$ - 6.00$) of wave (a), / or wave (c) = 100% (6.60$) - 123.6% (5.98$) length (a).
### There were cases wave (c) Ended at least 60%(5.89$) of wave (a).
Running Flat correction is the ending of W2, after that, we going to start W3 the Motive Powerful Expending Wave ever that its Target price = 26.40$ - 27.30$ at that level we also end Nen-Star Harmonic pattern to start correction of W4 to about 16$-20$ depending on How aggressive Sellers will deal with W4, at the End we will Expect to End W5 between 37$ - open Zone to 40$.
# Explosive 💣 level to make sure we completed W2 and starting W3 to Pass level 6.70$.
# Highly recommended for starting Buying Now.
