AUD/USD: Short Setup to 0.6450This trade idea is rooted in a data-driven approach, leveraging a rare asymmetry in the economic calendar and specific quantitative models to identify a high-clarity opportunity.
📊 The Thesis by the Numbers
My model assigns clear probabilities to the potential scenarios for this week, based on the scheduled U.S. data releases.
60% Probability: Base Case (USD Strength). Triggered by a U.S. Core CPI reading at or above 0.3% MoM.
30% Probability: Alternative Case (USD Weakness).
10% Probability: Wildcard Scenario (Risk-On Rally).
🧠 The Data-Driven Rationale
This setup scored a -5 on my quantitative thesis model, indicating a strong bearish conviction. The core of this is the one-sided event risk. With Australia's calendar completely empty, the AUD is a sitting duck. Meanwhile, a volley of tier-one U.S. data (CPI, PPI, Retail Sales) is expected to confirm a robust economy. This fundamental divergence, combined with a technical picture of price coiling below long-term resistance, creates the conditions for a catalyst-driven drop.
⛓️ Intermarket & Statistical Edge
Further analysis of market correlations and forward-looking models reinforces the bearish bias.
🌐 Correlations: The positive correlation of AUD/USD with equities (SPY: +0.31) suggests that a strong USD report, which could pressure stocks, would create a direct headwind for the Aussie.
🎲 Monte Carlo Simulation: While the mean outcome is neutral, the model's 5th percentile for price is down at 0.6503 , highlighting the statistical risk of a significant downside move if the catalyst fires.
✅ The Trade Setup
📉 Bias: Bearish / Short
👉 Entry: Watch for a bearish reversal pattern on the 1H or 4H chart within the $0.6550 resistance zone.
⛔️ Stop Loss: A decisive daily close above the 0.6622 resistance level.
🎯 Target: 0.6458 (June low-day close).
Good luck, and trade safe.
Fundamental Analysis

Altcoins Rise Again – Off to 1.07T and 1.51T?🌊🚀 Total Market Cap (excluding BTC & ETH) is showing strength again, pushing off support and heading back into the heart of the channel.
💥 The bullish structure has been respected beautifully:
✅ Double bottom near channel base
✅ Clean bounce and new higher low
✅ Momentum building on macro trend
📈 As long as this channel holds, we're eyeing the next targets:
🔹 Mid-channel target: $1.07 Trillion
🔹 Channel top extension: $1.51 Trillion
From the "Escape" back in late 2023 to the clean retest — it’s now about confirmation and continuation.
This could be the altseason move everyone forgot about...
🛑 Long bias stays intact as long as the bottom channel support is respected.
Time to respect structure over noise.
One Love,
The FXPROFESSOR 💙
Disclosure: I am happy to be part of the Trade Nation's Influencer program and receive a monthly fee for using their TradingView charts in my analysis. Awesome broker, where the trader really comes first! 🌟🤝📈

GO LONG ETH BEFORE "CRYPTO WEEK"Next week is "Crypto Week" in the U.S. House of Representatives. The House will consider the CLARITY Act, the Anti-CBDC Surveillance State Act, and the GENIUS Act.
Bill Helps Ethereum By...
CLARITY Act Protecting decentralized infrastructure from U.S. blacklists
Anti-CBDC Act Preserving demand for decentralized stablecoins, defending privacy
GENIUS Act Encouraging gov use of public blockchains like Ethereum
EUR/USD WEEKLY SWING (1H) Pull Back BEARISHThe weekly pull back level (orange line) is found on the (1H - 2H) trading view chart.
With the MT4 Chart reading small scalping action to the down side the intraday traders should switch to a bullish stance for the pullback and find reversal at the first major S&R Liquidation zone that broke the Support of the previous break of structure to the down side on the (4H - 1D) Chart
To maintain only taking a weekly swing risk place sells around the 1.17716 level

Bitcoin Breaks Out – Ultimate FOMO Unleashed Above $114,921🟢🚀 BREAKOUT POST
🚀🔥 Bitcoin Breaks Out – Ultimate FOMO Unleashed Above $114,921 🚀🔥
It’s happening. The breakout is real.
Bitcoin has just broken through the “HUGE-est Level EVER” — the infamous $114,921, marking the third macro test and final resistance in this structure.
This is not a small move. This is the unleashing of a new wave — the Ultimate FOMO zone is now LIVE.
📈 What Just Happened:
Third test confirmed ✅
Breakout through massive historical resistance
We are now in uncharted territory
🌪️ This Breakout Is Different:
Previous rejections (1 and 2) led to multi-week corrections
This time, price exploded through the level with force
Watch the parabola — we could be headed to the next ATH zone by end of 2025
🧠 Context:
The 2D divergences? Ignored. Structure wins.
This breakout invalidates the idea of sideways chop for now
It confirms strong bullish momentum across timeframes
⚠️ Caution Still Needed:
This move might trigger euphoric leverage — don’t be late, don’t chase blindly. Watch for a retest of the breakout zone for high-RR trades.
🧭 What To Watch Next:
Retest of 114.9K (support flip?)
New targets near 124K–128K
Long-term ATH projection still in play for late 2025
Full context in these breakdowns:
👉 Where Can Bitcoin Go? Part 8
👉 July 10th Market Outlook – Uncharted Waters
History is being written today.
One Love,
The FXPROFESSOR 💙
Disclosure: I am happy to be part of the Trade Nation's Influencer program and receive a monthly fee for using their TradingView charts in my analysis. Awesome broker, where the trader really comes first! 🌟🤝📈

GBP/USD: Path to 1.3200 on Policy DivergenceThis trade idea outlines a high-conviction bearish thesis for GBP/USD. The core of this analysis is a significant and growing divergence between the fundamental outlooks of the UK and US economies, which is now being confirmed by a bearish technical structure. We anticipate the upcoming UK economic data releases during the week of July 14-18 to act as a catalyst for the next leg down.
The Fundamental Why 📰
The primary driver for this trade is the widening policy and economic divergence. The UK is facing a triad of headwinds while the US economy exhibits greater resilience. This fundamental imbalance favors the US Dollar and is expected to intensify.
Dovish Bank of England: The BoE is clearly signaling a dovish pivot towards monetary easing in response to a weakening labor market and sluggish growth prospects. This contrasts with the Federal Reserve's more patient, data-dependent stance.
Widening Rate Differentials: The divergence in central bank policy is leading to a widening interest rate differential that favors the US Dollar.
Geopolitical Headwinds: Fiscal policy from the new UK government and ongoing trade tensions are creating additional headwinds for the Pound.
The Technical Picture 📊
Price action provides strong confirmation of the bearish fundamental thesis, showing a clear loss of upward momentum and the formation of a new downtrend.
📉 Death Cross: The 50-day moving average has crossed below the 200-day moving average, forming a "death cross," which is a strong bearish indicator.
📉 Key Level Lost: The price has recently broken and is holding below the critical 200-day moving average, a classic bearish signal.
📉 Bearish Momentum: Both the RSI (below 50) and the MACD (below its signal line and zero) indicate that bearish momentum is in control.
The Trade Setup 📉
👉 Entry: 1.3540 - 1.3610
🎯 Take Profit: 1.3200
⛔️ Stop Loss: 1.3665

Natural Gas - The Epic Reversal? Natural gas had an astonishing move to the upside. Closing up over 5% today.
This volatility can make all tarders head spin if youre not used to it.
Why did Nat gas pop today?
Partly from being oversold and into really good technical support, Natural gas inventories were released today at 10:30am.
The inventories showed a smaller build than the market expected which implies stronger demand. 56B consensus vs 53B actual.
This could potentially be the start to a new bullish trend.
Names like EQT & AR hit some major support today. Some call options on these names have been accumulated.

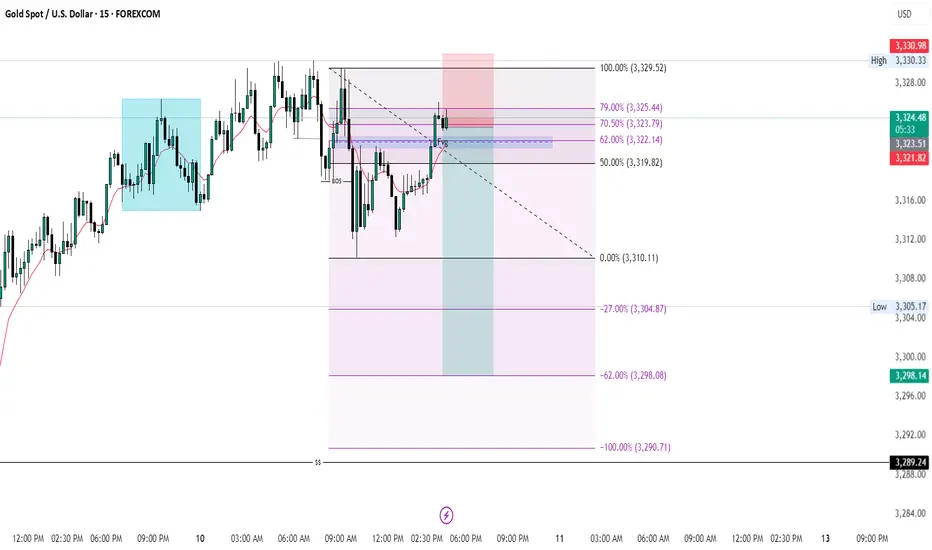
XAU/USD 1H Outlook
FVG Fill (3320–3318)
Price is expected to drop into the unfilled Fair Value Gap between 3320 and 3318.
London/NY Liquidity Hunt
After filling the FVG, look for a swift bullish impulse during the London and New York sessions to trigger stop-runs and collect liquidity.
Downward Correction to 3305 & 3298
Once the liquidity grab completes, expect a retracement:
First target: 3305
On a break below 3305, next target is the unfilled FVG at 3298
Summary:
Drop → FVG fill (3320–3318) → Bullish liquidity hunt (London/NY) → Retracement toward 3305 (then 3298)

$ETH: The 1-week chart is an absolute disaster!Once again, I want to make it clear: I’m naturally a bull. But I live in Thailand, far from the noise of influencers shouting "buy, buy, buy!" I’ve learned my lesson—when they scream buy, you get rekt. That’s why I rely solely on the charts.
Charts are just mathematics—they don’t lie. So here’s my honest interpretation of what I’m seeing for Ethereum:
🕐 Daily Outlook
Yes, we might see a few nice bounces in the short term. But if your plan is to hold ETH, you should be paying attention to higher timeframes, especially the weekly.
📉 Weekly Chart — It's Ugly
We’re clearly in a descending wedge, and overall, ETH is bearish. Don’t be fooled by the hype or the people trying to take your money.
- RSI is bearish, with a strong bearish divergence still unfolding.
- MACD is on the verge of a bearish crossover, and what’s worse, it’s doing that without even touching the neutral zone—a major red flag.
The last time we saw this setup? November 2021. The price crashed below $1,000.
🔍 Where’s the Support?
This cycle, the support zone looks closer to $1,500, mainly due to institutional interest and the ETF narrative. A full retracement seems unlikely, but technically speaking—it’s still a possibility.
🤔 Why Is This Happening Despite Institutional FOMO?
Here’s the key: ETH has staking, and every month, new CRYPTOCAP:ETH is minted to pay stakers. This creates constant inflation. On top of that, many stakers compound their rewards, accelerating the inflation. And guess what? These same stakers are selling as soon as ETH pumps.
So fundamentally, Ethereum is under pressure because of its own staking mechanics—a system flaw that creates long-term selling pressure.
Do your own research (DYOR). I could be wrong—but at least I’m not trying to sell you a course.

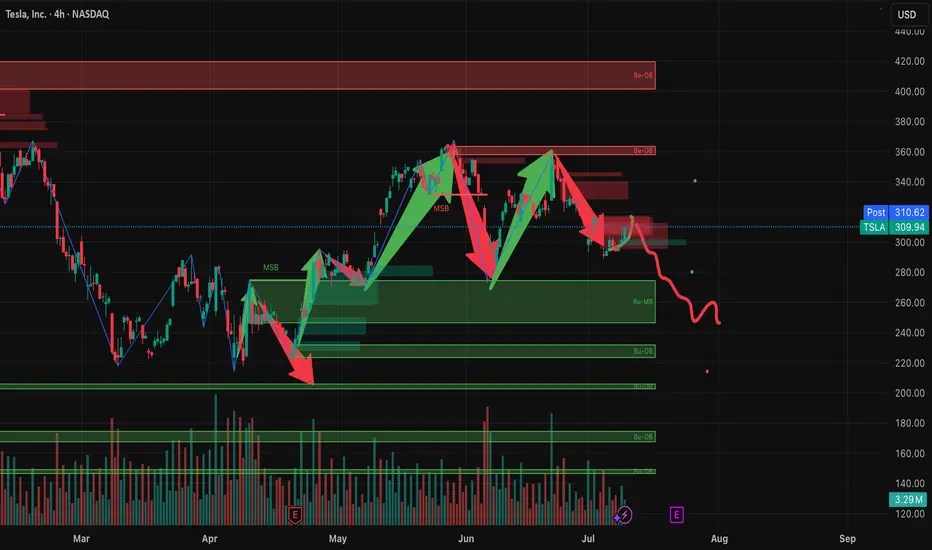
Why TSLA will Crash based On Copper TarrifsHere’s why that bearish outlook is gaining traction:
Copper costs are surging: Tesla uses over 180 pounds of copper per vehicle. With prices spiking 13% in a single day and a 50% tariff looming, production costs are rising fast.
Analysts are cutting price targets: UBS, JPMorgan, and Bank of America have all lowered their forecasts for Tesla, citing margin pressure and weakening demand3.
Brand sentiment is shaky: Tesla’s recent delivery miss and political controversies around Elon Musk have added to investor unease.
Tariff ripple effects: The broader trade war is expected to disrupt supply chains and inflate costs across the EV sector5.
That said, some analysts still see long-term upside if Tesla can pivot quickly—especially with its AI and autonomous driving ambitions. But for now, the market is reacting to the immediate risks.
Overall Enter Short for Gains of 3-5 percent.
MKR/USDT 4H Chart🔍 1. Technical Pattern:
The chart shows a descending wedge (orange lines) that has broken out upward.
The breakout occurred on increasing volume (a signal of bullish strength).
The price is currently trading above a resistance line, which is now acting as support (~1980 USDT).
📊 2. Support and Resistance Levels:
Support (red lines):
1903 USDT – local consolidation support.
1801 USDT – strong support at the previous bottom.
1727 and 1632 USDT – fallback zones in case of strong declines.
Resistance (green and blue lines):
2120 USDT – first target after the breakout.
2168 USDT – another strong resistance from the previous consolidation.
2312 USDT – high resistance, potential target if the uptrend continues.
📈 3. Indicators:
🔹 Stochastic RSI:
Close to the overbought zone, but not yet giving a sell signal.
A short consolidation or correction may occur in the coming hours.
🔹 MACD:
The MACD line is above the signal and the histogram is still rising – a buy signal.
No signs of weakening momentum.
🔹 RSI:
The RSI is rising, but not yet in the overbought zone (>70).
Shows the strength of the trend, but there is room for further upward movement.
🧠 Summary and scenarios:
✅ Bullish scenario:
If the price remains above 1980 USDT, the next targets are:
2120 USDT
2168 USDT
Potentially 2312 USDT with continued demand
⚠️ Bearish scenario (less likely at this time):
If the price returns below 1980 USDT and does not regain this level:
Possible return to 1903 or lower (1801 USDT).

XAUUSD SELLWe had a market structure shift (MSS) followed by a break of structure (BOS), then a second BOS that triggered a retracement into the Fibonacci Optimal Trade Entry (OTE) level, forming a swing high — an ideal setup to go short.
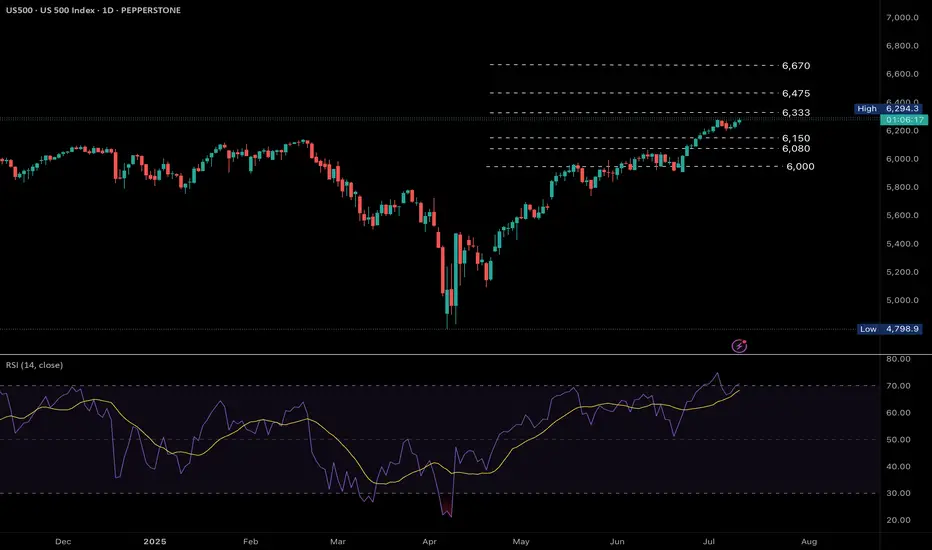
US500 trending higher as the US earnings season gains momentum. Fundamental
US500 is pushing higher as the US 2nd quarter earnings season gains momentum under President Trump's second administration amidst tariffs. Big tech earnings will have a significant impact on the index price action.
Technical
Bullish momentum is gaining as the uptrend remains strong. The RSI is approaching the overbought region however a break above the 6,333 key resistance level sees the index trading at all time highs with resistance levels at 6,475 and 6,670. A move below 6,230 sees a possible move towards supports at 6,150, 6,080 and subsequently 6,000.
by Terence Hove, Senior Financial Markets Strategist at Exness
07/07/25 Weekly OutlookLast weeks high: $110,529.95
Last weeks low: $105,108.81
Midpoint: $107,819.38
The "Big Beautiful Bill" was signed into law last week on the 4th July, a huge event in the financial world and undoubtedly the world of crypto. The debt ceiling is now instantly raised by $5T making risk-on assets even more appealing than ever, incoming demand shock will likely help BTC but also the struggling altcoin market as well.
Last week the BTC ETFs saw a net inflow of $294m. This takes the total 30-day inflows to nearly 50K BTC and this is before the big beautiful bill was passed. PA wise, BTC is still struggling to break the $110k level and flip ATH, however the consolidation just under ATH with increasingly shallow pullbacks suggests a run at the highs is in the near future IMO.
For this week US CPI & PPI data are the important release for the week. It's hard to tell if the data releases will actually provide any volatility this time around, they usually do but the FEDs refusal to act has made the last few CPIs very flat in terms of volatility for BTC.
Key battleground for me this week would be the midpoint, clearly last week provided good support, however a larger area of inefficiency rest just under that it so there is a natural pull for price to revisit those areas. Could be a choppy week once again...
Good luck this week everybody!

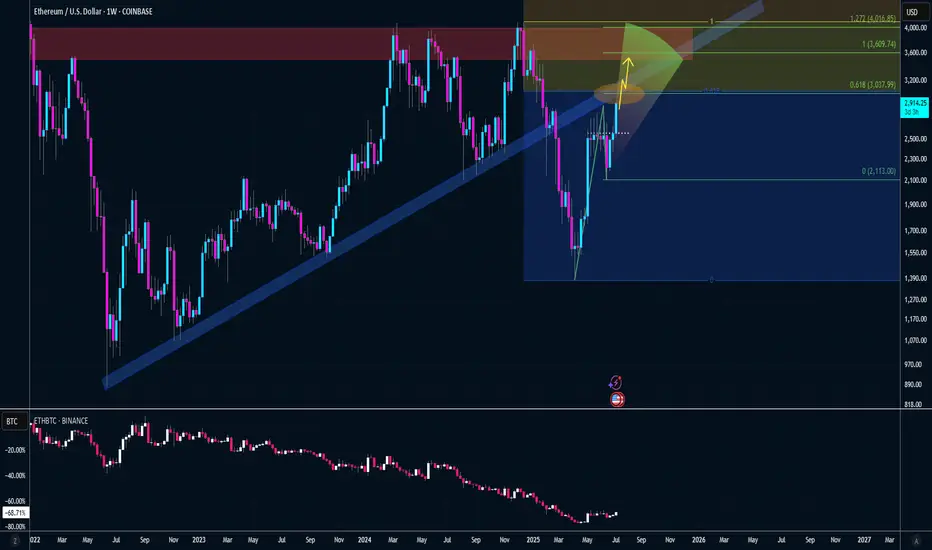
Symplegades Part II – Ethereum at the Threshold of Breakout or B⚔️🌉 Symplegades Part II – Ethereum at the Threshold of Breakout or Breakdown 💥🧭
In the previous post, we explored Ethereum’s mythical challenge — the Symplegades, or Clashing Rocks. That post resonated, and now… here comes Part II.
ETH is once again caught in a narrowing passage, this time defined by:
📌 $2,805 – $2,911 resistance overhead
📌 $2,616 – $2,565 support just below
💡 Pectra could be the fuel to break out — or just another wave that crashes on the rocks. The chart shows the potential for both:
➡️ A clean breakout could spark a move to “Destination 1” (~$4.8K)
⚠️ A rejection here might drag us back under $2.6K, even toward $2.1K and $1.8K zones
The Pectra breakout box is clear. But the market won’t hand it to us easily. It rarely does.
🧠 With Vitalik still “asleep,” it’s a tight spot. But if this move gathers momentum? We could be at the very start of Ethereum’s next wave.
📽️ The full video posted earlier today dives into this thesis and why macro + micro signals are conflicting but critical.
📊 Stay tuned — Bitcoin post is up next.
One Love,
The FXPROFESSOR 💙
Disclosure: I am happy to be part of the Trade Nation's Influencer program and receive a monthly fee for using their TradingView charts in my analysis. Awesome broker, where the trader really comes first! 🌟🤝📈

Bitcoin Breaks Out – The Final Test Has Begun 🚀🔥 Bitcoin Breaks Out – The Final Test Has Begun 💥📈
Boom! The breakout is here. After days of grinding under resistance, BTC has finally burst out of the channel — and all eyes are now on the monster level at $114,900.
📊 We spoke about this level again and again — the third macro test, the “HUGE-est Level EVER,” the battleground between Ultimate FOMO and End of Cycle.
⚠️ This breakout could lead to:
✔️ Acceleration to retest 114,900
✔️ A potential 3rd attempt to break the golden structure
✔️ Euphoria or exhaustion — no middle ground
🧠 Smart traders will remember:
– 8+ divergences still exist on higher timeframes
– The risk of failed breakout traps is high
– But this is what we’ve been waiting for: confirmation + continuation
🎯 If momentum holds, we may be on our way to test the upper macro structure. This is not the time to hesitate — it’s time to manage risk like a pro and track the flow.
💡 Catch up on the setup:
👉 Where Can Bitcoin Go? Part 8
👉 July 10th Market Outlook – Uncharted Waters
🗣️ It’s not about prediction — it’s about preparation.
We were ready. Are you?
One Love,
The FXPROFESSOR 💙
Disclosure: I am happy to be part of the Trade Nation's Influencer program and receive a monthly fee for using their TradingView charts in my analysis. Awesome broker, where the trader really comes first! 🌟🤝📈

Where Can Bitcoin Go? Part 8 –(Major Chart Update')First of all guys – I made the video! 🎥🔥 Watch the full breakdown before diving into the details below.
It explains everything visually, level by level. Don't miss it.
Now let’s get into the core of the analysis...
🚀📊 Where Can Bitcoin Go? Part 8 – The Final Test is Near! 🔥🔍
Welcome to Part 8 of “Where Can Bitcoin Go?” – the update of this long-running series. Since mid-2023, not much has changed in the structure. That’s the power of solid technical analysis – levels don’t lie.
🟨 The Setup
Bitcoin is now approaching a third test of a major structural resistance. If you’ve followed my 1-2-3 strategy, you know this is where decisions are made:
✅ Test 1: Rejection
✅ Test 2: Rejection
⏳ Test 3: Now pending… the TERMINAL and DECISIVE 'Breakout or Rejection', and this will change everything.
But here’s the deeper layer:
We’re not just testing one sequence. We now have two separate sets of 1-2 rejections —
🔹 One set from 2021 (the Red 1 and 2)
🔹 And a recent one in 2025 (the white 1 and 2)
This upcoming test is the third rejection attempt on both timeframes, making it a rare and extremely significant technical moment.
📐 Price is now near a critical ascending trendline around $115K–$116K, which has been the gatekeeper to parabolic moves in previous cycles.
🔄 Based on historical halving cycles:
548 days post-halving in 2016 → ATH 2017
565 days post-halving in 2020 → ATH 2021
Halving #4 was in April 2024 → 👀 Could this point to a new ATH by end of 2025?
📊 Probabilities
🔹 83% chance we see the third test before year-end
🔹 57% chance of breakout
🔻 43% chance of rejection
⚠️ And here’s the reality check:
If we see that breakout — the market unleashes itself. We’re talking major pumps, potential follow-through moves, and price discovery into untouched zones like $188K, $197K, and beyond.
But... if we get rejected, it won’t be pretty. We could retest major levels like $66K or worse, and lose momentum that took years to build.
And unfortunately — this isn’t like 18K, or 40K, or even the 79K retest.
Things are much more complicated now.
The sentiment, the structure, the risk profile — they’ve all evolved. We cannot afford to have the same blind bullishness we had in those earlier phases. This is a mature part of the cycle, and it demands discipline over emotion.
💬 What’s your take?
Will Bitcoin finally break through?
Is this just another fakeout in disguise?
Are you feeling this same tension in the market?
Let’s talk structure. Let’s talk price. Let’s talk reality.
One Love,
The FXPROFESSOR 💙
Disclosure: I am happy to be part of the Trade Nation's Influencer program and receive a monthly fee for using their TradingView charts in my analysis. Awesome broker, where the trader really comes first! 🌟🤝📈

July 10th Market Outlook –Charted Waters & Uncertain Momentum🗓️📊 July 10th Market Outlook – Charted Waters & Uncertain Momentum 🌊⚠️
Today’s breakdown is a reality check for traders navigating a market full of setups but short on clarity. Resistance is stacking across the board, but that doesn’t mean we can’t break through — it just means we need to stay sharp and keep our charts close.
🔎 Highlights from the 19-minute video:
Bitcoin is approaching a third and crucial resistance test. A breakout could trigger ultra-FOMO, but failure here could send us lower.
Ethereum is in a pressure zone — the "Symplegades" setup from Greek mythology reflects today’s narrow trading path.
Bitcoin Dominance is clinging to support — if it breaks, altseason could be on. If it holds, alts may stay sidelined.
NASDAQ & Nvidia have delivered massive runs, but signs of exhaustion and reversal risk are showing.
Dollar Index (DXY) showing a Golden Cross, but unresolved rate expectations could catch markets off guard.
💬 I also speak candidly about market manipulation, being someone else’s exit liquidity, and why we might be heading toward a formative trap before any true breakout.
🎥 Watch the full video to catch all the details — from long-term setups to real-time chart reactions.
📌 Stay tuned for detailed updates today on Bitcoin, Ethereum, Bitcoin Dominance, NASDAQ and more.
One Love,
The FXPROFESSOR 💙
Disclosure: I am happy to be part of the Trade Nation's Influencer program and receive a monthly fee for using their TradingView charts in my analysis. Awesome broker, where the trader really comes first! 🌟🤝📈

Bitcoin Dominance Rebounds – Bad News for Altcoins??📊⚠️ Bitcoin Dominance Rebounds – Bad News for Altcoins? 🧨💣
Today’s chart says it clearly: Bitcoin Dominance is bouncing off support at the edge of its ascending channel. This rebound zone around 64.58–64.64% has been critical — and the move up confirms it’s holding… for now.
❗ With Bitcoin itself facing heavy resistance, this dominance bounce is not good news for altcoins. In fact, it's a classic setup for capital rotating into BTC and out of alts — not the other way around.
📌 Chart Breakdown:
Biggest alt bull runs have started when BTC.D failed here — not when it rebounded
Breakout above 71.3% = serious risk of altcoin extinction
Breakdown below 62.3% = green light for altseason
🧠 As I’ve written on the chart: the END of alts comes not just from price — but from meme culture, utility decay, and market maker manipulation. That zone? 97% BTC.D. We’re not there, but we’re not heading toward freedom yet either.
🎥 Want to see how this fits into the full market picture? Watch the July 10th macro update:
👉 July 10th Market Outlook – Uncharted Waters, Uncertain Momentum
The market’s pressure is rising.
No good news from BTC.D today.
One Love,
The FXPROFESSOR 💙
Disclosure: I am happy to be part of the Trade Nation's Influencer program and receive a monthly fee for using their TradingView charts in my analysis. Awesome broker, where the trader really comes first! 🌟🤝📈

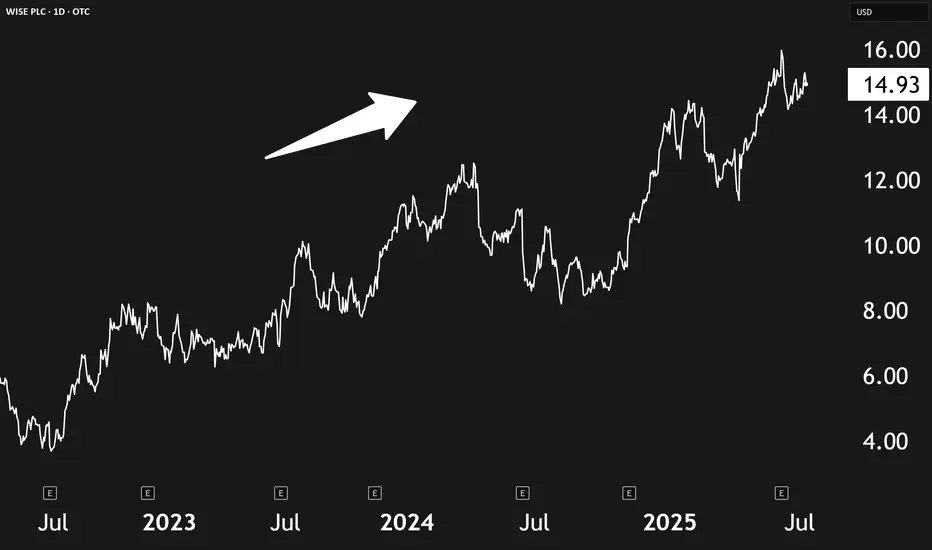
Wise Is Poised To Capture A Multi-Trillion Dollar OpportunityA few months back, we highlighted key investment trends for the next decade—among them, cross-border finance and fintech disruption. Now, Wise plc OTC:WIZEY , a British fintech leader, is showing strong alignment with both themes, and it may soon benefit from even more investor attention as it plans to move its listing from the UK to the U.S.
🌍 What Wise Does
Wise offers low-cost, tech-driven cross-border payment services. Rather than sending money physically across borders, it uses a network of local money transfer entities to settle transactions locally. This allows the company to avoid high bank fees and offer fast, affordable currency exchanges. Currently, 65% of its international payments are settled instantly, and 95% are completed within 24 hours.
Its infrastructure, built over the past decade, gives Wise a strong moat—few competitors can replicate its speed and pricing. The company also offers personal and business multi-currency accounts, a debit card, and an investing feature called "Wise Assets." Additionally, Wise licenses its payment rails to institutions like Morgan Stanley and Monzo, creating another layer of growth potential.
📈 Financials & Growth
Wise has seen explosive growth:
- Revenue has more than tripled since 2021.
- Profits are up 7.2x during the same period.
- Active users, transfers, and customer balances are all climbing steadily.
Management expects mid-teens growth in both revenue and profits, though we see this as conservative given Wise’s network effects.
💰 Valuation & U.S. Relisting Potential
Currently valued at ~$17.8 billion with a P/E of ~24.7x, Wise trades more cheaply than many U.S. fintech peers. If EBIT projections hold—$900M in 2026 and $1.1B in 2027—the multiple could compress to ~17x, making it even more attractive.
Relisting in the U.S. could spark multiple expansion as it gains visibility and liquidity among U.S. investors. Wise trades at about 5x sales today; even a modest bump closer to 10x could signal major upside.
⚠️ Risks to Watch
Low U.S. liquidity: Shares currently trade over-the-counter under WIZEY, which comes with low volume and potential slippage.
Emerging competitors: Rivals like Remitly (RELY) are growing.
Security risks: Any breaches, like the one it faced years ago, could damage trust.
✅ Final Take
Wise stands out as a rare combination of profitability, growth, and competitive edge in a massive, underpenetrated market. With a planned U.S. relisting and strong financials, it’s well-positioned for continued upside.
Rating: Strong Buy
Gold royaltyI am following long diagonal trend line in the chart of GROY. There is some divergence in RSI, and support in the distance from MA. A company with good value and probable triple bottom.
With two new producing royalties from this year growth looks inevitable.
Do your own research!

ServiceNow Is Our Top Tech Compounder PickIn a tech world often driven by hype and speculation, ServiceNow NYSE:NOW stands out as a reliable growth engine—a true compounder. Unlike flashier tech names, ServiceNow delivers steady revenue growth and expanding margins, all while offering mission-critical software to businesses.
📈 What’s a Compounder, Anyway?
Compounders are companies that grow steadily over time by reinvesting profits at high returns. They may not make headlines, but they consistently outperform by:
- Growing demand for their shares
- Reducing share supply (or keeping dilution low)
These are the businesses long-term investors love: predictable, resilient, and scalable.
🧩 Why ServiceNow Fits the Bill
ServiceNow has quietly built a powerful B2B software business, helping organizations streamline operations. Here’s why it qualifies as a compounder:
Strong Revenue Growth: From $3.3B in 2020 to $11.4B today
Rapid Profit Growth: Net income jumped from $34M to $1.54B in the same period
Operating Leverage: Margins have grown from 3.4% to 13.2%, thanks to stable 80%+ gross margins and low incremental costs
Recurring subscription revenue is rising fast—up 20% YoY—driven by the mission-critical nature of its software and increasing AI capabilities.
💸 The Valuation Case
Although many quant models give NOW a weak grade for valuation, context matters. Historically, the stock is trading in the middle of its typical range—about 18x sales and 58x free cash flow.
Looking ahead:
Analysts forecast 20% annual EPS growth through 2027
That implies a forward P/E of 42x, with potential to drop further as margins expand
Combine that with AI-powered upselling and potential share buybacks, and NOW’s valuation starts to look compelling.
⚠️ Risks to Watch
Premium Price Tag: If markets decline, richly valued stocks like NOW could fall harder
Tough Competition: Rivals like Salesforce and Palantir are aggressively chasing similar markets
✅ Bottom Line
ServiceNow may not be flashy, but its financial performance, recurring revenue model, and growth runway make it a solid long-term bet. If management reins in share dilution and continues margin expansion, this stock could deliver serious compounding over the next decade.
Rating: Buy

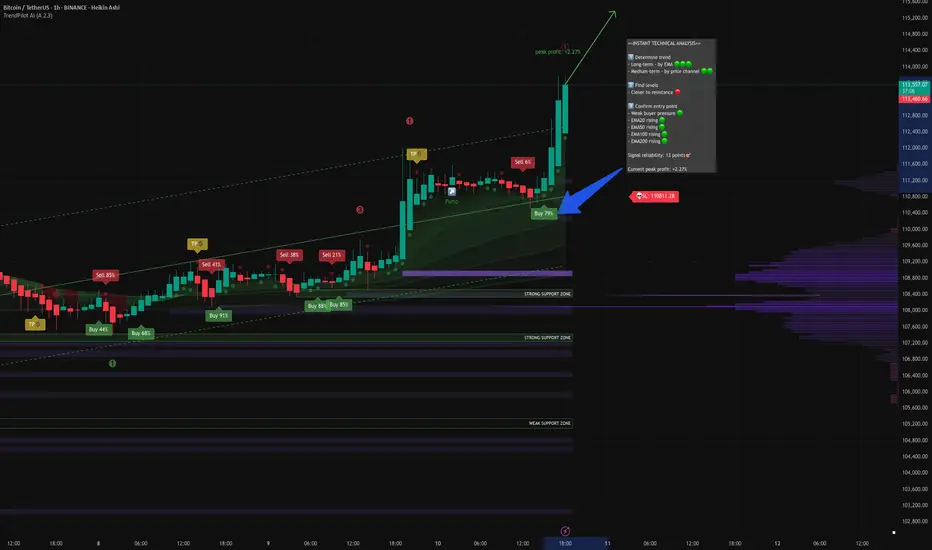
BTC-USDT Analysis for the Past 24 HoursOver the past 24 hours, BTC showed excellent price action — I personally entered a long position at 110,000 and captured a clean +2.59% move, locking in profits without being greedy.
🚀 Price Action
Bitcoin climbed confidently from around 109,485 to 113,472 USDT — a gain of roughly 3.6%. The strongest impulse came between 00:00 and 01:00, with the candle surging from 111,341 to 113,685. It was a sharp and confident move with no signs of weakness.
📊 Market Observations
• Trading volume significantly increased during the night, especially from 03:00 to 01:00 — typical behavior during an aggressive short squeeze.
• Daily high: 113,757 USDT; low: 109,443.
• Technically, the market is continuing its uptrend after holding the key support level at 105,200 USDT last week.
📰 Fundamental Signals
• Kimchi premium is negative (-0.69%) — Korean investors seem to be in risk-off mode.
• Upbit listed BABY BTC, and activity in altcoins is picking up.
• Institutions are still cautious — even after BTC broke above 109,700, there’s no strong bullish sentiment from their side.
📌 My Take
The rally is strong, but not euphoric. There’s clear interest in BTC, and volume confirms the trend’s strength. However, the ETF flows and ongoing USDT discount in China signal the need for caution. Now is the time to avoid greed, take partial profits, and closely monitor how the market reacts to upcoming resistance levels.