#BTC.D (BTC-DOMINANCE) - Cheat sheet#BTC-DOMINANCE
The asset has many strong features to achieve its goal.
This text does not contain recommendations on financial transactions or investments.
Fundamental Analysis

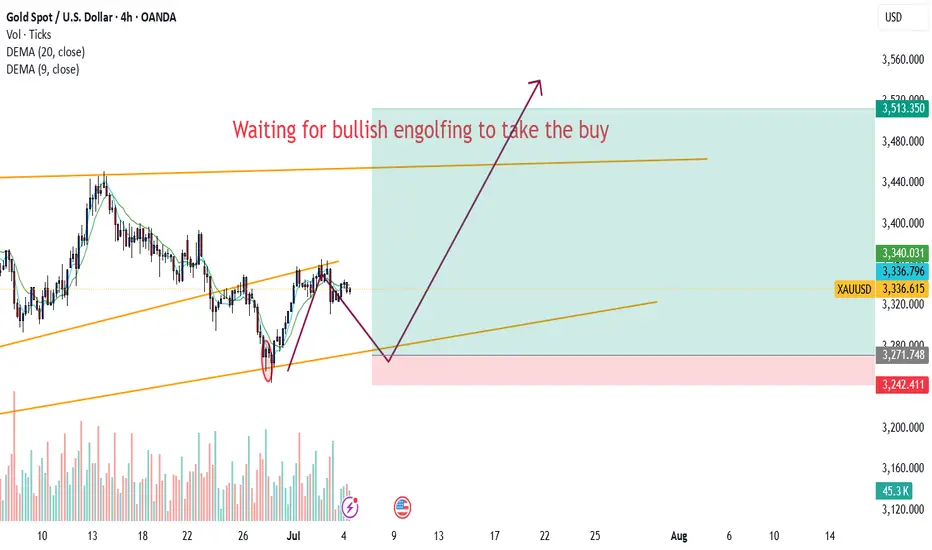
Gold Price Outlook: Dip to $3000 Before a Bullish Rally Toward $Based on my current technical analysis, I expect a bearish move in gold toward the $3000 level in the short term. This zone could act as a strong support and the potential bottom before a major bullish reversal.
The reversal window is likely to open between July 28 and mid-August. During this time frame, I anticipate gold will start forming a solid base and initiate a new upward trend.
The medium-term target for this bullish leg is projected around $3700.
This outlook is based on price structure, key support/resistance zones, and historical price behavior.
📉 Short-term bias: Bearish to $3000
📈 Mid-term bias: Bullish toward $3700
🔔 I’d love to hear your thoughts – drop a comment and let’s discuss.
Disclaimer: This is not financial advice. It’s a personal technical analysis shared for educational purposes only.

NXAU/USD Bearish Setup – Supply Zone Rejection + Trendline Rete📉 XAU/USD Bearish Setup – Smart Rejection Play from Rising Channel + Macro Confluence
Published by: Kelly Wise FX no
| Date: July 6, 2025
---
🔍 Overview
Gold (XAU/USD) is approaching on a critical confluence zone near $3,357 – $3,366, where I expect a potential bearish rejection. This setup is backed by both technical structure and recent macroeconomic fundamentals, aligning for a high-probability short opportunity.
---
📊 Technical Strategy Breakdown
I used a multi-timeframe approach to build this setup:
✅ 1. Trend Channel Analysis:
Price has respected a clean rising channel since June. Currently, it is testing the upper boundary, which aligns with historical rejection zones and prior highs.
✅ 2. Supply Zone Identification (Line Chart):
Using the line chart, I mapped a tight supply zone at $3,350 – $3,366, where previous price reactions occurred. This filters out wick noise and gives clean, actionable zones.
✅ 3. Entry Trigger Plan:
I’m watching for:
Two clear rejection candlesticks in the supply zone (on 1H or 4H chart).
A bearish confirmation candle close below the zone for entry.
🎯 Targets:
First TP: $3,325
Second TP: $3,307
Extended: $3,274
🛑 SL: Above $3,370
---
🧠 Why This Setup Works – Educational Value
This trade idea follows a rule-based strategy I teach in my trading room:
1. Wait for price to enter a supply zone.
2. Look for rejection candlesticks (e.g., pin bar, engulfing).
3. Enter only after confirmation, avoiding early or emotional trades.
4. Align setup with fundamentals for confluence and confidence.
This avoids chasing breakouts and gives structure to entries, ideal for traders who want precision and discipline.
---
🌍 Fundamental Confluence – Why I’m Bearish This Week
June NFP beat estimates (+147K) → Dollar strengthened.
ISM Services > 50 → US economy still resilient → Hawkish Fed bias.
Fed minutes (Jul 10) expected to show delayed rate cuts → Bearish for gold.
COT sentiment: Funds trimming longs, retail majority long → Contrarian sell signal.
Price closed near key resistance on weak momentum → "Toppy" behavior.
---
📌 Summary
🔻 Bias: Bearish below $3,366
🔄 Watch: Reaction to $3,350–$3,366
📅 Key Date: FOMC Minutes on July 10
🧠 Strategy: Rejection + confirmation + fundamentals = high-quality trade
---
📢 If this setup helps your analysis, leave a like and follow me for weekly macro-backed trade setups.
I focus on smart trading, structure, and psychology – not signals without reason.
Let’s grow together. 💼📈
#XAUUSD #GoldAnalysis #KellyWiseFX #PriceAction #Fundamentals #TradingEducation #ForexSignals #SwingTrade #SmartMoney #RiskManagement

EUR/USD – Smart Money Trap at 1.18? Massive Rejection Ahead 1. Technical Context
The pair has been moving inside a well-defined bullish channel since May, forming higher highs and higher lows. Price is currently hovering around 1.1718, approaching the upper boundary of the channel and a key weekly supply zone (1.1750–1.1850).
➡️ Potential scenario:
A short bullish extension toward 1.1780–1.1820 to trigger stop hunts, followed by a bearish rejection toward 1.1500, and potentially 1.1380.
The daily RSI is overbought (>70), suggesting a likely short-term correction.
2. Retail Sentiment
80% of retail traders are short, with an average entry around 1.1318.
This signals a liquidity cluster above current highs, increasing the likelihood of a fake bullish breakout followed by a sell-off.
➡️ Contrarian insight: Retail heavily short → market may push higher first to wipe them out before reversing lower.
3. COT Report – USD Index (DXY)
Non-commercials (speculators) increased their short exposure on USD (+3,134).
Commercials cut their short positions (-1,994), indicating a potential bottoming on the dollar.
➡️ Conclusion: USD strength could return soon → bearish pressure for EUR/USD.
4. COT Report – EUR FX
Non-commercials increased longs on EUR (+2,980) and sharply reduced shorts (-6,602) → market is now heavily net long.
Commercials remain net short (581,664 vs 417,363 longs).
➡️ Over-leveraged spec longs → vulnerable to downside squeeze if macro sentiment shifts.
5. Seasonality
June tends to be mildly bullish for EUR/USD.
July historically shows even stronger upward performance over the last 5–10 years.
➡️ Shorts are high risk in the very short term, but a bearish setup is likely in the second half of July, especially if price action confirms.
6. Trading Outlook
📍 Short-Term Bias: Neutral to bullish toward 1.1780–1.1820
📍 Mid-Term Bias: Bearish on rejection from supply area and break of channel
🎯 Key Levels:
1.1780–1.1850: critical decision zone (liquidity + weekly supply)
1.1500: first key support
1.1380: next downside target (demand zone + previous POC)
📌 Final Conclusion
The most likely play is a short setup from 1.1780–1.1850 on strong rejection, supported by:
Extreme retail positioning (80% short),
COT pointing to USD recovery,
Extended technical structure,
Overbought RSI on the daily chart.

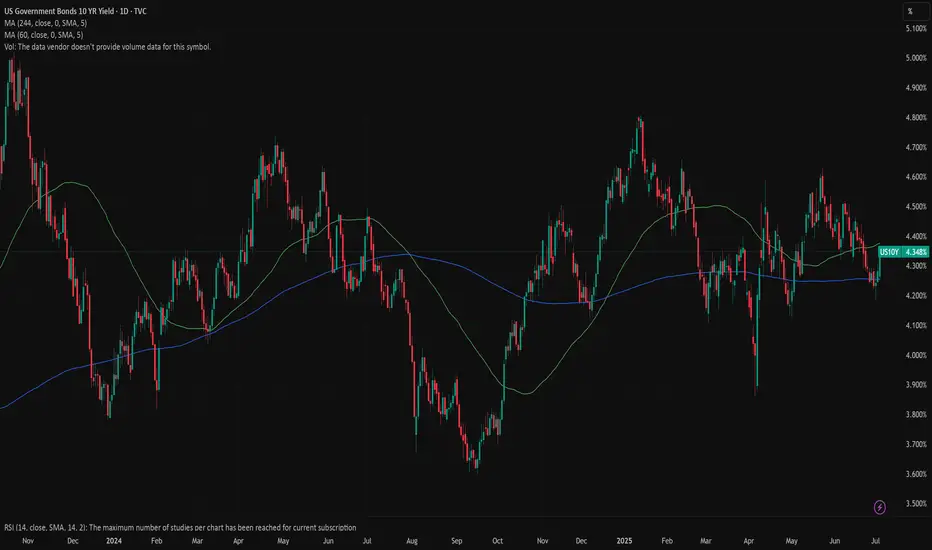
US 10Y TREASURY: September rate cut?Jobs data posted during the previous week shaped investors sentiment. The JOLTs job openings in May reached the level of 7.769M, higher from market forecast of 7,3M. The main impact on the market came from the NFP data for June, with 147K new jobs, above market expectations of 110K. At the same time, unemployment fell to 4,1% in June. Strong jobs data significantly decreased market expectations that the Fed might potentially cut interest rates at July's FOMC meeting. Current odds still hold for September's cut.
A “higher for longer” is again wording used by market participants. The 10Y Treasury yields adjusted to that expectation by increasing yields from 4,2% toward 4,33% as of the end of the week. In a week ahead, there are no currently significant US macro data scheduled for a release. In this sense, it could be expected a short relaxation of the 10Y yields, where levels between 4,3% and 4,8% could be shortly tested.
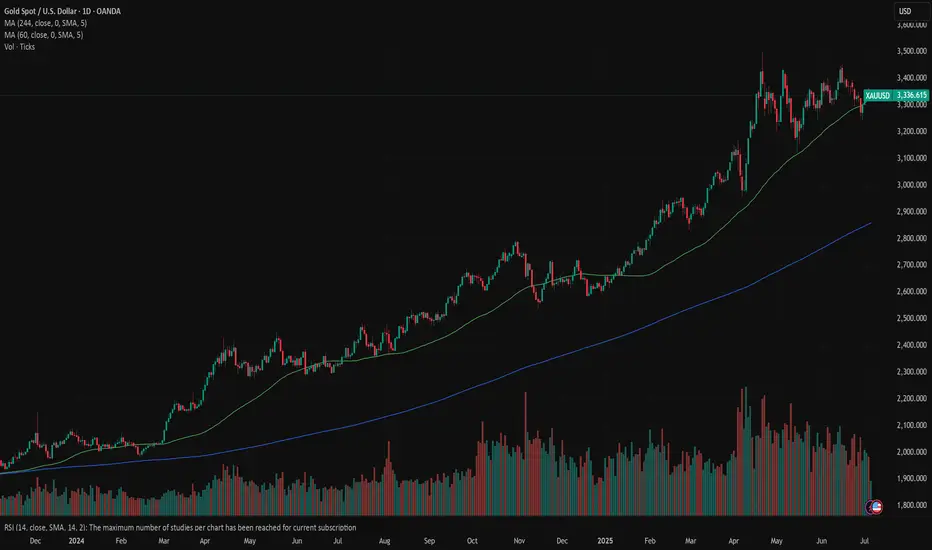
Gold: struggle with upside momentumThe price of gold was traded at modestly higher grounds during the week, which was impacted by the further weakening of the US Dollar and also concerns raised by the approval of the so-called Trump's tax megabill, which passed the US Senate during the previous week. Investors perceive tax cuts negatively, which are estimated to add $3,4 trillion to already concerned US debt over the period of the next 10 years. As analysts are commenting, on a long run increased US debt will further weaken US Dollar, which will be positive for the price of gold.
The price of gold started the week around the level of $3.250 and headed toward the highest weekly spot of $3.360. It is ending the week modestly lower, at $3.336. The RSI is still not showing any clear movement to either side, sliding around the level of 50.The MA50 has shortly continued to act as a supporting line for the price of gold, although it has been breached at one moment during the week. MA200 is moving without a change, with a holding uptrend. The potential cross is still not in store for these two lines.
The week ahead is not bringing currently important macro data for the US economy, in which sense, higher volatility is not expected. Still, any news related to trade tariffs, might shortly move the market to one side. Current charts are showing that the price of gold is struggling to sustain the upside momentum, in which sense, some further retracements might be possible in the weeks to come. As per current charts, the support line at $3.280 might be tested in the coming period. On the upside, no significant movements are to be expected. There are some probabilities for the level of $3.360 in the week ahead, with lower probability that $3.400 resistance could be tested again.
SPX: highly optimisticThe US market celebrated on Friday the US Independence Day, after highly optimistic last two weeks. Almost every day, the S&P 500 was reaching new all time highest levels, finishing Thursday trading session at 6.279. At this moment this is officially treated as a new ATH for the index. The optimism was supported by better than expected US jobs data posted during the previous week. The NFP added 147K new jobs in June, which beated market expectations. The strong US payrolls reinforced market confidence despite concerns over trade tariffs. With inflation remaining sticky and solid jobs growth, markets have increased expectations of the Fed's rate cut in September. Currently, there is relatively low odds that the next rate cut might occur at the Julys FOMC meeting.
Tech companies were again those who led the index to the upside. The leader was for one more time Nvidia, with a weekly surge of 9,7%. AMZN was traded higher by 6,3%, MSFT by 3,9%. TSLA was struggling a bit, ending the week 0,33% higher from the week before.
Weekly news regarding trade tariffs include a US-Vietnam trade deal of 20% tariffs on imports from Vietnam. At the same time, the US exports to Vietnam will be tariffs-free. However, markets are still concerned regarding the final resolution of imposed 90-days delay of implemented tariffs for almost 180 countries around the world, a period which expires in July. On the other hand, Trump's tax mega bill was passed by the US Senate on Tuesday, and is currently awaiting final approval from the House. There were many discussions during the previous period that this tax mega bill might further increase US debt levels, which will be negatively reflected in the economy.

EURUSD: overboughtFriday was a non-working day in the US, as the country was celebrating Independence Day. The most important weekly macro data was related to US jobs data. At the start of the week JOLTs job openings in May were posted with a figure of 7.769M, significantly higher from market estimate of 7,3M. The next day the NFPs and Unemployment rate was published. As per data, the unemployment rate dropped by 0,1pp to the level of 4,1%, which missed market expectations of 4,2%. The Non-farm payrolls in June added 147K new jobs, again better from forecasted 110K. The average hourly earnings were higher by 0,2% in June, or 3,7% on a yearly basis, modestly below the forecasted 3,9%. Other weekly macro data including ISM Manufacturing PMI in June reached 49,0 a bit higher from estimated 48,8. The ISM Services PMI in June was standing at 50,8 in line with market estimates.
Retail Sales in Germany dropped by an additional -1,6% in May, bringing the indicator to the level of +1,6% on a yearly basis. Both figures were lower from the market estimate of +0,5% for May and +3,3% for the year. Inflation rate in Germany preliminary in June was 2% a bit lower from forecasted 2,2%. Inflation for the month was standing at 0%. Preliminary inflation data for the Euro Zone in June was 0,3% for the month and 2% for the year. EuroZone core inflation was standing at 2,3% in June, exactly in line with market estimates. The unemployment rate in the Euro Zone in May was modestly increased by 0,1pp to the level of 6,3%, while the market was expecting to remain flat at 6,2%.
The US Dollar continued its decline against the euro during the previous week. The highest weekly level was at 1,1825, but the currency pair closed the week at 1,1776. The RSI reached the level of 73, signalling a clear overbought market side, increasing the probability of a short term reversal in the coming period. The MA50 continues to diverge from MA200, indicating low probability of a potential cross in the future period.
The eurusd daily chart is showing that the currency pair had formed a sort of channel with an uptrend during the past period. If lows from end of February, mid March and end of March are connected, the indication for a next potential level of eurusd might be somewhere above the 1,16 level. The 1,1620 was the highest level achieved in mid July this year, which aligns well with the previous indication. Indicators are currently showing higher probability of a short term reversal. The week ahead is not bringing any currently significant news with respect to the US economy, in which sense, it could be expected that the market will slow down a bit during the week. Short reversal is quite possible, where the level of 1,1620 might be shortly tested. Just in case that the market decides to continue movement toward the higher grounds, then 1,18 resistance will be tested, before the market continues its road toward the 1,19 level.
Important news to watch during the week ahead are:
EUR: Industrial Production in May in Germany, Retail Sales in the Euro Zone for May, Balance of Trade in Germany in May, Inflation rate final for May in Germany,
USD: FOMC Meeting minutes.

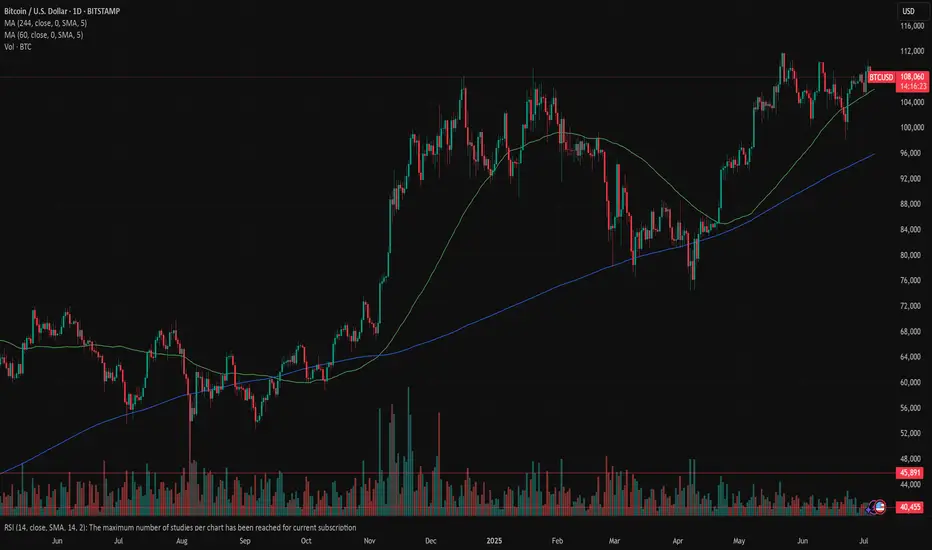
Bitcoin: higher for longer?The investors optimism supported by better than expected US jobs data was reflected mostly in the US equity market, but the crypto market was not left behind on this occasion. Although the week for crypto was quite volatile, it showed that investors are still strongly considering investments in crypto coins for diversification of portfolios, especially BTC. The BTC spent a week struggling around the level of $107K, while making its final breakthrough toward the upside, reaching the highest weekly level at $110K. It is ending the week around the level of $108K, with an equal level of buying and selling order during the weekend.
Although the price was pushed toward the $110K, the RSI did not reach the overbought market side. Actually, the indicator continued to move between levels of 50 and 60, indicating that the market is still not ready to finish the cycle and revert it toward the oversold market side. Although slowed down, the MA50 is still oriented toward the upside, same as MA200, without an indication that the cross might occur anytime soon.
Current charts are indicating the probability that the support line at $106K might be tested again in the coming period. This short reversal is necessary for BTC in order to collect enough interest for a further push toward the upside. Whether the BTC will have strength to try to reach old ATH, remains unclear from current charts, but some indication holds. However, there is some probability that the $110K might be tested for one more time.
MARKETS week ahead: July 6 – 12Last week in the news
The US jobs data posted during the previous week shaped investors sentiment. The jobs market seems resilient, making market participants diminish any expectations that the Fed might cut interest rates at July's FOMC meeting. In this sense, the 10Y Treasury yields adjusted from level of 4,2% to close the week at 4,33%. On the opposite side, strong jobs figures pushed the S&P 500 to reach all time highest levels for the last five days, closing the week at the level of 6.279. Weakening of the US Dollar supported the price of gold to end the week higher, at the level of $3.333. The crypto market had a volatile week, with BTC reaching the level of $110K, still, ending it at levels above the $108K.
This week was marked with US jobs data, exposing its further resilience. The JOLTs job openings ended May at 7.769M, which was higher from market anticipation of 7,3M. The posted unemployment rate for June was standing at 4,1%, slightly lower from 4,2% posted for the previous month. The data which mostly impacted market sentiment were related to the Non-farm Payrolls for June, with 147K new jobs. It was higher from the market estimate of 110K for the same period. A strong jobs market made an impact on investors to rethink the potential Fed's rate cut at July's FOMC meeting. Current expectations for September's rate cut were increased.
Trump's “big, beautiful bill”, proposing significant tax cuts, passed the U.S. Senate during the previous week, and is now back in the House for final approval. Analysts are still concerned regarding its effects on the US level of debt in the next 10 years period, currently estimating further broadening of the US debt by $3,7 trillion.
Although the last two weeks passed with increased optimism on US equity markets, still both analysts and investors are closely watching developments with trade tariffs deals by the US Administration. Last week, the US made a deal with Vietnam of 20% tariffs for imports from Vietnam, while the US goods will be tariff-free. However, the next week will be important from the perspective of the end of a 90-days delayed tariffs period, which the US Administration left for the majority of countries around the world, leaving them the space for negotiations. Talks with major US trade partners are still ongoing, including China, European Union, Japan and India.
News is reporting that the ECB will most likely wait for the September meeting to further cut interest rates on Euro. The reason for such expectations are mentioned uncertainties regarding the trade agreement with the US Administration. Economists are also noting this year`s surge of Euro against US Dollar of 14%, which might add an additional burden on the EU economy in addition to trade tariffs.
CRYPTO MARKET
Another volatile week on the crypto market passed. The positive market sentiment was under influence of better than expected US jobs data posted for June. The BTC reached the level of $110K on Wednesday, but still, ending the week lower. Majority of other cons peaked during the week, but are still ending the week lower. On a weekly basis, there has been almost an equal number of gainers and losers among crypto coins. Total market capitalization gained 1% for the week, adding $24B to its total cap. Daily trading volumes remained relatively flat during the week, moving around $153B on a daily basis. Total crypto market capitalization from the beginning of this year currently stands at 2%, with a total funds inflow of $50B.
The largest coin was moving the market during the previous week. BTC closed the week by 0,7% higher on a weekly basis, adding $15B to its total cap. This week ETH also managed to close it 2,7% higher, increasing its market cap by $7,9B. Market favourite Solana had a significant surge during the week, till the level of $159, however, it is ending the week above the $146, marking the weekly loss of 2,9%, or $2,3B outflow of funds. DOGE had a similar movement, but ending the week with a modest loss of 0,5%. ADA managed to sustain its weekly gains, ending it at 1,8% higher. Uniswap had a drop in value of 2,7% while Maker lost almost 5% in value.
Although market prices of crypto coins had a relatively volatile week, still when it comes to circulating coins, the situation was much calmer. Stellar had the highest weekly decrease of the number of coins on the market , of 1%. Such withdrawals are not frequent with this coin. Filecoin traditionally is increasing the number of coins on the market, with this week's increase of 0,3%.
Crypto futures market
Crypto futures also reacted to a positive investor sentiment, where both BTC and ETH futures ended the week higher. BTC short term futures had a modest increase of some 0,7%, while the longer term ones closed the week higher by 2,6%. Futures maturing in December this year ended the week at the level of $113.750, and those maturing a year later were last traded at $120.395.
Similar development was also with ETH futures, where short term ones closed the week by 2,9% higher, and longer term ones surged by more than 7% on a weekly basis. ETH futures maturing in December 2025 were last traded at $2.689. Futures maturing in December 2026 closed the week at $2.894.

BTCUSDTIt seems that the price of $110,000 is a strong resistance for Bitcoin, and as long as the price is below $110,000, its trend is bearish, and we can consider the targets of $107,000 and $105,000 for it.

XAUUSDGold seems to continue its downward trend in the coming week, and as long as it is below $3,360, gold targets could be $3,300 and $3,280.

SOLANA → Pre-breakdown consolidation may lead to distributionBINANCE:SOLUSDT is declining and testing the support of the trading range as Bitcoin pauses after strong growth and enters a correction phase...
SOL looks a bit weaker than Bitcoin technically, but SOLANA has some positive fundamentals, though that might not be enough.
After forming a false breakout of key daily resistance, Bitcoin is moving into a correction phase. An update of local lows on the chart could trigger a drop across the entire cryptocurrency market.
In SOL, the focus is on the two nearest levels of 148.75 and 145.64. A breakdown of support could trigger the distribution of accumulated energy within the specified range as part of a downward momentum.
Resistance levels: 148.75, 151.2, 153.88
Support levels: 145.64, 138.59
The ideal scenario would be a false breakout of 148.75 (liquidity capture) and a retest of 145.64, followed by a break of support. Consolidation below 145.65 could trigger a drop to the zone of interest at 138.59.
Best regards, R. Linda!

Watch Hyperliquid Surge 18% to $46 Key Resistance LevelHello,✌
let’s dive into a full analysis of the upcoming price potential for Hyperliquid 🔍📈.
KUCOIN:HYPEUSDT is trading within a reliable daily ascending channel and is currently near its lower boundary, where a strong daily support zone has formed. This setup suggests a potential upside of at least 18%, with a target around $46 , which aligns closely with a key trendline. 📈
✨ Need a little love!
We pour love into every post your support keeps us inspired! 💛 Don’t be shy, we’d love to hear from you on comments. Big thanks , Mad Whale 🐋

turnaround script SAI SILKS (KALAMANDIR)**Fundamental Analysis Report – The Smart Way (Research Desk)**
**SAI SILKS (KALAMANDIR) LTD. – Comparison Of Latest Data With The Last Three Years (₹ In Crores)**
| Parameter | FY 2025 | FY 2024 | FY 2023 | FY 2022 | Final Verdict |
|----------------------------|---------|---------|---------|---------|------------------------------------------------|
| Sales | 1,462 | 1,374 | 1,290 | 1,050 | Consistent growth; strong retail momentum |
| Net Profit | 85.4 | 74.0 | 65.0 | 52.0 | Steady profitability; improving margins |
| Debt/Equity Ratio | 0.16 | 0.26 | 0.34 | 0.41 | Deleveraging; balance sheet strengthening |
| Company Order Book | Strong | Strong | Moderate| Moderate| Robust demand visibility |
| Working Capital Rotation | Efficient| Average | Below Avg| Poor | Operational efficiency improving |
| Book Value | 73.9 | 65.4 | 58.2 | 50.0 | Steady growth, favorable |
| Dividend Yield (%) | 0.66 | 0.00 | 0.00 | 0.00 | Initiated dividend; positive signal |
| Operating Performance | Strong | Moderate| Moderate| Weak | Margin expansion underway |
| Equity Capital | 30.67 | 30.67 | 30.67 | 30.67 | Stable, no dilution |
| Total Debt | 215.4 | 260.0 | 310.0 | 350.0 | Declining, well-managed |
| Long-Term Borrowings | 130.0 | 160.0 | 190.0 | 220.0 | Reduced, supports stability |
| Short-Term Borrowings | 85.4 | 100.0 | 120.0 | 130.0 | Controlled, improving liquidity |
| Total Liabilities | 1,020 | 950.0 | 880.0 | 810.0 | Gradual expansion, manageable scale |
| Fixed Assets | 546.6 | 510.0 | 470.0 | 430.0 | Steady capex; retail footprint expanding |
| Land Purchased | 0.0 | 0.0 | 0.0 | 0.0 | No land holding |
| Building Investment | 0.0 | 0.0 | 0.0 | 0.0 | Not disclosed separately |
| Machinery Investment | 3.0 | 2.8 | 2.3 | 2.1 | Minor additions; lean infra |
**Latest Highlights**
- FY25 revenue grew 6.4% YoY to ₹1,462 Cr; net profit rose 15.3% YoY to ₹85.4 Cr
- EPS: ₹5.79 | Net Margin: 5.84%
- Debt-to-equity ratio at 0.16 | ROE: 7.54% | ROA: 5.20%
- Dividend yield: 0.66% | P/E: 22.7 | P/B: 1.71
- Promoter holding: 60.8% | Market cap: ₹2,168 Cr
- 69 stores operational as of June 2025; expanding under Kanchipuram Varamahalakshmi Silks format
- Focus on ethnic wear, bridal, and value fashion across South India
**Business Growth Verdict**
Yes, SAI SILKS (KALAMANDIR) LTD. is delivering consistent growth
- Revenue and profit have grown steadily over 3 years
- Debt is reducing and return ratios are improving
- Retail expansion and brand positioning support long-term scalability
**Final Investment Verdict: BUY (Retail Growth Play)**
**Reasoning:**
SAI SILKS (KALAMANDIR) has demonstrated consistent financial performance, strong brand equity in ethnic retail, and disciplined capital management. With improving margins, expanding store base, and a lean balance sheet, it offers a compelling long-term retail growth story. Valuation remains reasonable (P/E ~22.7), making it suitable for investors seeking exposure to branded apparel and regional consumption themes.
**Issued By:** *The Smart Way (Research Desk)*
*Disclaimer:* This report is for informational purposes only and is not investment advice. Consult a SEBI-registered advisor before making any investment decisions.

GOLD don't BUY NOW this is how it goes for the next candlsticks patterns, it may urge for some new highs b but we most definitly should wait
XRP rise to 2.32 or total surge to 2.52 or back to 2.15....Hello Losers and Winners, I am Bob, long time TV ideas listener first time poster here goes:
XRP has been capitulating for maybe three days now between price 2.20 - 2.225-ish price. I see need for XRP to reduce itself to 2.15 (local cme) then to hopefully bounce and hopefully in coming 24 hrs. Alternatively stays capitulating or even bumps from here, who knows, it is a completely unpredictable coin and I love it so. (but for that reason you need bets either way):)

Here's why oil prices continue to slumpBrent Crude remains under pressure and has really caught our eye. The weakness in recent weeks is significant. The price recently failed to hold above its 200-day moving average, reinforcing downside risks. Without momentum, prices could revisit June lows unless short-term hurdles at US$69 and US$72 are decisively cleared.
This weakness aligns with BP's latest Energy Outlook, which is due out this week (usually in July each year). We'll be keeping a close on global wind and solar capacities, which are projected to increase eightfold and fourteenfold, respectively, by 2050. This rapid growth in renewables, coupled with declining oil demand, suggests a structural shift in energy markets.
China is leading this shift. By 2030, it is projected to install over 500 gigawatts of solar capacity annually, surpassing the United States' total annual energy production. This underscores the scale of China's renewable energy expansion.
The technical rejection at the 200-day moving average, combined with BP's forecasted demand peak, indicates a bearish outlook for oil. Unless Brent can reclaim and sustain levels above key resistance points, further declines are likely.
The convergence of technical weakness and shifting demand dynamics underscores a bearish stance on oil. Traders should monitor key technical levels and remain cautious amid these evolving market conditions.
The forecasts provided herein are intended for informational purposes only and should not be construed as guarantees of future performance. This is an example only to enhance a consumer's understanding of the strategy being described above and is not to be taken as Blueberry Markets providing personal advice.

VISHNUSURYA INFRA techno-funda analysisVishnusurya Projects & Infra Ltd. is a Chennai-based construction and infrastructure company involved in civil contracting, roadwork, bridges, and earthmoving services. It also undertakes bitumen supply and mining contracts for state and national authorities. The stock is currently trading at ₹178.65 after a strong recovery from its recent base and is beginning to show structural trend formation.
Vishnusurya Projects & Infra Ltd. – FY22–FY25
Snapshot Sales – ₹232 Cr → ₹276 Cr → ₹321 Cr → ₹367 Cr – Consistent growth, healthy execution pipeline
Net Profit – ₹4.8 Cr → ₹7.1 Cr → ₹10.6 Cr → ₹14.8 Cr – Accelerating profitability, scale benefits emerging
Company Order Book – Moderate → Moderate → Strong → Strong – Increasing traction from infra contracts Dividend Yield (%) – 0.00% → 0.00% → 0.00% → 0.00% – No distributions, reinvestment-focused
Operating Performance – Weak → Moderate → Moderate → Moderate – Improving EBITDA visibility
Equity Capital – ₹27.55 Cr (constant) – Stable ownership base
Total Debt – ₹92 Cr → ₹88 Cr → ₹81 Cr → ₹75 Cr – Deleveraging progressing cautiously
Total Liabilities – ₹184 Cr → ₹196 Cr → ₹210 Cr → ₹225 Cr – Proportionate to execution scale
Fixed Assets – ₹88 Cr → ₹94 Cr → ₹101 Cr → ₹108 Cr – Ongoing capex to support order execution
Latest Highlights
FY25 net profit rose 39.6% YoY to ₹14.8 Cr; revenue up 14.3% to ₹367 Cr
EPS: ₹5.37 | EBITDA Margin: 13.6% | Net Margin: 4.03%
Return on Equity: 9.74% | Return on Assets: 6.58%
Promoter holding: 72.08% | Dividend Yield: 0.00%
Major road and civil contracts under execution in Tamil Nadu and Andhra Pradesh
Continued capex toward machinery, bitumen handling, and project mobility infrastructure
Technical Snapshot Vishnusurya is trading at ₹178.65 with an RSI of 50.76, showing early-stage trend strength near a long-term base. Volume activity is increasing steadily, pointing to institutional accumulation. Support levels are visible near ₹222.92, ₹156.98, and ₹273.60, while upside breakout zones exist at ₹397.60, ₹463.50, and ₹547.50 if the upward trend sustains.
Business Growth Verdict Yes, Vishnusurya is expanding its business on solid foundations
Profitability and margins are strengthening with better project mix
Debt is being managed conservatively amid revenue growth
Fixed asset expansion is paced well with project pipeline visibility
Final Investment Verdict Vishnusurya Projects & Infra Ltd. offers a compelling infrastructure turnaround story from the South Indian EPC space. The company’s rising revenue, expanding margins, and stable debt profile suggest disciplined execution and improving scale efficiency. Although dividend returns are absent, the reinvestment approach underlines long-term growth intent. For investors seeking a high-ROA infra bet with rising order flow and technical momentum, this stock merits active tracking for staggered accumulation.

GBP/USD weekly outlookMy weekly outlook & key levels for GBP/USD. I will look for a confirmation of my strategy once reach one of this levels.

GBP/CHF Headed to 1.10 – But Bulls Might Regret It📉 1. Price Action & Technical Structure (D1)
Key demand zone tested with bullish reaction:
Price reacted strongly around the 1.0790–1.0840 structural demand area, previously the origin of a significant bullish impulse. The latest daily candle closed above the previous swing low, suggesting a potential technical rebound.
Immediate target:
The 1.0980–1.1010 zone, aligning with:
A clear supply area
RSI bouncing from oversold territory
A visible imbalance left unfilled
Technical bias: Short-term LONG to fill the imbalance before a potential institutional-driven short setup at supply.
2. Retail Sentiment
86% of traders are LONG, with an average entry of 1.0997
Only 14% are SHORT, with lower volume and better pricing
Current price: 1.0833, meaning most long traders are in drawdown
Contrarian view:
The heavy long positioning creates a liquidity pool between 1.0990–1.1010, making that zone highly attractive for institutional distribution and liquidation of retail longs, especially if accompanied by a structural shift.
🎯 Operational impact:
Supports a technical long to 1.10, but high risk of reversal once that level is reached.
3. COT Report
GBP (British Pound – CME)
Non-commercials:
Long: -6,434 → massive unwind of bullish exposure
Short: +2,028 → rising bearish bets
Net positioning is increasingly bearish
Commercials:
Long: +7,459 → increasing coverage against GBP weakness
Short: -569 → slight reduction
Positioning is mixed, but commercials are taking defensive long positions
GBP interpretation:
Bearish pressure rising from institutional speculators, despite some commercial support.
CHF (Swiss Franc – CME)
Non-commercials:
Long: +327
Short: +1,215
Net positioning still heavily short, but shorts increasing again
Commercials:
Long: +1,909
Short: +307
Commercials are accumulating long CHF positions (bullish sign)
CHF interpretation:
Divergence between commercials (bullish CHF) and speculators (still short) → shift may be underway.
4. July Seasonality
GBP:
Historically strong in July, especially the last 2 years (+3.5%)
Positive tendency across 10y/15y/20y averages
CHF:
Also seasonally positive in July, but underperforms GBP across most timeframes (except 2Y where CHF is also strong)
Operational impact:
Favors short-term bullish GBP/CHF bias, supported by seasonal momentum.
✅ Final Outlook
Current short-term bias is bullish, driven by:
Clear technical rebound
Visible imbalance toward 1.10
Seasonal divergence in favor of GBP
However, excessive retail long positioning + COT speculative pressure on GBP suggest this rally could be a distribution phase, offering an optimal short opportunity at 1.10.

#USDCHF: Will USD Breakthrough The Strong Bearish Downtrend? The USDCHF currency pair has experienced significant volatility due to the ongoing trade dispute between the United States and China, which has led to a substantial decline in the DXY index. Consequently, CHF and JPY have emerged as the most stable currencies in the market.
Despite the USDCHF currency pair reversing its bullish trend, we anticipate a potential reversal back to a bearish position. We believe this reversal may be a temporary trap, and the currency pair is likely to regain its bullish position in the future.
There are two potential areas where the USDCHF currency pair could reverse from its current trend. The first area is relatively early, and if the USDCHF currency pair crosses a specific region, we may have a second safe option that could provide greater stability.
We extend our best wishes and best of luck in your trading endeavours. Your unwavering support is greatly appreciated.
If you wish to contribute, here are several ways you can assist us:
- Like our ideas
- Comment on our ideas
- Share our ideas
Team Setupsfx_🚀❤️

Wait for ETH to rebound to $2528-2542 and place a short order.Short
$2528~$2542
Take Profit
$2480, $2460
Stop Loss
$2555
If the price falls below $2510, do not chase short, wait for a rebound.
