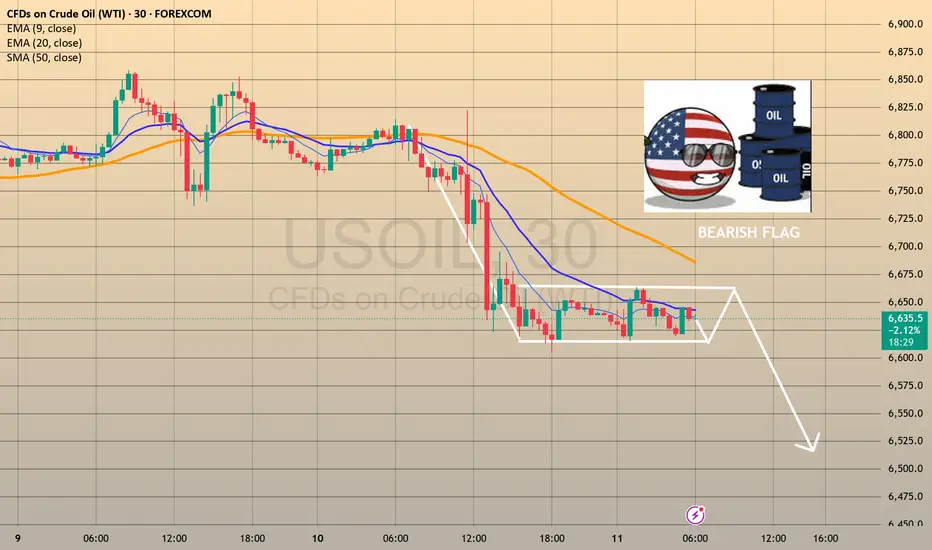
TRADING IDEA - US CRUDE OIL - BEARISH FLAG, CONCERNS ON GLOBAL EFOREXCOM:USOIL
The US Crude Oil prices went down yesterday, mostly because of the tariffs and concerns on demand.
Here is what the Bloomberg is writing: " OPEC+ is discussing a pause in its oil production increases from October is fueling concerns about a slowdown in global energy demand. In addition, the intensification of US tariffs risks slowing global economic growth and energy demand after President Trump ramped up tariffs on numerous countries this week, including a 50% tariff on Brazil."
So, despite the pause in oil production increase, which is supposed to be bullish factor the oil prices, we may see the slowdown in global economy and supposedly a recession because of Trump's tariffs. This is a long-term bearish factor for the oil. I think that we will see another bearish impulse here, according to what we observe on the chart.
There is a nice bearish flag and i am planning to short it with a target nearby 6,540.00 support level.
🔽 a pending sell stop order at 6615.3 with
❌a stop loss at 6680.9 and
🤑a take profit at 6544.0
Trade cautiously! Preserve your deposits!
Fundamental Analysis
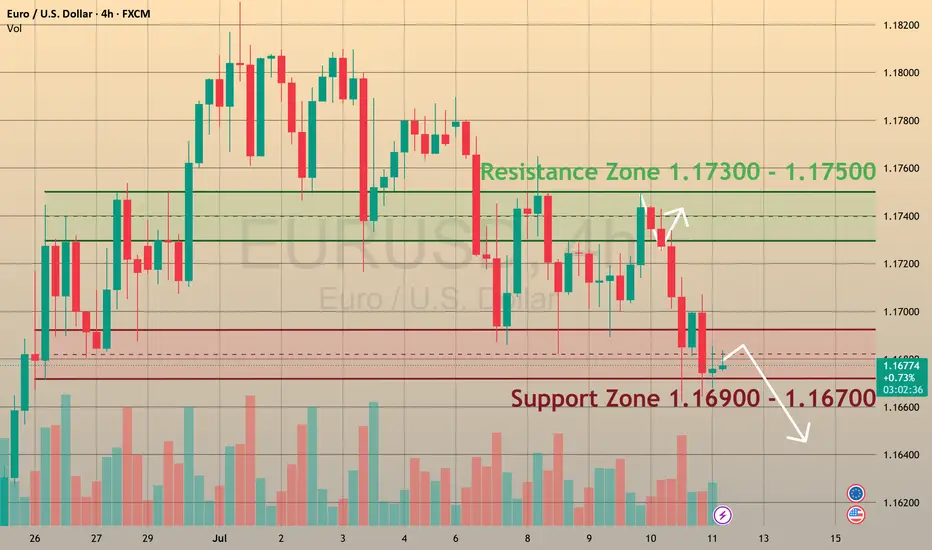
EURUSD is ready to break supportCMCMARKETS:EURUSD
The Euro fell to 1.1670 on Friday, positioning for nearly a 1% weekly loss 📊, as investors recalibrated risk exposure amid escalating trade tensions ⚔️ and shifting monetary policy signals 🏦.
📉 Market Structure:
🔻 EURUSD has traded in a bearish trend since July 1.
🔹 Support levels: 1.1680 and 1.1590.
🔹 Retested the 1.1680 support zone on Friday.
💡 How to Trade This:
✅ If the pair rebounds from support 🔄, consider BUYING with a Take Profit near the next resistance level.
❌ If the support breaks with confirmation 🩻, consider SELLING to target lower support zones.
📰 What’s Driving the Move?
🏦 Monetary Policy:
Chicago Fed President Austan Goolsbee pushed back against calls for aggressive rate cuts 🗣️, reaffirming the Fed’s focus on its dual mandate of maximum employment and price stability ⚖️. His cautious stance adds uncertainty 🤔 to the policy outlook for the second half of the year as markets weigh inflation risks vs. growth slowdown signals.
💼 Economic Data:
The labor market remains solid 💪, but recent jobless claims data show early signs of cooling 🧊, following last week’s strong NFP report.
💵 Dollar Strength:
The dollar advanced sharply against the euro 🚀, driven by risk aversion, relative yield advantages, and investor positioning ahead of upcoming inflation data and the Fed’s next policy signals 📈.
🚨 Watch for:
🔸 A confirmed breakout or rebound at 1.1680 to guide trade entries.
🔸 Upcoming U.S. inflation data 🪙 for direction on Fed policy and USD strength.
🔸 Further developments in trade tensions 🌐, which could drive risk sentiment.

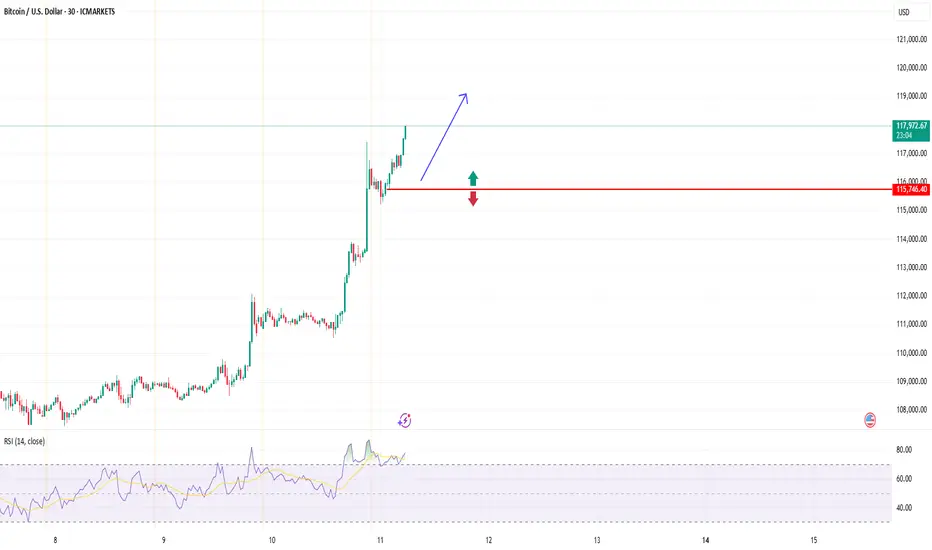
BTCUSD (Bitcoin): Forex Technical AnalysisDate: 11 July 2025
Momentum: Up
First Scenario : long positions above 115,706.14 with targets at 117,269.52, 117,904.51 and 118,513.05
Second Scenario : short positions below 115,706.14 with targets at 114,544.35, 113,774.89 and 113,053.39
Comment: RSI - Bullish.
Supports and resistances :
118,513.05 **
117,904.51 *
117,269.52
116,747.25 - Last price
114,544.35
113,774.89 *
113,053.39 **
BTCUSD Heading Yesterday's Resistance Zone, Price Will React After a recovery to 107.500 BTCUSD is recovering to the upside again towards the resistance of 1.09500. This is the convergence zone between the trendline and yesterday's high. BTCUSD price may correct lower from this zone. Then find some new bullish momentum at strong support zones towards an all-time high.
Support 107.500 - 105.300
SELL Trigger: Break bellow 107.500
Resistance: 109.500- 110.500
Wish you successful trading, leave your comments about BTC.

USDCHF continues bullish recovery. Opportunity for BUY signal✏️#USDCHF is showing bullish recovery. The price is trading in a triangle pattern in the recovery phase. The 1.79500 area is an important support zone that is driving the pair's upside. 0.80700 is the immediate Target for a BUY signal.
📈Key Level
SUPPORT 0.79500
RESISTANCE 0.80700
BUY now at support 0.79500
Target: 0.80700
SELL Trigger: Break support 0.79500
Leave your comments on the idea. I am happy to read your views.

Gold price surge, today will have a decline✏️ OANDA:XAUUSD The recovery of the D1 candle and the closing candle above 3313 means that the market's downtrend has almost been broken.
The reaction at the current trendline 3284 is still very strong. The price is strongly supported by the buyers, causing gold to return to trading in a wide range.
The 3328 zone will be important in the near future. If it does not break, there will be a decline to the Gap price zone this morning. Trading according to the top-bottom method is suitable for the current market.
Support: 3312-3295-3279
Resistance: 3328-3339-3349-3363
Sell trigger: rejection from 3328–3,340 resistance block
Target: 3295 Support zone, followed by 3279 lower zone
Leave your comments on the idea. I am happy to read your views.

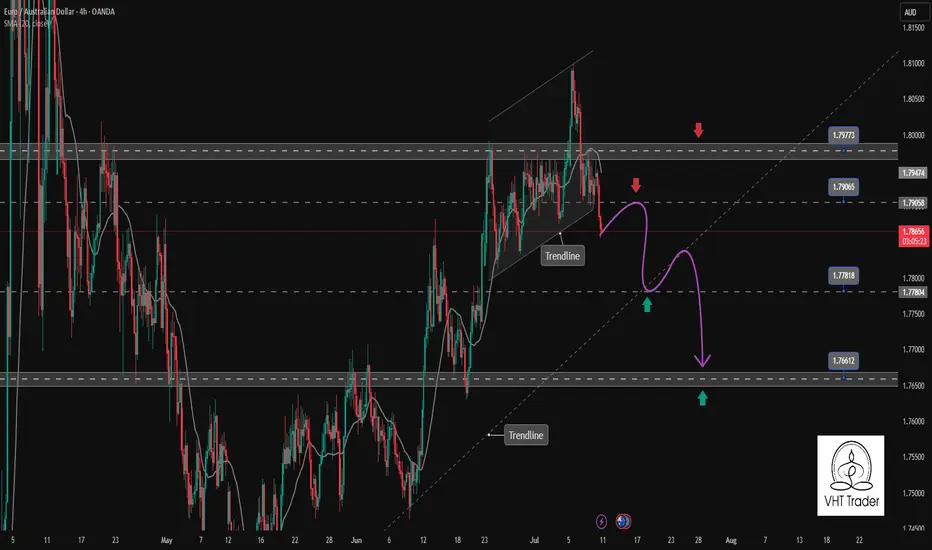
EURAUD confirms the continuation of the bearish correction trendEURAUD has just broken the rising channel to start a downtrend. The confirmation is there with the h4 candle closing completely below the support zone of the Price Channel. This corrective downtrend can now extend to the support of 1.766. The support zone is a Break point at the moment 1.778 is a positive DCA point with a SELL Entry above.
Support: 1.778-1.766
Resistance: 1.790-1.797
Sell now: Resistance zone 1.79000
Target: 1.778 Support zone, followed by 1.766 lower zone
Sell Trigger: Break below 1.778
BUY Trigger: rejection 1.778 Support zone
Leave your comments on the idea. I am happy to read your views.
Gold Price Analysis July 10🔹 XAUUSD Analysis – D1
Yesterday's D1 candle showed a strong recovery, closing above 3313, thereby significantly weakening the previous downtrend structure. Currently, the price is reacting very strongly at the trendline around 3284. Buying pressure is clearly appearing, pushing gold back to trading in a wide range.
In the short term, the 3328 area will play an important resistance role. If the price cannot break this area, the possibility of a correction down to the Gap price area this morning is quite high. The peak-bottom trading method is still giving suitable signals in the current market context.
🔹 Important zones:
Support: 3312 – 3295 – 3279
Resistance: 3328 – 3339 – 3349 – 3363
💡 Strategy:
Confirm the trading signal when the price clearly rejects the resistance zones to ensure the highest winning rate.

GOLD continues to recover, tariff war changes unpredictablyInternational OANDA:XAUUSD continued to rise, boosted by a slight decline in the US Dollar and US Treasury yields. At the same time, investors are closely monitoring the developments in trade negotiations as US President Trump expands the tariff war.
As of the time of writing, spot OANDA:XAUUSD increased by 0.3% to 3,333 USD/oz. The general weakness of the US Dollar, the decline in US Treasury yields and renewed concerns about the escalation of the trade war have helped stabilize gold prices.
On Thursday evening (July 10) local time, US President Donald Trump once again increased pressure on trading partners. He announced that he would impose a 35% tariff on imported goods from Canada, and the USD/CAD exchange rate rose sharply in the short term.
Trump posted on his social media platform Truth Social that a 35% tariff would be imposed on imported goods from Canada, effective from August 1, 2025.
It is still unclear whether the current exemptions for goods traded under the United States-Mexico-Canada Agreement (USMCA) will be extended or terminated.
Due to the impact of escalating trade tensions, spot gold prices also rose by more than 10 dollars in the short term at the beginning of the Asian trading session on Friday, and the current high price of gold has reached around 3,336 USD/ounce.
In an interview with NBC News on Thursday, Trump said he was also considering imposing a flat tariff of 15% to 20% on most of his trading partners, adding that the exact tariff rate was being worked out. The current flat tariff rate is 10%.
Trump sent letters to trading partners this week, announcing that the new tariffs would take effect on August 1 if they could not negotiate more favorable terms. He is expected to send letters to European Union member states soon.
Trump sent the first batch of tariff letters to 14 countries, including Japan and South Korea, on July 7, with tariffs ranging from 25% to 40%. He also said he would send more similar letters this week.
Minutes from the Fed's June 17-18 meeting showed that only a "few" Fed officials thought a rate cut was possible as early as this month, while most preferred to hold off until later in the year due to inflation concerns caused by Trump's tariffs.
The Federal Open Market Committee (FOMC) voted unanimously to leave interest rates unchanged at its June meeting. The next policy meeting is scheduled for July 29-30.
Markets will focus on progress in Trump's tariff negotiations, key US economic data and speeches by Federal Reserve officials later in the day for fresh trading direction for gold prices.
Technical Outlook Analysis OANDA:XAUUSD
Gold has had 2 sessions of recovery from the area around the 0.382% Fibonacci retracement, but the temporary upside momentum is still limited and does not qualify for a new bullish cycle.
In the short term, the EMA21 with the 0.236% Fibonacci retracement will act as the nearest resistance, if gold takes the price action to break above the 0.236% Fibonacci retracement level it will qualify for a new bullish cycle with the target then being around $3,400 in the short term, more so than $3,430.
On the other hand, with the current neutral trend, once gold is sold below the 0.382% Fibonacci retracement level again, it will have conditions to decline, and the target then is around 3,246 USD in the short term, more than the 0.50% Fibonacci retracement level.
The RSI index is hovering around 50, also showing that the market sentiment is still hesitant to have a specific direction.
During the day, the sideways trend of gold prices will be noticed by the following positions.
Support: 3,300 - 3,292 USD
Resistance: 3,340 - 3,350 - 3,371 USD
SELL XAUUSD PRICE 3388 - 3386⚡️
↠↠ Stop Loss 3392
→Take Profit 1 3380
↨
→Take Profit 2 3372
BUY XAUUSD PRICE 3296 - 3298⚡️
↠↠ Stop Loss 3292
→Take Profit 1 3304
↨
→Take Profit 2 3310

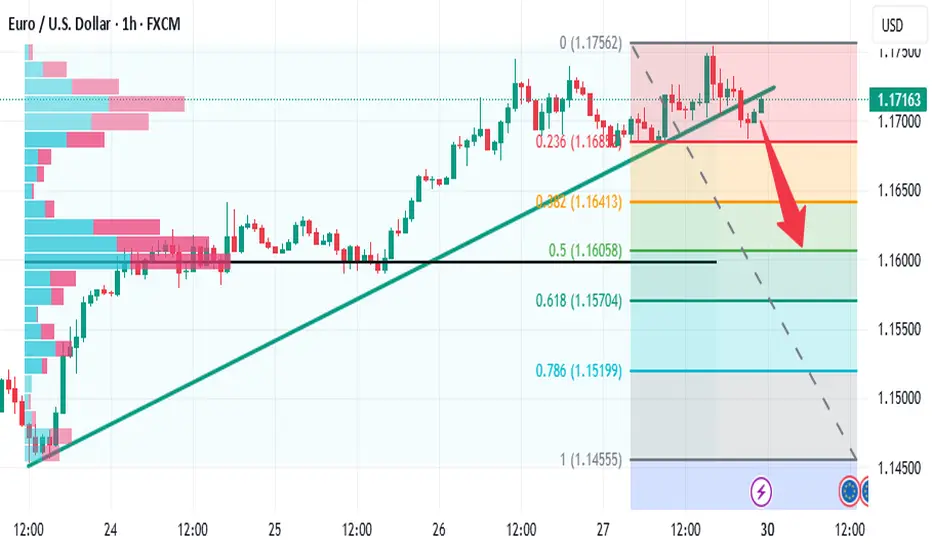
EURUSD PullbackYesterday, EURUSD continued its pullback, reaching 1,1660.
The next support levels to watch are 1,1636 and 1,1591.
Keep an eye on price action around those support levels for potential buying opportunities.
At the current levels, there’s no reason to enter a trade yet!

ZRX Just Broke Out… But Is It a Bull Trap Before a Collapse?Yello Paradisers did you catch that breakout from the falling wedge, or are you about to get faked out like the rest?
💎#ZRX/USDT has finally broken out of its descending resistance after weeks of compression. While this is a promising signal, this move alone is not enough. What really matters now is how price behaves on the retest. We're watching closely for a pullback either into the previous wedge resistance or directly into the key demand zone between $0.205 and $0.215. That area needs to hold if the bulls want to keep momentum on their side.
💎The structure remains valid as long as we stay above the $0.180 level. A break below that zone would completely invalidate this bullish setup and open the door to a deeper drop. On the upside, if buyers step in with volume, the path toward $0.260 and possibly $0.300 becomes much more realistic.
💎This is not the moment to chase. Let retail traders jump in too early our job is to position smartly, not emotionally. Watch the retest, measure the reaction, and act only when the market confirms.
This is where most retail traders get trapped, they chase the move too late or panic-sell too early. Don’t be that trader. Stay focused. Be precise.
MyCryptoParadise
iFeel the success🌴

EURUSD next week bearishNext week local bearish correction to area 1.16.
If bears broke that area then next target 1.154 and 1.15
But if bulls push price above 1.175 bullish trend continue to 1.18+
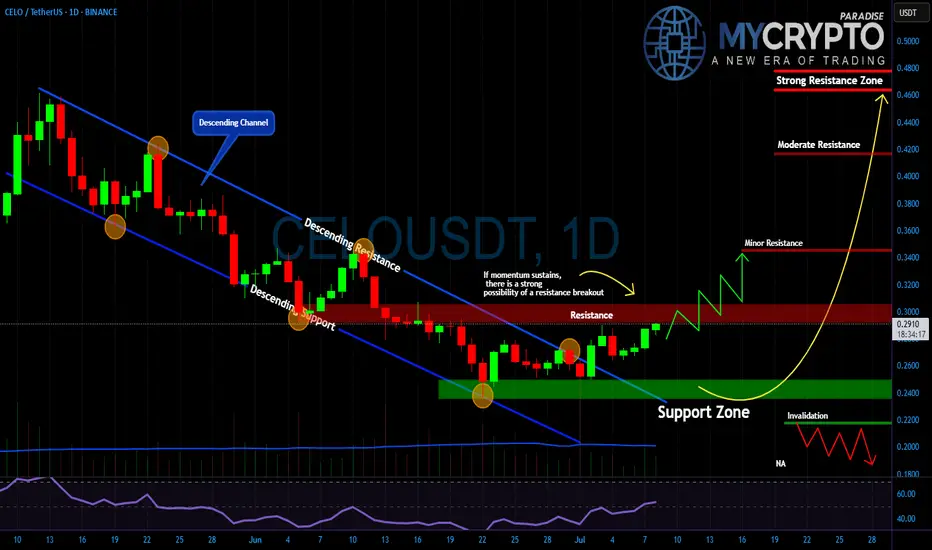
CELO About to Explode or Fakeout Incoming?Yello, Paradisers! Is this the breakout we’ve been patiently waiting for or just another trap to liquidate late buyers?
💎After weeks of grinding lower inside a clear descending channel, #CELO/USDT has finally broken out to the upside. That breakout alone isn’t enough, but it’s a critical first signal that sellers are losing control. Price is now pushing right into the key resistance zone at $0.29–$0.30, and what happens here will decide the next major move.
💎If momentum holds and price reclaims this level with conviction, we could see an explosive move toward $0.34 and potentially even the stronger resistance zones at $0.41 and $0.47 in the coming weeks. But if buyers fail to defend this push, and price rolls over, then the bullish setup quickly falls apart.
💎What gives us more confidence? The support zone at $0.24–$0.25 held beautifully buyers stepped in hard, and the market reversed cleanly from there. But if #CELO drops back below $0.22, the setup is invalidated and we'll wait patiently again for the next high-probability entry.
This is where most retail traders get trapped, they chase the move too late or panic-sell too early. Don’t be that trader. Stay focused. Be precise.
MyCryptoParadise
iFeel the success🌴
XAG/USD (Silver) - Triangle Breakout (09.07.2025)The XAG/USD (Silver) pair on the M30 timeframe presents a Potential Buying Opportunity due to a recent Formation of a Wedge Breakout Pattern. This suggests a shift in momentum towards the upside and a higher likelihood of further advances in the coming hours.
Possible Long Trade:
Entry: Consider Entering A Long Position around Trendline Of The Pattern.
Target Levels:
1st Resistance – 3749
2nd Resistance – 3781
🎁 Please hit the like button and
🎁 Leave a comment to support for My Post !
Your likes and comments are incredibly motivating and will encourage me to share more analysis with you.
Best Regards, KABHI_TA_TRADING
Thank you.
Disclosure: I am part of Trade Nation's Influencer program and receive a monthly fee for using their TradingView charts in my analysis

Gold is fluctuating. Can it break through?Since the price of gold rose to 3500 on April 22 and encountered resistance and fell back, it has shown a triangular convergence and fluctuation trend so far. From the short-term trend, after the decline adjustment on Tuesday, it bottomed out and rebounded on Wednesday to close with a positive line, and on Thursday it completed the shock consolidation with a small positive line. The current moving average system is in an intertwined state, and the short-term market tends to fluctuate.
Today, we need to pay attention to the resistance of the 3340-3345 range. This position is a high point concentration area that has suppressed the upward movement of gold prices many times in the early stage. If the gold price breaks through this range, the bullish trend is expected to continue.
From the current trend, after the gold price bottomed out and rebounded, it formed a short-term support at 3310. Secondly, we need to pay attention to the support strength near the low point of 3282 on Tuesday. In terms of operation, it is still necessary to operate around the range.
Operation strategy:
Short when the price rebounds to around 3345, stop loss at 3355, profit range 3320-3300
Long when the price falls back to around 3310, stop loss at 3300, profit range 3320-3340

Inside to higher Although the S&P 500 daily chart broke to the downside the Asia session is indicating buyers are supporting this market. It implies an inside day within Thursday’s range to a higher close going into the weekend.

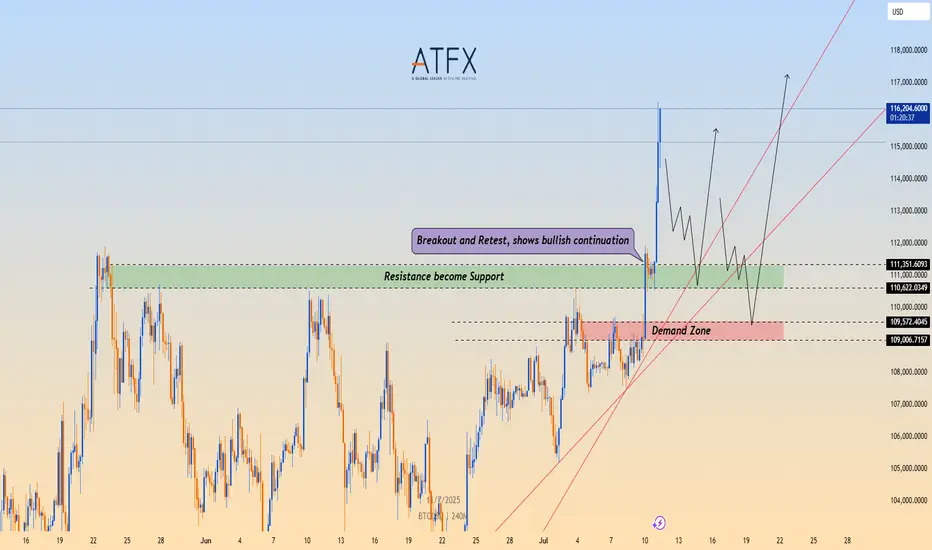
BTC/USD Breaks Out, Eyes Fresh Highs Above $116,000📉 Technical Structure
BITSTAMP:BTCUSD BTC/USD confirmed a bullish breakout above the $111,000–$111,350 resistance zone, which has now flipped into support. Price action shows a clean retest and bounce from this level, indicating a bullish continuation. Key support lies at the $110,600–$109,000 demand zone. If the price clears $116,800, bulls may target $118,000–$120,000 next.
📈 Long Trade Setup
Entry: $111,350
Stop Loss: $109,000
Take Profit 1: $116,800
Take Profit 2: $118,000
Invalidation: Break below $109,000 and trendline
🌐 Macro Background
BINANCE:BTCUSD Bitcoin rallied above $116,000 to a new all-time high after clearing the $111,000 resistance. The breakout was supported by strong momentum and optimism following a technical trendline breach. Despite some selling pressure and rising funding rates, the broader trend remains bullish. A sustained move above $116,800 could open the door toward $120,000.
📌 Key Technical Zones
Resistance: $116,800 / $118,000
Support: $110,622–$111,350, $109,006–$109,572
📘 Trade Summary
As long as BTC/USD remains above $111,350, the bullish structure is valid. Short-term pullbacks into the $109,006–$109,572 zone may offer buying opportunities.
⚠️ Disclaimer
This analysis is for informational purposes only and does not constitute investment advice.
Oxford Industries | OXM | Long at $38.10Oxford Industries NYSE:OXM is an apparel company that designs, sources, markets, and distributes lifestyle brands like Tommy Bahama, Lilly Pulitzer, and Southern Tide. While I am not super bullish on the retail sector given the blaring recession signals, I also don't think this is the end of life as we know it... the anticipated downside is already priced-in for many retail brands.
From a technical analysis perspective, NYSE:OXM has entered my "crash" simple moving average zone. Typically, but not always, this is an area where value investors accumulate shares in anticipation of a future rise in share price. While the price is likely to dip near $28-$30 in the near-term, the last open price gap on the daily chart since the COVID-19 pandemic was closed today. Also, last week, an NYSE:OXM Officer and the CEO bought just over $600,000 in shares near $40 and the stock is currently trading at book value.
Fundamentals:
P/E = 7.4x (apparel sector average = 22.4x)
Forward P/E = 11.4x
Dividend = 7.25%
Debt-to-equity = .2x (healthy)
Regardless of some strong fundamentals, persistent macro volatility, consumer caution, and tariff pressures may delay recovery. Analysts expect flat to declining sales in 2025, with limited organic growth. Like I mentioned above, while there is likely short-term pain here, the fundamentals are there to potentially weather the storm.
Thus, at $38.10, NYSE:OXM is in a personal buy zone with the further decline between $28-$30 likely (where additional share accumulation will occur as long as the fundamentals do not change).
Targets into 2027
$45.00 (+18.0%)
$50.00 (+31.2%)

Jupiter long Jupiter has been one of the best exchanges in the solana space.
Seeing big potential here with juplend coming out very soon. It’ll be like the place that degens go borrow liquidity.
I think 5$ is a reasonable goal here.
They also gave away a billion dollars and are trying to actively build the eco system.

NZDCAD– Potential Bulish SetupPerfect! Since you're planning a **swing buy** on NZDCAD, here’s an updated **heading** and **description** tailored for your bullish outlook:
---
📈 NZDCAD Swing Buy Setup – Bullish
NZDCAD is showing signs of a potential bullish reversal from a strong support zone, presenting a promising swing buy opportunity.
This setup is ideal for patient traders looking to catch the next leg higher. Always follow your trading plan and apply proper risk management.

XAU USD SHORT RESULT Gold created a minor double top pattern also already showed weakness in bulls after retesting the Daily Trendline Support, so it was a good indication for the short position I entered and it moved just as Predicted to Profit.
_THE_KLASSIC_TRADER_.

Guys dont sell !!!It needs to go up and its, being pushed by big whales stock piling large amounts of cash.
So let it keep going. Ride it. Never sell. It will never be the same. This is the new era of ETH.
If you all go on too late for BTC, now is your chance to get on ETH and be part of the base.
It's going to recover big time. It is the best mainnet out there stable, and very versatile. It's starting to get traction more and more for its stable trajectory in the past five years.
Start loading up the truck guys.
