Gold price analysis July 25Gold Analysis – D1 Uptrend Still Maintains, But Needs New Momentum
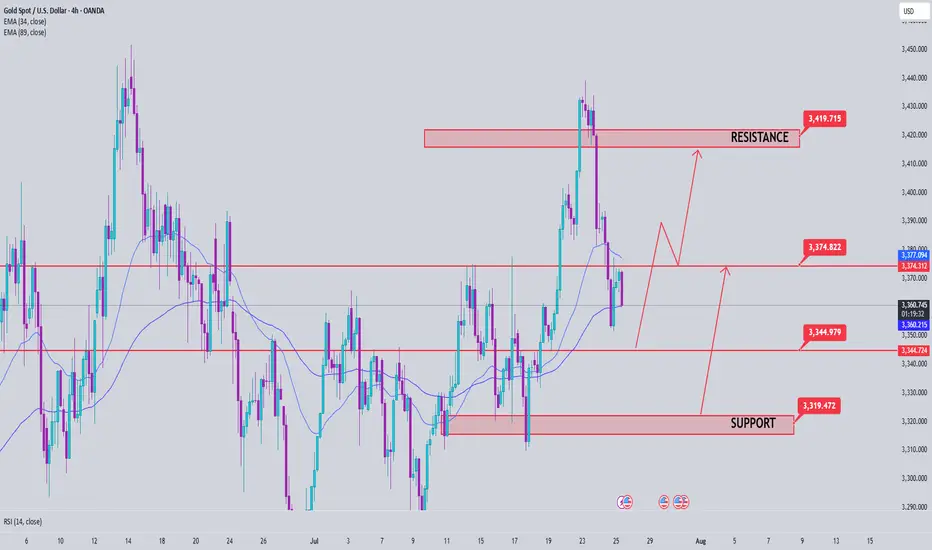
Yesterday’s trading session recorded a D1 candle closing above the Breakout 3363 zone, indicating that buying power in the US session is still dominant. This implies that the uptrend is still being maintained, although the market may need a short-term technical correction.
In today’s Tokyo and London sessions, there is a possibility of liquidity sweeps to the support zone below before Gold recovers and increases again in the New York session.
Important to note:
The uptrend will only be broken if Gold closes below the 3345 zone on the D1 chart.
In this case, the 3320 level will be the next support zone to observe the price reaction and consider buying points.
For the bullish wave to continue expanding towards the historical peak (ATH) at 3500, the market needs stronger supporting factors, which can come from economic data or geopolitical developments.
📌 Support zone: 3345 – 3320
📌 Resistance zone: 3373 – 3418
🎯 Potential buy zone:
3345 (prioritize price reaction in this zone)
3320 (in case of breaking through 3345)
🎯 Target: 3417
Fundamental Analysis
Gold fluctuated downward. Or it will continue.Gold was blocked near 3393 in the early trading on Thursday and began to fluctuate and fall, falling to 3351 as low as possible, then stopped falling and rose, and after rebounding near 3377, it was blocked and fell back to 3370 and fluctuated up and down, and the daily line closed with a negative line.
After three consecutive positive rises from last Friday to Tuesday this week, gold ushered in a turning point on Wednesday. On Thursday, it continued to fall and broke through the 5-day and 10-day moving averages, and the short-term market weakened. From the overall structure, the rising channel since June 26 remains valid. The highs on Tuesday and Wednesday approached the upper edge of the channel and then fell. The current price turned to fall and approached the lower edge of the channel.
There are two key positions for the support below: the first support level is near 3345, which is the lower edge support of the current rising channel; the second support level is near 3325, which is the trend line support formed by the connection of the previous low points.
From the 4-hour chart, the 3351 low point and the rebound resistance level can be used as a reference for today's long-short game. The breaking of key support and resistance will determine the trend direction of the next stage.
Operation strategy:
Short near 3375, stop loss 3385, profit range 3350-3330
Long near 3330, stop loss 3320, profit range 3350-3370

The Markets, the Rabbi and the Goat...It’s funny how sometimes markets react like people in old jokes…
They scream when things get bad, then cheer wildly when things return to how they were — as if something amazing just happened.
Let me tell you one of those jokes.
It’s about a house, a rabbi… and a goat.
A man goes to the Rabbi:
“Rabbi, my house is too small. The kids are screaming, my wife’s yelling, I’m losing my mind!”
The Rabbi calmly replies:
“Bring in the chicken.”
Two days later:
“Rabbi, it’s worse!”
Rabbi:
“Now bring in the duck.
Then the pig.
And finally… the goat."
Now the house is in complete chaos. Smell, noise, no space to move or breathe.
The man returns, ready to break down:
“Rabbi, this is hell!”
The Rabbi smiles:
“Now take them all out.”
A few days later, the man comes back glowing:
“Rabbi… it’s incredible! So much space! So quiet! So fresh!”
📉 Now, 2025 markets
In April, Trump imposed tariffs.
Markets fall sharply. Analysts scream recession. Headlines go full drama.
Recently, “brand new deals” have been announced.
Markets explode to new all-time highs.
Applause. Celebration. “Stability is back.”
But if you read the fine print…
The deal is basically the same old deal. Renegotiated. Repackaged.
Just without the goat.

Ethereum Price Target $3,120 by Sunday?Ethereum short position Price Target $3,120 by Sunday ? Negative divergence on the hrly RSI.
Exhausted the 15 minute positive divergence when bouncing off the EMA 200 on the 1 Hour chart. First profit target is $3,350 second is $3,120. I am usually wrong with my estimations... I would recommend the opposite. So go long!

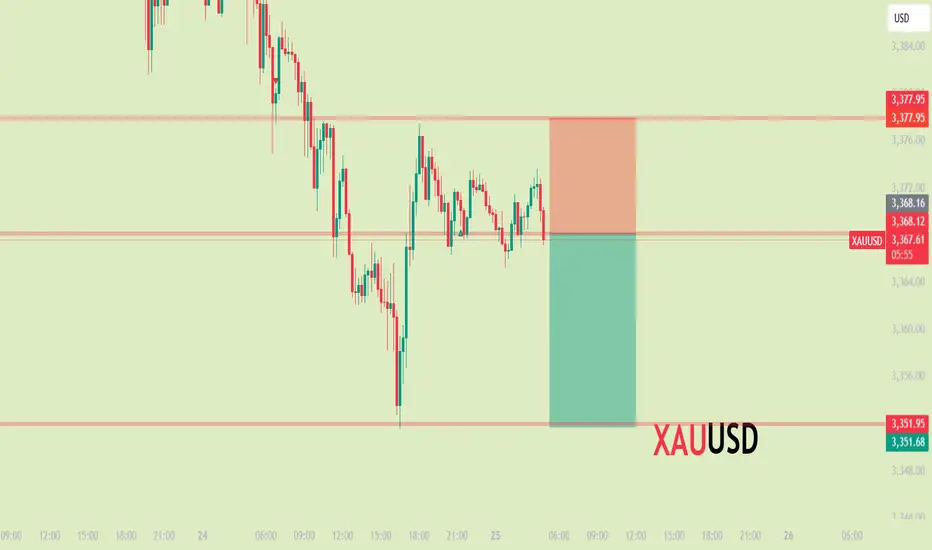
XAUUSDXAUUSD Updated in 15M :
The gold signal is marked on the chart based on the latest price changes and the supply and demand in the market. These points include the entry point, stop loss, and take profit
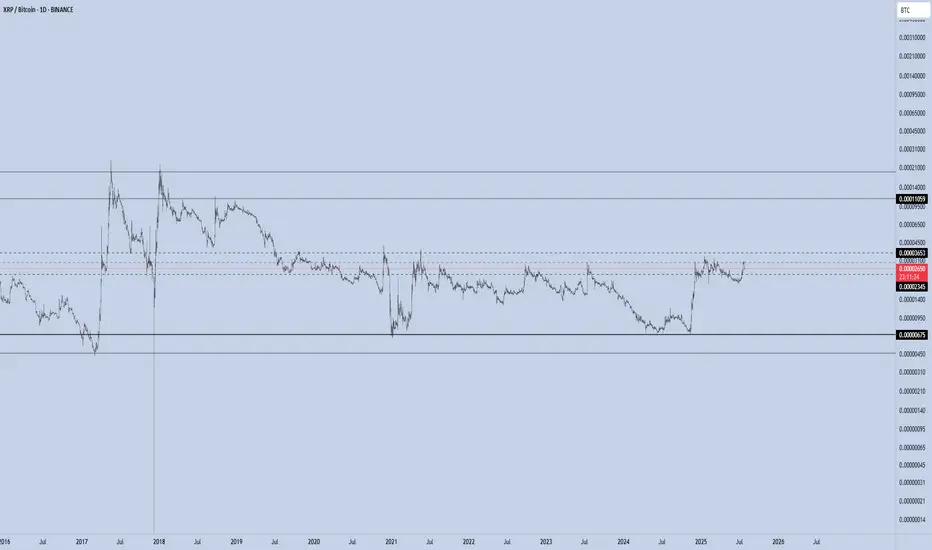
XRP/BTC – Channel Midline in Play The XRP/BTC pair trade inside a multi-year channel, with price currently testing the midline of this structure — a pivotal level that could define the next macro leg.
If bulls manage to break the midline to the upside and successfully retest it as support, the upper boundary of the channel becomes the next major target.
🔼 Upside Scenario:
A confirmed breakout above the midline would signal structural strength and likely lead to a rally toward the upper channel resistance.
If this move aligns with BTC dominance dropping below the 60% threshold, we could see a full-blown altseason emerge.
Under such conditions, historical XRP/BTC behavior suggests that XRP/USD could reach $12–$24.
🔽 Downside Risk:
Losing the mid-channel from here would weaken the structure and invalidate the breakout thesis.
In that case, XRP/BTC would likely rotate back toward range lows, and a defensive strategy is warranted.
Macro Implication:
The 60% BTC Dominance level remains critical. A clean breakdown below it historically marks the beginning of altseason, where high-beta plays like XRP against BTC have outperformed. XRP’s current posture within the channel reflects this high-stakes moment.
BTC-Alpha-"Exhaustion Zone" Update📍All Eyes on $119,300
Why? Because that’s the line that could break the bearish narrative.
A clean push above = bulls showing real strength — not just surviving, but swinging.
It might look like BTC is doing nothing… but under the hood, the chart is very much alive.
If bulls can’t break the descending trendline, it’s not just hesitation — it’s exhaustion.
And when bulls run out of gas?
The High-Powered Short Zone starts pulling like gravity.
—
🔸 Chart Patterns in Play
🟥 Bear Flag / Distribution Box
• Price is consolidating beneath a lower high + descending trendline
• Every rally attempt has fizzled inside the Exhaustion Zone
• Repeated failures at $119,300 = a clear ceiling
🟩 Coil Within Compression
• Higher lows pushing up against downtrend resistance
• Price is coiling tight — and compression always precedes expansion
• A breakout (or breakdown) is coming… the spring’s loaded
—
🧭 What to Watch
🔓 Break above $119.3K with volume = bull momentum resumes
❌ Break below $117K = bear flag confirmed → welcome back to the High-Powered Short Zone
—
Stay Sharp. Don’t confuse quiet charts with quiet outcomes.
BTC is gearing up for a move that won’t whisper.


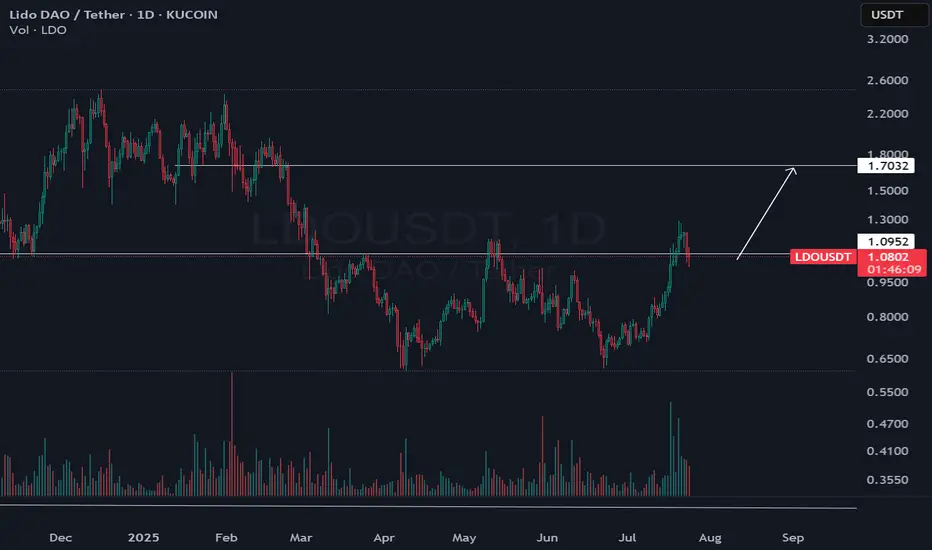
Ldo setupCrypto will have another long leg and according to my comprehensive analysis, this pump to the $1.7 range could happen for Lido.
Doge is ready to complete double bottom!I'm closely monitoring DOGE as it approaches a critical technical zone. Based on recent price action and volume behavior, there’s a strong possibility to pump!

[USDJPY] Trade ideaJust entered this long position on this forex pair for an upside move.
Trying to catch the continuation of the trend on reversal pattern.
Great Trade !

A PICTURE OF THE SURPOSE BULLISH MOVEMENT As analyzed in my previous poste , we had some quick fakes outs but the direction was confirmed to be bullish.
as we see we hope to ride it to the TF
THE TREND IS YOUR FRIEND

7/24/25 - $deck - Imagine not buying this... AH7/24/25 :: VROCKSTAR :: NYSE:DECK
Imagine not buying this... AH
- amazing to listen to the mental degradation of "sell side analysts".
- the quarterly ritual when real shareholders must endure management answering the room temperature IQ questions from these "research" providers is a circus
- right now there's a sell side "analyst" demanding an explanation for how 1 + 1 = 2. "put some meat on the bone" he says
- then he interrupts
- it's really amazing the way Elon handles these retards, i wish more mgmt teams would simply tell these folks the truth
- but alas
results is a smash. forget the minutia
- big revenue beat
- key brands growing (lol NYSE:NKE is not even growing and trades 2x multiples)
- buying back shares
- DTC is a tailwind
so weird AH action to see +15-20% then retrace to +2%
i'll be sizing this up and will respond tmr/ what i'm deciding. will be taking the 6x leverage on 1% 6mo ITM leverage to probably 2-3x leverage on 18 mo (jan '27) expires and targeting a gross of ~10%.
be well. enjoy.
V

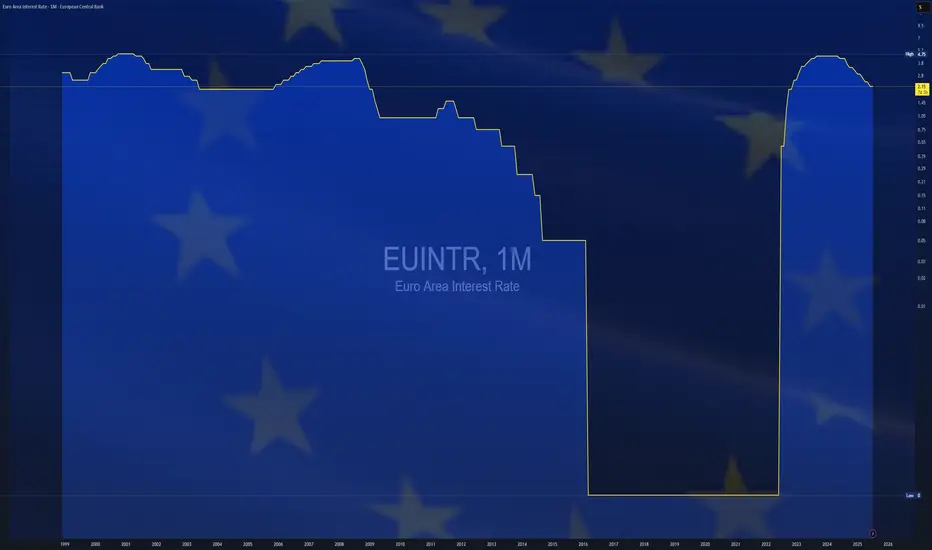
$EUINTR - Europe Interest Rates (July/2025)ECONOMICS:EUINTR
July/2025
source: European Central Bank
- The ECB kept interest rates unchanged in July, effectively marking the end of its current easing cycle after eight cuts over the past year that brought borrowing costs to their lowest levels since November 2022.
The main refinancing rate remains at 2.15%, while the deposit facility rate holds at 2.0%. Policymakers struck a wait-and-see stance, as they evaluate the impact of lingering trade uncertainty and the potential fallout from proposed US tariffs on economic growth and inflation.
Inflation hit the ECB’s 2% target in June, adding to the case for a pause in policy adjustments. Speaking at the ECB press conference, President Lagarde said the central bank is “in a good place” but acknowledged the difficulty in assessing how tariffs will affect price outlooks, given the mix of both inflationary and disinflationary pressures.
On the recent euro appreciation, Lagarde reiterated that the ECB does not target exchange rates directly but considers them when forecasting inflation.
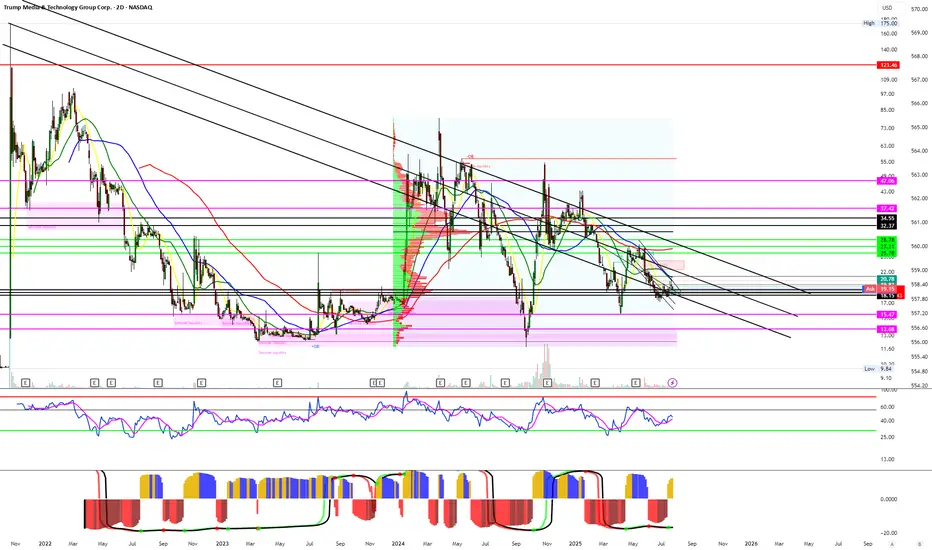
$47 for Mr. 47th himself? TA aside, fundamentally its a no brainer. No matter how much you hate him, there is no reason a stock that has half of its market cap ($2 Billion) in CRYPTOCAP:BTC should stay at the market cap of $5 Billion.
Next time there is a pump rally in Bitcoin, this thing will join in on the fun.
$47 is not unrealistic. That would set the stock at around a $10-$15 Billion Market Cap value.
REMX Long - Buy and hold tradeThe price of ETF REMX is increasing fast on high volume. This is one of the best signs to buy. In this situation I prefer a buy and hold trade. Just my personal view - no financial advice!

Bitcoin, SPX, Ethereum, Tesla: Whats Next? BTC appears to be showing distribution signs.
I do believe BTC local top is in, but alt coins like Ethereum can still push a bit higher.
Ethereum short around 3900-4000 looks promising
Tesla fell sharply on the back of cash flow burn and expenditures.
Investors are also fearful of sales decline and loss of EV credits.
SPX hit major long term resistance today. Coupling this with a depressed Vix we are likely setting up for a pullback in the market.
Small caps saw distribution today on the back of rising yields. A failed breakout observed on IWM chart.

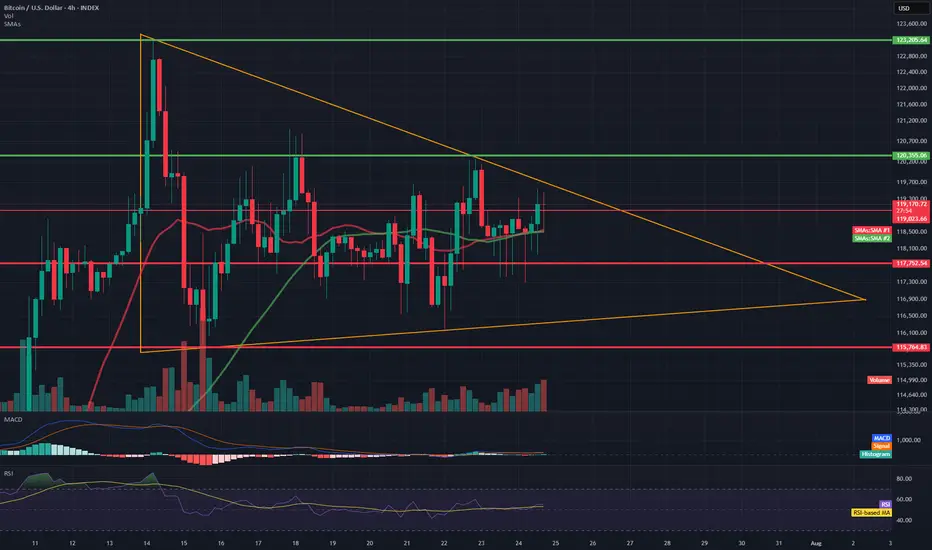
BTC/USD 4H Chart Review📊 Technical Structure (Symmetrical Triangle)
Formation: The symmetrical triangle (orange lines) remains intact—price continues to move within it.
Approaching the apex: The closer to the intersection of the triangle's arms, the greater the probability of a breakout. The current candle is testing the upper boundary of the formation (around $119,300), but has not yet broken it.
Direction: The formation is neutral, but tension is increasing. A breakout of either line (the upper boundary ≈$119,500 or the lower boundary ≈$117,700) could trigger a dynamic move with a range of around $3,000 (the height of the triangle at its widest point).
🧱 Support and Resistance Levels (Red and Green Lines)
Type Level (USD) Description
Resistance 123205 All-Time High – Possible Target After an Upward Breakout
Resistance 120556 Local Resistance – Triangle Breakout Range
Resistance 119200–119300 Currently Tested Level
Support 117752 Lower Triangle Boundary – Critical Defense Line
Support 115764 Next Local Support
📈 Technical Indicators
🔵 RSI (Relative Strength Index)
Currently: ~55 – indicates a neutral situation, having broken down from the overbought level (~74).
Indicates that the market has temporarily cooled down after a previous impulse. There is still room for further upward movement without exceeding 70.
🔵 MACD
The MACD and signal lines are approaching a crossover – if the MACD crosses the signal line upward, it could be a bullish signal.
The histogram is slightly positive – indicating weak but growing bullish momentum.
📊 Volume
Slightly increasing in the last candles – no confirmation of a strong breakout yet, but upward pressure is building.
🧠 Interpretation
Scenario Technical Conditions Movement Objective
🔼 Upward Breakout
Candlestick close above $119,500 USD 122,000–$123,200 USD
🔽 Downward Breakout
Close below 117,750 and confirmed by volume at 115,700, then 114,000 USD
🔄 Consolidation
Inconclusive, continued sideways movement
Between $117,700 and $119,500 USD
✅ Summary
Bitcoin is still in a neutral symmetrical triangle formation but is approaching a turning point.
The RSI has broken out of the overbought range, and the MACD is signaling a potential upside breakout.
Volume confirmation is still lacking, but technical conditions favor the bulls – if it manages to break above 119,500 and hold above, a move towards 122,000–123,000 USD can be expected.
In the event of a rejection, maintaining 117750 will be key; breaking it opens the way to 115700 and below.
ITDC - LongITDC rounding bottom base completed aND ready to move up.
Volume has contracted as well. Very less daily volume.
Strong promoter holding.. govt holding
New ITDC director has come, so she will bring changes.

Why a USD Bounce Could Trigger a Stock PullbackThe US Dollar has faced brutal selling during the first half of 2025. Some are even questioning whether the Dollar’s global hegemony is at risk. Early in the year the US stock market AMEX:SPY sold off aggressively, falling 19% from mid‑March to early April. Since then stocks have more than regained their losses and the Dollar is still in the tank. So where does that leave us for the rest of the year?
The Dollar Inverse Correlation
The US Dollar has an inverse correlation to most everything. Stocks, bonds, crypto, commodities, real estate — all are measured in Dollars. Therefore when the Dollar loses value, all things equal it takes more of them to reach the same value those assets were denominated at before. Conversely when the Dollar rises, other assets lose value in Dollar terms. Here we can see a long standing inverse correlation to stocks AMEX:SPY
Dollar in oversold territory
The Relative Strength Index (RSI) is a momentum oscillator that measures the magnitude of recent price changes on a scale from 0 to 100 to help identify overbought (above 70) or oversold (below 30) conditions. The Dollar has hit oversold several times so far this year, but not yet staged a material recovery.
Stocks in overbought territory
Meanwhile stocks have staged a blistering rebound off the "Liberation Day" driven selloff earlier this year. The S&P 500 now sits at an all‑time high, and you guessed it, has tapped overbought twice this month.
USD is fundamentally attractive
Because investors seek to earn the highest available yield on their capital, they tend to move funds into currencies offering higher interest rates (and away from those with lower rates), so differences in policy rates across countries create incentives for cross‑border borrowing and lending that drive FX flows. For example the Fed ( ECONOMICS:USINTR ) is at 4.5%, and the ECB ( ECONOMICS:EUINTR ) is at 2.15%. Moreover the Dollar is down significantly against major trading pairs that have lower yields. In our prior example the Dollar is down 11.98% against the Euro YTD (1- FX:EURUSD ), leaving substantial room for capital gains. Gravity could lure FX traders back in the second half of 2025.
Tariff calculus
Tariffs tend to bolster the imposing country’s currency in two main ways: by making imports more expensive they reduce import volumes, improving the trade balance (i.e. fewer foreign‑currency outflows), and by collecting duties in domestic currency the government effectively withdraws that currency from circulation, increasing its relative scarcity. Both effects lift demand for—and support the value of—the home currency.
Putting it all together
Despite the TVC:DXY ’s ~10.8% YTD slide and repeated oversold conditions, the compelling carry trade sets the stage for a USD bounce that, in turn, could pressure overextended equities. With stocks stretched and the Dollar oversold, the carry‑driven rebound in USD could well presage a pullback in equities. Stocks are expensive, Dollars are cheap 🤑

Nike - This is the bottom!💉Nike ( NYSE:NKE ) creates the bottom now:
🔎Analysis summary:
More than four years ago, Nike created its previous all time high. We have been witnessing a downtrend ever since and a correction of about -70%. But with the recent retest of an important horizontal structure and bullish confirmation, Nike is about to create a potential bottom.
📝Levels to watch:
$65, $80
🙏🏻#LONGTERMVISION
Philip - Swing Trader

