$WIFWhen your projections are respected, you feel nothing but joy.
Everyone’s joy as a trader is to spot this good moments and enjoy the ride as much as you can.
A successful trader is one who feasts on his spotted opportunity and milk as much as he can.
This trade presented 3 smooth opportunities so far and we will wait patiently to see what happens next. It could repeat same pattern or breakout. If a breakout occurs, more feasting. If it breaks downward, the sweeter.
#DYOR #NFA
Fundamental Analysis

Btc.D Broke supportBitcoin dominance has broken its range and support level to the downside. The Altcoin Index has risen from 12 at the end of June to 24, indicating a potential reversal. Meanwhile, Bitcoin has just broken its all time high. This could suggest that retail money is starting to flow into altcoins, leading me to predict an upcoming altseason.
Best of luck to all.

Gold (XAUUSD) Analysis : Bullish Structure Setup + Target🧠 Gold (XAUUSD) Technical Analysis
Gold has recently been trading within a clearly defined descending channel, which has governed price action over the past several sessions. This structure is characterized by a series of lower highs and lower lows, forming well-established channel resistance and channel support levels. However, recent bullish pressure has led price to aggressively test the upper boundary of this channel, signaling the potential for a structural breakout.
We are now at a technical inflection point, where a successful breakout and retest could mark the beginning of a significant trend reversal and short-to-medium term bullish move.
🔍 Key Technical Levels & Zones
🔷 Channel Resistance (~3,325)
The price is currently testing the descending trendline acting as channel resistance.
This area has previously rejected price several times, increasing its significance.
A confirmed break and close above this level may shift the market bias from bearish to bullish.
🔷 Central Zone – Dual Demand (~3,325–3,330)
This horizontal zone intersects with the channel resistance and aligns with two previous demand zones, now acting as a key decision area.
The market must validate this zone as new support before any sustained upward movement can occur.
🔷 Next Reversal Zone – Target (~3,370)
The next major area of interest lies around 3,370, a zone identified by previous swing highs and visible liquidity pools.
This level is likely to act as a magnet for price if bullish structure is confirmed.
📈 Price Structure Outlook
The potential breakout is supported by a strong bullish impulse off the channel support, followed by a series of higher lows suggesting growing bullish momentum. The projected movement scenario is as follows:
Break above the channel resistance
Retest and confirm the central zone as support
Continuation toward the 3,370 reversal zone
This would complete a classic break–retest–continuation pattern.
✅ Trade Considerations (Not Financial Advice)
Entry Type Entry Condition Target Stop Loss
Aggressive Break & 2H close above 3,330 3,370 Below 3,320
Conservative Retest & bullish confirmation above 3,325 3,370 Below 3,310
Risk Management:
Use position sizing aligned with your risk tolerance (max 1–2% per trade).
Monitor volume closely during breakout and retest for confirmation.
⚠️ Invalidation Scenario
If price fails to break above the channel and is rejected strongly, especially with a bearish engulfing or long upper wick, the downside could resume. In such a case, price may revisit the channel midline or even the lower boundary around 3,290.
📝 Summary
Gold is at a critical juncture, testing long-standing channel resistance.
A break above and successful retest of the 3,325–3,330 zone could lead to a rally toward 3,370.
This setup reflects a potential shift in structure from bearish to bullish on the 2H timeframe.

IBEX 35: Summer Rally or Final Top?By Ion Jauregui – Analyst at ActivTrades
Consolidation and Vertigo at Peak Levels
In 2025, the IBEX 35 has staged a moderate yet consistent rally, reaching levels not seen since 2015, recently hitting 14,373 points. After a strong start to the year, fueled by the stabilization of interest rates in the eurozone and a recovery in the banking sector, the index has been consolidating within a sideways-upward channel. This consolidation phase has acted as a pause after the significant gains accumulated since October 2023, when the index hovered near the 9,000-point mark. However, the current high zone represents a technically demanding barrier. If broken, it could pave the way for one final upward move before a potential correction.
Last Push Before the Turn
Fundamental Analysis
The performance of the IBEX 35 in 2025 has been mainly supported by solid corporate earnings, particularly within the financial sector, which continues to benefit from the elevated interest rate environment. Banks have reported robust interest margins, playing a key role in driving the index higher. Additionally, defensive stocks like Iberdrola, Endesa, and Naturgy have provided stability amid persistent macroeconomic uncertainty.
However, growth forecasts for the Spanish economy are beginning to be revised downward, and persistent core inflation casts doubt on the ECB's ability to cut rates swiftly. Thus, although the base scenario still favors a continued recovery, risk factors are starting to build, which could impact the index’s trajectory in the second half of the year.
Furthermore, regulatory changes in regions such as Catalonia concerning the housing sector are affecting rental companies and platforms like Airbnb in cities like Barcelona. Tensions between the Ministry of Transport and construction companies are also mounting over the planned reversal of concession contracts for 11 first-generation motorways, spanning nearly 1,000 kilometers—a dispute that could end up in court. Publicly traded firms involved include Abertis, Acciona, ACS, Ferrovial, and FCC.
Technical Analysis
From a technical standpoint, the IBEX 35 is trading within a sideways-upward channel that has served as a consolidation phase since May, following a strong rally that began in late 2023. The upper resistance of this channel is around 14,373 points, while the lower boundary extends to 13,615 points, acting as the main support level. As long as the index remains above this threshold, a breakout to the upside remains plausible.
Currently, the point of control is showing bearish delta pressure just above, suggesting that the July 7th upward move is holding above the 13,930-point area. This level coincides with the 50-day moving average, which indicates that the price may still have bullish momentum and could attempt one last summer rally.
However, if this level is breached, the upward move may be limited, especially since trading volumes have remained relatively stable. The RSI is slightly overbought at 60.79%, and the MACD is trending above its signal line—pointing to a potential buy signal and continued upward movement.
In this context, investors should closely monitor the upcoming sessions: a clear breakout above resistance could trigger fresh buying, but failure to overcome the congestion zone could increase the likelihood of a deeper corrective phase.
Portfolio Rotation? Alternative Markets to Watch
With the IBEX 35 hovering near relative highs and showing potential long-term exhaustion signals, some investors may consider rotating toward markets with greater upside potential:
EuroStoxx 50: Still has room to set new annual highs. As long as it holds above 5,200 points, it remains in an upward channel. A breakout above 5,430 could trigger a new rally.
Chinese markets (CSI 300 / China A50): The index recently reached new yearly highs, breaking above levels not seen since December 2024. Despite structural economic weaknesses, government stimulus could support short-term momentum. It’s worth noting that while the China A50 index has a slight bullish bias, it has remained range-bound since October last year. Being composed of the country’s top companies, this might reflect a more subdued economic reality compared to the more volatile CSI 300.
Tech indices (Nasdaq 100): Easing bond yields in the U.S. and strong tech earnings could continue to support the Nasdaq, particularly in a growth-seeking environment.
Commodities and emerging markets: With a potential correction in Europe, investors may also consider real assets and more cyclically sensitive markets such as Latin America or emerging Asia.
*******************************************************************************************
The information provided does not constitute investment research. The material has not been prepared in accordance with the legal requirements designed to promote the independence of investment research and such should be considered a marketing communication.
All information has been prepared by ActivTrades ("AT"). The information does not contain a record of AT's prices, or an offer of or solicitation for a transaction in any financial instrument. No representation or warranty is given as to the accuracy or completeness of this information.
Any material provided does not have regard to the specific investment objective and financial situation of any person who may receive it. Past performance and forecasting are not a synonym of a reliable indicator of future performance. AT provides an execution-only service. Consequently, any person acting on the information provided does so at their own risk. Political risk is unpredictable. Central bank actions can vary. Platform tools do not guarantee success. Regulated status does not guarantee security.

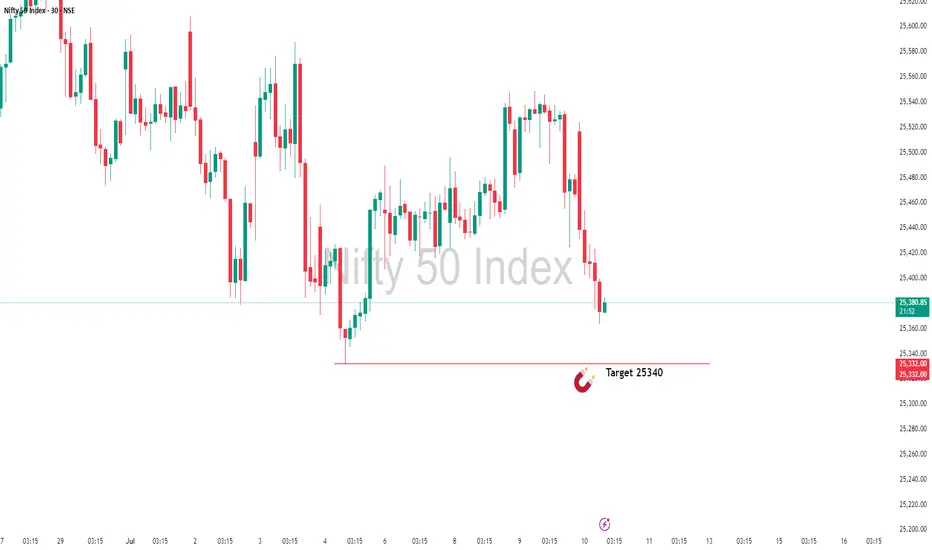
Almost There: Nifty Closing in on My Target Zone 25340In this update, I’m revisiting the setup I shared earlier that points towards NIFTY’s next potential target at 25,340. The analysis covers the key levels, price action structure, and the factors supporting this move. This setup is based on clear technical confirmations and disciplined risk management — not just speculation.
Please remember to follow your own plan and manage your trades responsibly. This is for educational purposes and not financial advice. Let’s see how the price action unfolds!
GOLD SELL SETUPAfter a strong bullish move, price approached a key resistance zone near the 3325–3330 level, which coincides with a potential supply zone created by previous price rejection. The market structure showed signs of slowing momentum, with multiple wicks to the upside and smaller-bodied candles near resistance, indicating possible exhaustion of buying pressure.

5-Step BTC Masterplan: High-Conviction Swing Trades Until Jan 26Hey Traders! 👋
I’ve built a multi-phase #Bitcoin trading strategy based on historical highs/lows and key confluence levels (trend + Fibonacci). If you're looking to ride #BTC’s volatility with clear direction and logic — this plan is for you!
💡 No overtrading. No leverage needed. Just strategic entries and patience.
👇 Check out the roadmap:
✅ 1st Move: Long #BTC — Starting NOW!
📅 Date: 9-May-25
📈 Entry: Current Market Price (CMP)
🎯 TP: 113,800
❌ SL: None (spot only)
🧠 Logic: Early breakout zone targeting resistance.
🚨 2nd Move: Short Setup
📅 Date: 15-Jul-25
📈 Entry: 113,000
🎯 TP: 80,800
🛑 SL: 121,000
🧠 Logic: Major resistance + likely correction.
✅ 3rd Move: Buy the Dip
📅 Date: 15-Oct-25
📈 Entry: 81,800
🎯 TP: 92,500
🛑 SL: 73,000
🧠 Logic: Retest of long-term support.
🚨 4th Move: Short Again
📅 Date: 2-Dec-25
📈 Entry: 91,800
🎯 TP: 61,850
🛑 SL: 101,000
🧠 Logic: Lower high, macro pullback likely.
✅ 5th Move: The Final Long!
📅 Date: 1-Jan-26
📈 Entry: 62,100
🎯 TP: 119,500
❌ SL: None (spot only)
🧠 Logic: Long-term support & trend reversal.
📊 This is not financial advice — just one trader’s structured roadmap.
🧠 Let the chart tell the story — emotions off, plan on.
💬 What do YOU think? Which move are you most aligned with? Drop your thoughts below!
👍 Like if this helped. 🔔 Follow for real-time trade updates & deeper analysis!
#BTC #Bitcoin #CryptoTrading #SwingTrade #TechnicalAnalysis #TradingPlan #Fibonacci #TrendReversal #HODL #BearTrap #BullTrap #Altcoins #CryptoStrategy #LongShort #SpotTrading


NIFTY Eyes 25,410: Setup in ActionIn this update, I’m revisiting the setup I shared earlier that points towards NIFTY’s next potential target at 25,410. The analysis covers the key levels, price action structure, and the factors supporting this move. This setup is based on clear technical confirmations and disciplined risk management — not just speculation.
Please remember to follow your own plan and manage your trades responsibly. This is for educational purposes and not financial advice. Let’s see how the price action unfolds!

USDJPY Short Setup – Supply Zone Reaction After Structure Break After a clear break of structure (BOS) to the downside around the 145.92 level, USDJPY entered a retracement phase and is now retesting the supply zone created by the last bearish move. This area overlaps with the previous support turned resistance, as well as the dynamic resistance of the moving average, which strengthens the confluence.
We also had a Change of Character (CHOCH) earlier in the structure, marking a shift in momentum from bullish to bearish. The current price action has formed a lower high beneath the supply zone, suggesting that sellers are likely to defend this area.
I'm now watching for rejection signs from this 146.25–146.35 zone, which could confirm the bearish continuation. If price fails to break above this supply and shows weakness (e.g., bearish engulfing or long-wick rejections), I’ll look for entry opportunities to short.
Target:
The first short-term target is a move back to the BOS level at 145.92
A break below that could open the path to 144.09, the next significant support and previous demand zone
Summary:
This setup is based on classic smart money concepts: BOS, supply zone reaction, and a structural lower high. I’ll remain bearish unless the supply is broken cleanly with strong bullish momentum.

Why Your Orange Juice Costs More?The price of orange juice is surging, impacting consumers and the broader economy. This increase stems from a complex interplay of geopolitical tensions, macroeconomic pressures, and severe environmental challenges. Understanding these multifaceted drivers reveals a volatile global commodity market. Investors and consumers must recognize the interconnected factors that now influence everyday staples, such as orange juice.
Geopolitical shifts significantly contribute to the rising prices of orange juice. The United States recently announced a 50% tariff on all Brazilian imports, effective August 1, 2025. This politically charged move targets Brazil's stance on former President Jair Bolsonaro's prosecution and its growing alignment with BRICS nations. Brazil dominates the global orange juice supply, providing over 80% of the world's trade share and 81% of U.S. orange juice imports between October 2023 and January 2024. The new tariff directly increases import costs, squeezing margins for U.S. importers and creating potential supply shortages.
Beyond tariffs, a convergence of macroeconomic forces and adverse weather conditions amplify price pressures. Higher import costs fuel inflation, potentially compelling central banks to maintain tighter monetary policies. This broader inflationary environment impacts consumer purchasing power. Simultaneously, orange production faces severe threats. Citrus greening disease has devastated groves in both Florida and Brazil. Extreme weather events, including hurricanes and droughts, further reduce global orange yields. These environmental setbacks, coupled with geopolitical tariffs, create a robust bullish outlook for orange juice futures, suggesting continued price appreciation in the near term.

DAX (Ger40): Defying Global TensionsDespite all this tariff drama, the DAX hit another record high. What gives? Markets seem to be betting that Trump enjoys the threat of tariffs more than the implementation. Some traders are pricing in yet another extension beyond the August 1 deadline.
The DAX is riding momentum from both global AI enthusiasm, thanks to Nvidia’s $4 trillion market cap milestone, and the assumption that European exporters might dodge the worst of Trump’s trade penalties, at least for now. However, this rally is precarious. If a tariff letter hits Brussels, or copper tariffs ripple into industrial demand expectations, we could see a swift correction.
Technically, near term resistance is sitting around. 24,700. However as stated, should sentiment change. A correction back down, to the support level at 24,200, which also aligns with the 50 Fibonacci retracement level, could be on the cards. Or even all the way down to 23,800, aligning with the 88% Fibonacci level.


LTCUSDThe LTC/USDT pair currently trades at $74.77, positioning itself for notable bullish movements across various timeframes. In the near term, price targets are set around $90.00, reflecting immediate upside potential supported by strong technical signals and market dynamics.
Looking ahead to the medium term, targets extend to the range of $100.00 to $110.00. This forecast is underpinned by robust momentum indicators and bullish patterns suggesting sustained upward momentum.
For the long term, LTC/USDT could aim for $120.00, driven by favorable market conditions and ongoing adoption within the cryptocurrency ecosystem. Further out, targets expand to $150.00 to $180.00 by Q4, illustrating significant growth prospects backed by historical price trends and extended Fibonacci levels.
Investors and traders are advised to monitor key technical indicators, such as the moving average convergence divergence (MACD) and relative strength index (RSI), which affirm bullish sentiment and potential price appreciation. Risk management strategies should be implemented to navigate market volatility and optimize entry points aligned with support levels.
Continued vigilance on market developments and regulatory factors impacting cryptocurrencies will enhance decision-making processes and support strategic investment decisions

XAGUSD
Silver Outlook: Bullish with Potential Upside
Current Price: $30.24
Anticipated Targets: $33.00 - $36.00 - $39.00 - $40.00+++
Rationale:
Silver (XAG/USD) appears poised for significant upside potential in the coming months. Several technical indicators support this bullish view. The Relative Strength Index (RSI) has shown a strong uptrend, indicating increasing buying momentum. Additionally, the Moving Average Convergence Divergence (MACD) has crossed over into bullish territory, further affirming positive sentiment.
Risk Disclaimer:
Trading Forex and commodities involves substantial risk and may not be suitable for all investors. Past performance is not indicative of future results. It's important to carefully consider your financial situation and consult with a qualified financial advisor before making any investment decisions.
Conclusion:
Given the technical indicators and current market sentiment, I believe silver is positioned for a potential rally towards $33.00, $36.00, $39.00, and possibly beyond $40.00 in the coming months. Traders should monitor price action closely and manage risk appropriately.

Trump blasted Powell again. Interest rates remain unchanged.Information summary:
Trump blasted Powell on Wednesday, saying that the current interest rate is "at least 3 percentage points higher" and once again accused Fed Chairman Powell of "making the United States pay an extra $360 billion in refinancing costs each year." He also said that "there is no inflation" and that companies "are pouring into the United States," and urged the Fed to "cut interest rates."
During the U.S. trading session, gold also showed a significant rebound momentum, rebounding from a low of 3285 to above 3310 in one fell swoop. As of now, gold has stood above 3320.
Market analysis:
From the daily chart:
It can be seen that the first suppression position above gold is currently at 3325, followed by around 3345. Gold did not close above 3320 on Wednesday, which means that even if gold is currently above 3320, as long as today's daily line closes below 3320, it is still in a bearish trend. On the contrary, if the closing price today is above 3320, then the subsequent test of the suppression position near 3345 may be further carried out.
Secondly, from the 4-hour chart, the current suppression position above 4 hours is around 3330-3335. Therefore, today we should focus on this position. If we cannot stand firm and break through the range suppression here in the 4-hour chart, we may retreat again in the future. The key support position below is around 3310, which is the opening price today. If the price is to retreat, it is likely to fall below 3310. But it may also remain above 3310 for consolidation.
However, as long as it falls below 3310, I think the low point near 3285 may be refreshed, so pay attention to this.
Operation strategy:
Steady trading waits for 3310 to fall and break through to short, and the profit range is 3385 or even lower.
Aggressive trading can short near 3340, with a stop loss of 3350.

Gold (XAU/USD): Tugged Between Tariffs and Treasury YieldsGold is finding renewed interest from two forces: falling real yields and a cautious Fed. Despite the dollar’s strength, we’re seeing the yellow metal hold above $3,300. Treasury yields are sliding, and global central banks, especially China’s PBOC, are still net buyers of gold. The World Gold Council reported $38 billion in inflows to gold ETFs in the first half of the year, the highest in five years.
Technically, support remains stiff at the 50-day EMA ($3,305), with a ceiling at $3,340. If broken, $3,360 - $3,400 comes back into play. But failure to hold above $3,300 opens downside risk to $3,246, and possibly $3,185.

GBPUSD BUILDING TARGET GBP/USD Technical Analysis – 4H Timeframe (July 9, 2025)
This chart shows a technical analysis of the British Pound (GBP) versus the US Dollar (USD) on the 4-hour timeframe. The market is currently trading within a well-defined range, with a strong support zone (highlighted in purple) and a clear resistance level (marked in blue).
Key Levels:
Support Zone: 1.33700 – 1.34400
This zone has been tested multiple times and has acted as a strong demand area, where price has often reversed to the upside.
Current Price: 1.35991
The price is currently above the support zone but showing signs of bearish pressure.
Resistance / Target Point: 1.37921
This level has acted as a strong resistance in the past. If the price reverses from the support zone, this is the likely target point.
Analysis Summary:
The price is expected to drop down toward the support zone around 1.34000.
A bullish reversal is anticipated from this area.
If the reversal happens, the price may rally toward the target level at 1.37921.
Trading Perspective:
Buy Zone: Around 1.34000 (within the purple support box)
Target Zone: Around 1.37921
Suggested Stop-loss: Just below the support zone (e.g., around 1.33500)

USD/JPY: Still a Safe-Haven Tug of WarUSD/JPY had surged past 147 on the back of Trump’s tariff letter to Japan—but quickly pulled back as risk appetite stabilized and Treasury yields softened. Price action now sits around the low-146s.
Technically, the 100-day SMA is providing key support just below 146.00. If bulls hold this level, we could see another push toward 147.20–148.00. On the downside, any surprise from upcoming Fed speakers or Japanese trade negotiations could send the pair testing the 144.00 zone again. Traders are watching Osaka closely, U.S. Treasury Secretary Scott Bessent is expected to meet Japanese officials at the World Expo, which could shape sentiment fast.

Fundamental Market Analysis for July 10, 2025 GBPUSDEvent to watch today:
15:30 EET. USD - Initial Jobless Claims
GBPUSD:
The British pound remains under pressure amid increased risk-off sentiment linked to new White House statements about additional tariffs from August 1. This is boosting demand for the US dollar as a safe haven and prompts investors to take profits on long GBP positions.
Domestic factors in the UK also have a negative impact: revisions to social spending programs and weak manufacturing PMI and retail sales data signal a slowdown in economic activity. The Bank of England is expected to keep the rate at 5.50% until year-end, which limits the pound’s attractiveness for investors.
The current GBP/USD rate is 1.35900. In the absence of positive drivers from the UK economy and persistent demand for the dollar, the pair remains vulnerable to further declines toward 1.3520.
Trade recommendation: SELL 1.36000, SL 1.36300, TP 1.35200

The trend continues for EURUSDYesterday, EURUSD once again tested the support level at 1,1683 and bounced off it.
The uptrend remains strong, and we are monitoring for its continuation.
All positions should align with the main trend.
Watch for the end of the current pullback as a potential buying opportunity.
The next resistance levels are 1,1813 and 1,1916!

Accumulation to Acceleration ESThis chart shows a long-term market analysis using Elliott Wave Theory, suggesting the market is currently in Wave 4 and preparing for a big Wave 5 rally.
📈 Past yearly moves averaged 15–21%, with 30%+ currently and up to 66% historically.
🟩 A "rebalance" zone (accumulation phase) is forming before a possible breakout.
📊 The next move projects a +60% rally, targeting 7,112 to 7,570.
🔁 Historical patterns and past rallies are being used to support this bullish forecast.
Bottom line: If history repeats, a strong upward move is expected soon.

EURUSD IDEAExpecting a retracement to the supply zone to either clear liquidity before falling or rise further to the Economist predicted level of 120 level
Like and follow for more ideas on the market
