EUR/USD: A High-Probability Short Setup at 1.1829At its core, this trade is driven by a powerful and growing divergence between the US and European economies. While technicals tell us where to trade, fundamentals tell us why we're trading.
1️⃣ The Interest Rate Gap: The U.S. currently offers significantly higher interest rates (4.25% - 4.50%) compared to the Eurozone (2.15%). This makes holding the US Dollar more attractive, creating natural downward pressure on the EUR/USD.
2️⃣ Central Bank Policy: The US Federal Reserve remains hawkish, focused on strength and fighting inflation. Meanwhile, the European Central Bank is dovish, signaling a willingness to keep conditions loose to support a weaker economy.
3️⃣ Labor Market Strength: The US enjoys a robust labor market with unemployment at just 4.1%, while the Eurozone's is significantly higher at 6.3%. This points to a stronger US economy.
In simple terms, the US economy is strong, and its central bank is acting like it. The Eurozone economy is weaker, and its central bank is acting accordingly. This fundamental imbalance is the fuel for a potential significant move down in EUR/USD.
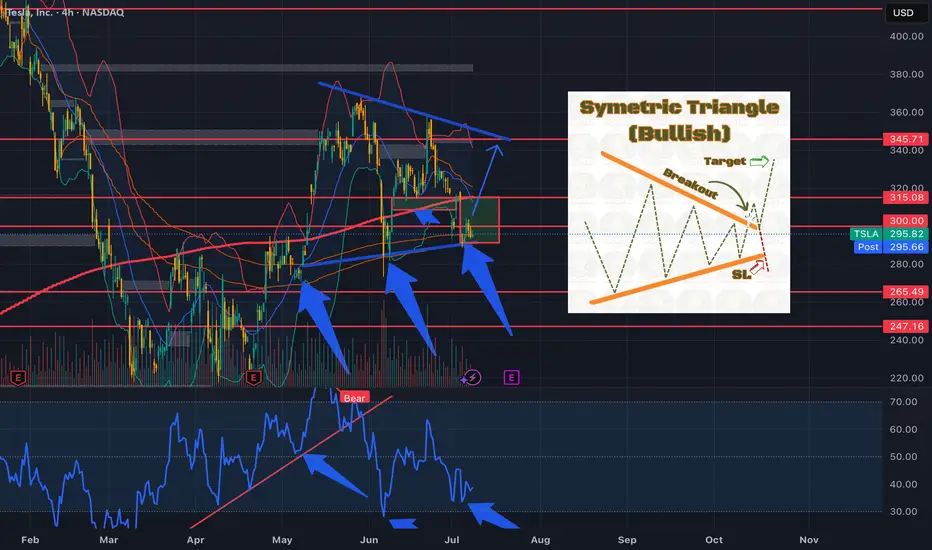
The Technical Picture: The Wall at 1.1829
As you can see on the 4H chart, the price has run into a major wall of resistance at the 52-week high of 1.1829 . After a long uptrend, the momentum has stalled, and the price is now consolidating inside a symmetrical triangle . This coiling of price action often precedes a strong breakout.
Our strategy is not to guess the breakout, but to act on a high-probability retest of resistance. We are looking to enter a short position as the price pulls back towards the upper boundary of this triangle, anticipating a failure at resistance and a subsequent break to the downside.
The Actionable Trade Plan
This setup offers an excellent risk/reward profile.
📉 Asset: EUR/USD
👉 Entry (Limit Sell): 1.1780
⛔️ Stop Loss: 1.1850
🎯 Take Profit: 1.1600
📈 Risk/Reward Ratio: ~2.57:1
Trade safe and manage your risk.
Fundamental Analysis


The risks of shorting at low levels have been informed!Today, I have reminded you many times not to chase short positions at low levels. Now you can see that gold has bottomed out and rebounded. We also bought gold in batches at 3285-3295, and the long positions also made perfect profits. I believe that friends who follow my articles can see that I have always emphasized not to short at low levels. It is also obvious to everyone that we bought long positions near 3295-3285. In the future, we will continue to pay attention to the suppression of the upper 3318-3325 line. If the rebound does not break, we will look for opportunities to short. I hope everyone can grasp the entry position and hold the profit. The rebound will first look at the previous break point of the 3325 line, and then short when the rebound is suppressed! If your current gold operation is not ideal, I hope I can help you avoid detours in your investment. Welcome to communicate with me!
From the current analysis of gold trend, today's upper short-term resistance focuses on the hourly top and bottom conversion position of 3318-3325. The intraday rebound relies on this position to go short once and look down. The lower short-term support focuses on 3280. The overall support relies on the 3280-3325 area to maintain the main tone of high-altitude low-multiple cycles. In the mid-line position, keep watching and do less, be cautious in chasing orders, and wait for the opportunity to enter the market after the key points are in place.
Gold operation strategy: short gold rebounds near 3318-3325, target 3305-3295.

USDJPY (daily Update) 10/07/2025hi everyone, the daily update video is up. couple areas of interest short term we are short couple areas of interest on the short term. hope the video helps. have a great day.
Happy trading

BTC is sitting on a volcanoStrong resistance at 110k and things couldn't get hotter for BTC esp. with the President pumping it and profiting from all of this (ethics 101). Let's recap: yields going up, economy is cooling (S&P going up for a week is not a reflection of things getting better), high interest rates, ultra high historical multiples, tariffs and higher debt, which are inflationary are all in front of us. This is not sustainable, a correction will happen very soon and people could get wiped out.
Always do your own due diligence and best of luck! Profit takers and crypto bros will start selling real soon, just like every other time before.

DIYWallSt Trade Journal: Starting Down $400 & Patience Pays Off 07/09/25 Trade Journal, and ES_F Stock Market analysis
EOD accountability report: -271
Sleep: 4.5 hours
Overall health: Good
VX Algo System Signals from (9:30am to 2pm) 4/4 success
10:00 AM VXAlgo ES X1 Sell Signal
10:36 AM VXAlgo ES X3 Sell Signal
11:00 AM Market Structure flipped bearish on VX Algo X3!
1:33 PM Market Structure flipped bullish on VX Algo X3!
What’s are some news or takeaway from today? and What major news or event impacted the market today?
I took some short positions overnight and got caught in the big push up this morning and started the day with -400, I was very tempted to go big and tried to trade it back but decided it was better off just to wait for a better day to recover the account instead.
Consider yesterday was a big manipulation day and today was another one but squeezing to the upside for a rug pull downwards.
News
*(US) FOMC JUN MINUTES: COUPLE OF PARTICIPANTS NOTED THEY WOULD BE OPEN TO CONSIDERING A RATE CUT AS SOON AS THE JULY MEETING IF DATA EVOLVE AS THEY EXPECTED (Bowman and Waller have said as much since the FOMC meeting)
What are the critical support levels to watch?
--> Above 6290= Bullish, Under 6280= Bearish
Video Recaps -->https://www.tradingview.com/u/WallSt007/#published-charts

Short oppurtunity for ETHShort Opportunity on Ethereum (ETH)
Ethereum has recently failed to reclaim key resistance near \$2,800 and is showing signs of renewed bearish momentum. A brief pullback toward \$2,705 is likely before any meaningful bounce back to retest \$2,800. This setup offers a shorting opportunity with defined risk and reward.
Technical Rationale
Resistance at \$2,800 : Price has been unable to close convincingly above this level on multiple attempts, indicating strong overhead supply.
Bearish Momentum : Recent lower highs on the 4-hour chart and a break of the short-term uptrend line suggest sellers are in control.
Support Target at \$2,705 : The next logical area where buyers may step in confluence of the 50-period moving average (4h) and prior swing low from late June.
Outlook
If ETH reaches \$2,705 and shows bullish signs (hammer or bullish divergence on RSI), expect a retest of the \$2,800 area. Conversely, a decisive break below \$2,705 could open the path to \$2,650 and lower. Adjust your plan accordingly based on how price behaves around these key levels.
Disclaimer : Always conduct your own due diligence and size positions according to your risk tolerance. Markets can be unpredictable, use proper risk management.

Ethereum Faces the 'Symplegades'– Will Pectra Propel It Through?Ethereum Faces the 'Symplegades' – Will Pectra Propel It Through?
⚔️🪨 Ethereum Faces the 'Symplegades' – Will Pectra Propel It Through? 🪨⚔️
In ancient Greek myth, the Symplegades — Clashing Rocks — tested Jason and the Argonauts with a narrow, deadly passage. Today, Ethereum faces its own mythic trial as price action presses into a critical zone.
📍 The $2,805–$2,848 resistance zone is acting like the Clashing Rocks — volatile, dangerous, and decisive. Beneath it, support rests near $2,616 and $2,565 . A breakout from this trap can open the way to $3,200+ , but rejection may mean another violent plunge. ⚠️
🔧 Enter: PECTRA – Ethereum’s Game-Changing Upgrade
Ethereum’s most ambitious upgrade since The Merge is nearly here. PECTRA isn’t just a backend update — it redefines how the network feels and functions:
🧠 Smarter Wallets
– Batch transactions
– Skip approval popups
– Pay gas in any token
⚡ Frictionless UX
– Fewer clicks
– No more endless “approve + confirm” loops
📉 Cheaper Transactions
– More blobs = better L2 scaling
– Lower fees, even during congestion
🌱 Staking Overhaul
– Validator cap raised to 2048 ETH
– Smart contract withdrawals
– Faster deposit recognition
🔓 Unlocking $490B in trapped value
– Assets become more accessible and usable
“The Merge changed how Ethereum works.
Pectra changes how it feels. ” – @ethereum
⛵ Will ETH Break Through the Clashing Rocks?
This is not just another consolidation box.
It’s a moment of mythic symmetry — where price action, fundamentals, and network transformation converge.
Sail through the Symplegades... or get crushed between them?
Stay sharp. Watch the breakout. The next move will be defining.
One Love,
The FXPROFESSOR 💙

Bitcoin Strategic Breakout at the Threshold of Silence!⊣
⟁ BTC/USD - BINANCE - (CHART: 1D) - (Jul 09, 2025).
◇ Analysis Price: $110,767.80.
⊣
⨀ I. Temporal Axis - Strategic Interval - (1D):
▦ EMA9 - ($108,767.55):
∴ Price remains above the 9-day EMA, maintaining a short-term bullish posture;
∴ The moving average acts as dynamic support with positive slope.
✴️ Conclusion: Immediate trend remains intact, with momentum supported at $108,767.55.
⊢
▦ EMA21 - ($107,663.85):
∴ EMA21 acts as the structural support of the medium-term trend;
∴ Price maintains a healthy gap above it, confirming bullish continuity.
✴️ Conclusion: Structural integrity remains bullish - no threat of reversal below $107,663.85.
⊢
▦ Ichimoku Cloud - (Senkou A: $106,870.32 / Senkou B: $105,173.14):
∴ Price is clearly above the Kumo, with bullish Tenkan/Kijun alignment;
∴ Lagging Span (Chikou) is above both price and cloud - clean trend confirmation.
✴️ Conclusion: Primary trend remains bullish; cloud structure provides layered support between $106,800 and $105,100.
⊢
▦ RSI - ($61.33):
∴ RSI is rising, currently at 61.33, still below the overbought threshold;
∴ No divergence or bearish signal present; EMA9 of RSI is supportive at 56.94.
✴️ Conclusion: Momentum is healthy and climbing - room to extend toward the 70 level.
⊢
▦ MACD - (MACD Line: 251.71 / Signal Line: 836.26):
∴ Recent bullish crossover confirmed; histogram turning increasingly positive;
∴ MACD shows early-stage trend resumption with growing momentum.
✴️ Conclusion: Renewed bullish phase underway - MACD structure confirms sustained strength.
⊢
▦ Volume + EMA21 - (Current: 352.24 / MA: 244):
∴ Current daily volume significantly exceeds 21-day average;
∴ The breakout candle is technically validated by volume strength.
✴️ Conclusion: Real buying presence behind the move - not a hollow breakout.
⊢
🜎 Strategic Insight - Technical Oracle:
∴ All technical indicators are in alignment;
∴ Price is supported by volume, short-term EMA's, bullish Ichimoku structure, and clean RSI/MACD momentum;
∴ The price is approaching the (ATH - $111,317.37) and any confirmed close above it, backed by volume, could trigger a Fibonacci-based extension toward - ($115,000 / $117,300).
⊢
∫ II. On-Chain Intelligence - (Source: CryptoQuant):
▦ Exchange Inflow Total - (All Exchanges) - (13.4K Bitcoin):
∴ No abnormal spikes - inflows remain historically low.
✴️ Conclusion: Selling pressure is absent - no signs of miner or whale unloading.
⊢
▦ Exchange Reserve - (Binance) - (537.4K Bitcoin):
∴ Continuous outflow trend - reserves have declined sharply in recent weeks.
✴️ Conclusion: Structural supply contraction - classic hallmark of accumulation.
⊢
▦ Funding Rates - (All Exchanges)- (+0.006%):
∴ Slightly positive, well within neutral zone - no euphoria.
✴️ Conclusion: Leverage is present but controlled - not overheating.
⊢
▦ Open Interest - (All Exchanges) - (gradually increasing):
∴ OI rising gradually without abrupt spikes.
✴️ Conclusion: Positions are being built systematically - not impulsively.
⊢
🜎 Strategic Insight - On-Chain Oracle:
∴ The breakout is not driven by leverage, but rather by spot accumulation and institutional withdrawal;
∴ This environment mirrors previous (pre-expansion) phases (notably late 2020), when reserves declined and funding stayed flat;
∴ All vectors are aligned - a structurally sound rally is underway.
⊢
⧈ Codicillus Silentii - Strategic Note:
∴ The market exhibits complete silence beneath price - no inflows, no speculative buildup;
∴ Only those attuned to the deeper rhythm perceive the pressure building within this compressed structure;
∴ The Codex observes no disruptive anomalies; the energy is latent, not explosive - yet.
⊢
▦ Tactical Range Caution:
∴ Immediate Support: $108,767.55 - (EMA9);
∴ Structural Support: $107,663.85 - (EMA21);
∴ Previous ATH: $111,317.37;
∴ Breakout Extension Target: $115,000 - $117,300.
⊢
𓂀 Stoic-Structural Interpretation:
▦ Structurally Bullish - Tactically Confirming.
⊢
⧉
Cryptorvm Dominvs · ⚜️ MAGISTER ARCANVM ⚜️ · Vox Primordialis
⌬ - Wisdom begins in silence. Precision unfolds in strategy - ⌬
⧉
⊢

BTC Live: Resistance 111592/ Breakout soon or 109440 first?In this short video breakdown, we reviewed some key structural levels. We've identified a resistance at 111.592, which is critical for near-term price action. However, zooming out to the bigger picture, the major resistance to watch sits at 114.921 — this is a level we’ve respected many times before and could act as the next big test if momentum continues upward.
On the support side, we've previously leaned on 109.079, and we're now observing strong confluence zones thanks to our Fibonacci pull — notably around 110.505, lining up with the 0.61 and 0.5 retracement levels.
What we’re seeing is an ascending channel in play. If we break and hold above 111.592, that opens the door to challenge the 114.900 level. Until then, price might need to consolidate or retest some of these key supports.
Always worth checking past ideas to see how significant some of these zones have been historically. This wasn’t a fakeout — just part of the bigger structure.
Are you watching the same levels? Let me know your setups — it's always great to see different perspectives in the community.
One Love,
The FXPROFESSOR 💙
Disclosure: I am happy to be part of the Trade Nation's Influencer program and receive a monthly fee for using their TradingView charts in my analysis. Awesome broker, where the trader really comes first! 🌟🤝📈

MTH (Meritage Homes) – Position Trade Setup📈 Symbol: MTH (Meritage Homes)
📊 Timeframe: Daily Chart
📍 Strategy: Position Trade (Weeks to Months)
🎯 Trade Setup
Entry Zone: $74.00 (Current breakout level / near SMA 20)
Stop-Loss (SL): $65.74 (Below key support & SMA 50)
Take-Profit (TP): $92.70 (ATH Resistance & +25% upside)
Risk-Reward Ratio: 1:2.5
📊 Technical Analysis
✅ Trend: Strong uptrend (Higher highs & higher lows).
✅ Moving Averages: SMA 20 > SMA 50 (Bullish alignment).
✅ RSI (14): ~65 (Healthy momentum, no overbought signal).
✅ MACD: Bullish crossover & histogram expanding.
✅ Volume: Rising on upward moves (Confirms buying interest).
Key Levels:
Support: $70 (SMA 20), $65.74 (Strong Swing Low).
Resistance: $78 (Recent High), $92.70 (All-Time High Target).
💰 Fundamental Backing
Strong Financials: Low debt (Score 10), undervalued P/E & P/S ratios.
Revenue Growth: Steady performance in housing sector.
Institutional Interest: Increasing accumulation.
⚡ Trade Execution Plan
1️⃣ Entry: $74.00 (Break of consolidation).
2️⃣ Stop-Loss: $65.74 (Protects against trend reversal).
3️⃣ Take-Profit: $92.70 (Scale out partials at $78 and $85).
4️⃣ Trailing Stop: Adjust SL to breakeven at $78.
📌 Why MTH?
Strong sector outlook (Housing demand remains high).
Technically & fundamentally aligned for a multi-week rally.
Clear risk management with 1:2.5 RR.
🎯 Verdict: BUY MTH at $74, SL $65.74, TP $92.70.
🔔 Follow for more trade ideas!
👍 Like & Comment if you agree!
#TradingView #Stocks #MTH #PositionTrading #RealEstate #SwingTrading
(Disclaimer: Not financial advice. Do your own research.)

TSLA....Symetric Triangle....Earnings Rally?Could we see the bulls step in and leads us into earnings?
Valuation of the company's patentsThe company has 90 patents to date, each worth about $2 million at current market value, half the typical $5 million value of patents in this industry.

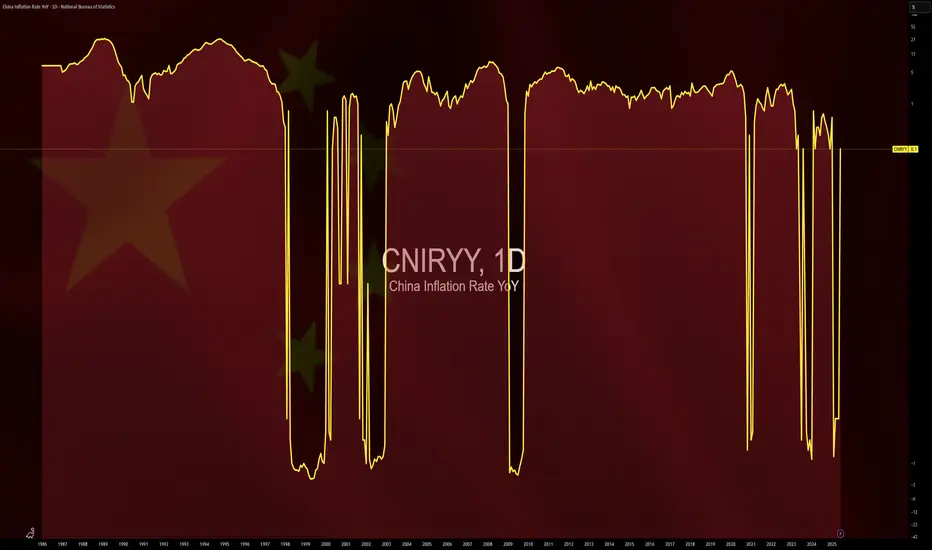
$CNIRYY -China's Inflation Data (June/2025)ECONOMICS:CNIRYY
June/2025
source: National Bureau of Statistics of China
- China’s consumer prices rose by 0.1% yoy in June 2025,
reversing a 0.1% drop in the previous three months and surpassing market forecasts of a flat reading.
It marked the first annual increase in consumer inflation since January, driven by e-commerce shopping events, increased subsidies for consumer goods from Beijing, and easing trade risks with the U.S.
Core inflation, which excludes volatile food and fuel prices, rose 0.7% yoy, marking the highest reading in 14 months and following a 0.6% gain in May.
On a monthly basis, the CPI fell 0.1%, after May's 0.2% drop, pointing to the fourth monthly decline this year.
Gap below… but copper’s breakout still in playCopper markets erupted higher this week following President Trump's proposal to impose a 50% tariff on copper imports. The price ripped from just above $5.20 to nearly $5.80 in a single 4-hour candle.
Now, copper could be forming a bullish flag or pennant on the 4-hour timeframe. After the vertical spike, price is consolidating in a tight, potentially downward-sloping channel between ~$5.45 and ~$5.60.
If confirmed with a clean breakout above the flag’s upper trendline - perhaps near $5.62—the next leg could project toward the previous high near $5.80
There’s also a gap below current price action, between $5.20 and $5.35, formed during the explosive move up. While gaps can act as support zones, they also tend to get revisited.

Gold Faces Fib Resistance and Channel Ceiling: Bearish ContinuatHey Traders,
Gold is testing a confluence of resistance levels around 3,322 – including the 0.618 Fibonacci retracement and descending channel resistance. Despite short-term recovery, price remains within a bearish structure, and sellers may re-enter at this zone unless a strong breakout occurs.
Current Market Conditions:
Price is respecting a clear descending channel and has now approached the upper boundary.
The 0.618 Fibonacci level near 3,322 aligns with horizontal resistance, creating a high-confluence sell zone.
Momentum has slowed on the way up, indicating potential exhaustion from bulls.
Unless 3,322 is broken decisively, the bearish structure remains intact.
Fundamental Analysis/Outlook:
Gold remains caught between conflicting macro forces. Hawkish Fed expectations and a strong U.S. dollar (DXY rebound) weigh on XAUUSD. However, mild safe-haven flows persist due to global geopolitical instability and slowing economic data from Europe and China. Today’s upcoming Fed commentary could tip the scales. A dovish tilt could weaken the dollar and favour upside; otherwise, downside may resume.
Targets:
TP1: 3,292.05
TP2: 3,259.41
TP3: Below - watch for Fib extension to around 3,240
Risk Management:
Stop-loss: Above 3,322.11 (channel and Fib invalidation zone)
Risk-to-Reward: Favouring minimum 1:2, scale in only on bearish confirmation (engulfing or rejection candles)
Technical Outlook:
This is a textbook bearish retest setup inside a descending channel. The rejection from the 0.618 level adds confluence for sellers. A break and close above 3,322 would flip structure bullish, targeting 3,351 and 3,375. Until then, the path of least resistance remains to the downside.
Conclusion:
Gold is at a critical decision point. A rejection at 3,322 sets the stage for a deeper sell-off, especially if DXY continues strengthening. Be patient and wait for confirmation—this zone could offer a strong risk-defined short setup.
Sign-off:
“In markets, clarity often lies just beyond the fear. Trade the levels, not the noise.”
💬 Share your take below, boost this idea, and follow for more timely setups. Trade smart!

BTC makes new all time highs!Crypto has been soaring today.
Ethereum and BTC pumping liquidity!
Fed minutes came out today around 2pm, indicating rate cuts at next meeting and throughout the rest of the year and crypto absolutely loved that.
Crypto thrives in a cheap liquidity environment, rallying in potential rate cuts.
We took profits on IBIT calls - still holding longs in the BTC market expecting higher price.

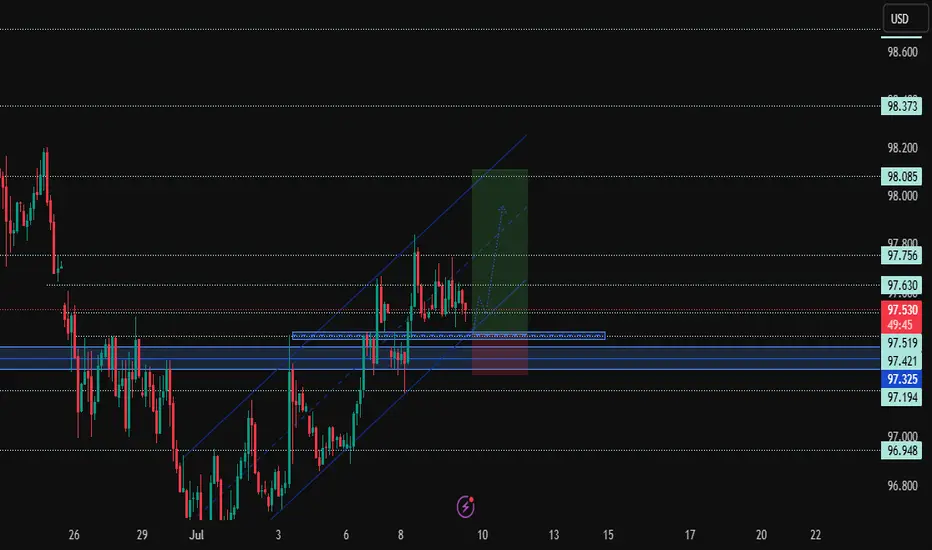
DXY Holds Above Channel Support: Next Leg Higher?Hey Traders,
The U.S. Dollar Index (DXY) is consolidating just above a strong support cluster around 97.325, aligned with ascending channel structure and historical demand. Price action is suggesting a potential bullish continuation if this support zone holds firm.
Current Market Conditions:
* DXY is trading within a well-defined ascending channel, maintaining higher highs and higher lows.
* Price is currently hovering above the 97.325 key support area and mid-channel dynamic trendline.
* Recent candles show rejection from the lower boundary of the bullish channel, indicating buyers may be stepping in again.
* Structure remains bullish unless price closes decisively below 97.325.
Fundamental Analysis/Outlook:
The dollar remains buoyed by persistent inflation pressures and Fed Chair Powell’s continued hawkish tone. Markets are pricing in fewer rate cuts in the near term, reinforcing USD strength. Today’s USD resilience is also supported by mild risk-off sentiment ahead of U.S. CPI data and Powell’s congressional testimony, which could further move the greenback.
Targets:
* TP1: 97.756
* TP2: 98.085
* TP3: 98.373
Risk Management:
* Stop-loss: Below 97.325 to invalidate bullish structure.
* Risk-to-Reward (R\:R): Minimum 1:2 setup. Consider adjusting position size based on support behaviour and macro event volatility.
Technical Outlook:
* Price needs to hold above 97.421–97.325 zone to maintain bullish bias.
* Watch for bullish engulfing or momentum candles as confirmation for long setups.
* A break above 97.630 could accelerate the rally toward higher resistance at 98.373.
Conclusion:
DXY is at a decision point. If bulls maintain control above 97.325, the index could push higher toward the 98.00+ zone. Keep an eye on U.S. economic data and Fed commentary for directional confirmation.
Sign-off:
“In markets, clarity often lies just beyond the fear. Trade the levels, not the noise.”
💬 Let me know your thoughts in the comments, and don’t forget to boost and follow for more insights. Trade safe!
Delayed Cycle Kicks Off This March? (Chart)🚀📈 Delayed Cycle Kicks Off This March? 🔥💡
March has (almost) arrived, and Bitcoin has officially confirmed $79,478 as major structural support—a critical level that had to be checked before the next move. This aligns perfectly with my previous idea of a delayed cycle playing out.
📌 Long above 79K
📌 Short below 79K
📌 Short-term target: GETTEX:87K+
With this structural support holding, I expect Bitcoin to push toward the next major test: $113,800. This is the all-time trendline, a level of historical significance.
🔑 What happens at 113K?
This is where Bitcoin’s fate for this cycle will be decided:
✅ A breakout above 113K could unlock a run to 150K - 200K, a true extension of this cycle.
❌ A terminal rejection at 113K could mark the end of this cycle, signaling a broader correction phase.
At the moment, the probabilities lean toward further upside, with an 80% chance of continuation. The 20% downside risk remains for a dip to FWB:65K-66K, but as long as Bitcoin stays above 79K, the bullish thesis remains intact.
💡 March looks strong, and I’m stepping on the gas today.
Let’s make it a powerful month! 🚀
One Love,
The FXPROFESSOR 💙
video:

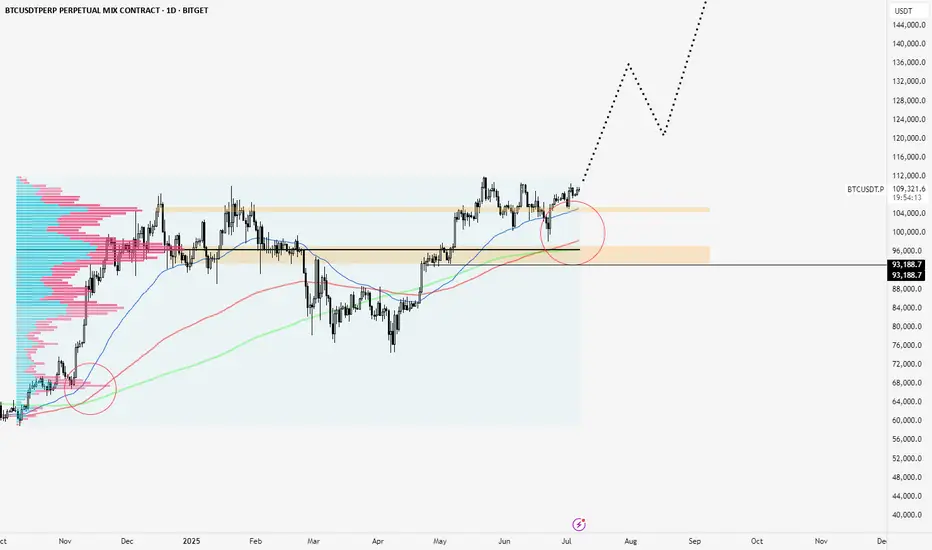
Bitcoin Breakout Ahead of Crypto WeekBitcoin has a great chance at cracking new all time highs and breaking out into price discovery this month. On July 14th, the US is considering it Crypto Week. Signing in the GENIUS bill, and more around crypto assets.
Bitcoin has held this volume shelf at around 104/105k for a while and these relative equal highs on the daily look like they can crack. I have highlighted some zones on the chart that I'd consider extremely important levels.
If we do crack these highs , I am on the side that the price action will be extremely expansive after all the work that has been done at those high volume clusters. If it fails I believe we should trade back to the high volume clusters, and if that doesn't hold, then we should trade through the thinner volume to do more business before bouncing off of the POC at around 96.5k.
The 50,150 & 200 EMAs are all signing ideal strength. Virtually all expansions in their early stages from 2023 to now contained these crosses on the Daily TF.
I am long BTC on a high timeframe. Macro narratives are strong, the asset is strong, and the downside is always in our control to be limited.
When will the media talk about BTC so I can SELL?!?!?!Waiting for the mainstream media to talk about BTC and the mass to buy bitcoin so I can sell my BTC LOL, I HAVE A WEDDING TO PAY!

Meta - The breakout in question?🪓Meta ( NASDAQ:META ) is retesting major structure:
🔎Analysis summary:
After Meta perfectly retested a major previous support trendline in 2022, the trend shifted bullish. We have been witnessing an incredible rally of about +700% with a current retest of the previous all time highs. Time will tell but a bullish breakout remains quite likely.
📝Levels to watch:
$750
🙏🏻#LONGTERMVISION
Philip - Swing Trader

BITCOIN BREAKOUT IMMINENT (120K)The Trend is your Friend. Bitcoin’s current action is the kind of bull‐market digestion you want to see before the next big surge. We’ve powered up from roughly $50 K on the Trump‐election narrative to flirt with all‐time‐high territory around $112 K, and now we’re simply consolidating in a tight $100 K–$110 K range. What really grabs my attention is how volume has dried up inside that band: fewer sellers stepping up means less fuel for a deep pullback, and an ebb in liquidity often precedes the kind of compressed buildup that launches a sharp move. That liquidity squeeze tells me smart money is biding its time rather than panicking out, and that sets the stage for a clean breakout once a new catalyst arrives.
Technically, the setup could hardly be neater. The 10-, 21- and 50-period moving averages have converged, running almost in lockstep. When those averages come together like train tracks, it signals a market in “healthy pause” — neither exhausted by an overextended rally nor capitulating under bearish pressure. It’s the kind of feature you love to see: price has had its run, it’s caught its breath, and it’s ready to go again on fresh conviction. Meanwhile, the RSI sits squarely in the middle of its range, neither overbought nor oversold, meaning there’s plenty of room for buyers to step in without an immediate pullback risk from extreme readings. In other words, momentum indicators are calm, not frothy or fearful, which further supports the case for a measured upward thrust rather than a sudden crash.
On the macro side, fundamentals are lining up, too. Monthly passive inflows into Bitcoin ETPs and ETFs continue at a robust clip, with institutions quietly adding to their positions out of the spotlight. If the Fed pivots toward rate cuts later this year, capital that’s been chasing yield elsewhere could flow back into risk assets — and Bitcoin, with its “digital gold” narrative, stands to gain especially when you consider its roughly $2 trillion market cap versus gold’s $20 trillion. That leaves a lot of upside potential if institutional demand keeps accelerating. Even more compelling: real‐world use cases for blockchain—everything from proof‐of‐ownership to decentralized finance—continue to mature behind the scenes, reinforcing Bitcoin’s narrative as not just a speculative asset, but a foundational piece of tomorrow’s financial system.
Of course, we can’t ignore the risks. We’ve already seen Bitcoin price near $112 K once, and there’s always the chance it carves a frustrating double-top if it stalls again. External narratives—Middle‐East tensions, renewed Ukraine tensions, fresh tariff skirmishes—could throw cold water on the rally and trigger a quick sell-off. But given the current setup—low‐volume consolidation, converging moving averages, balanced RSI and steady capital flows—a 10 % push toward $120 K feels not just possible but probable. Keep your eye on $112 K as your breakout trigger, size your positions sensibly, and plan your stop-loss around the lower end of the range. If Bitcoin can clear that level on strong volume, we’re likely to see this bull market extend rather than roll over into a double-top scenario. Happy trading, stay disciplined, and let’s see where this market takes us next!
