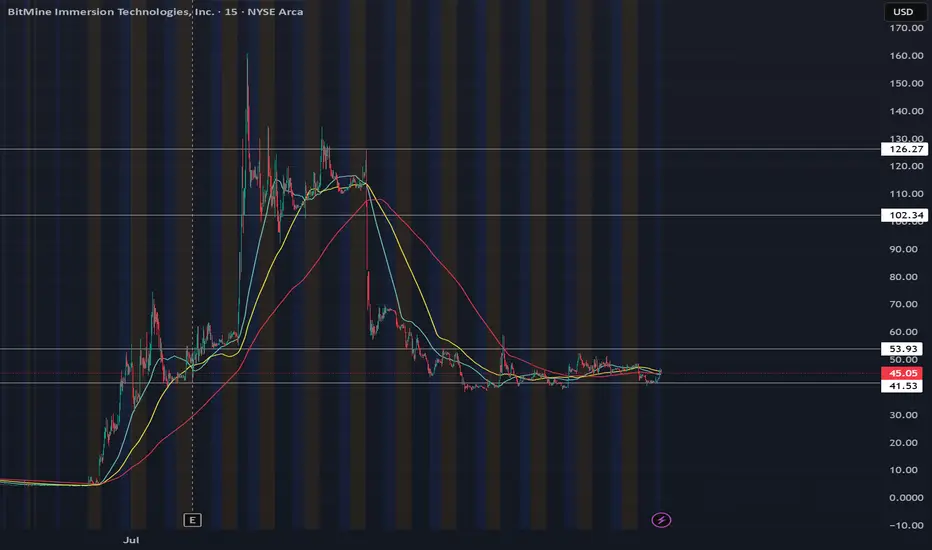
BACK TO 100Bought shares today at close new legislation is going to send this sky high. BMNR just may actually be the MSTR of ETH with the players they have. SBET BTBT COIN all will do great, but BMNR currently holds the lead for largest ETH treasury. Maybe more chop to average shares but this will be going SOON. As long as the daily RSI is above 50, we should be holding local support until breakout of this is accumulation zone.
Fundamental Analysis
Bitcoin and Upcoming TrendBitcoin’s trend has been growing from strength to strength — and it’s likely to stay that way. Why?
This trend isn’t driven purely by speculation; it’s supported by strong fundamental reasons.
One of the most widely debated topics in finance today is the comparison between Bitcoin and gold. While both are viewed as stores of value, their long-term roles may diverge significantly.
Yet, they’ve been moving in near-perfect synchronization, with potential resistance ahead, but their trend still remain intact — and here’s why.
Mirco Bitcoin Futures and Options
Ticker: MBT
Minimum fluctuation:
$5.00 per bitcoin = $0.50 per contract
Disclaimer:
• What presented here is not a recommendation, please consult your licensed broker.
• Our mission is to create lateral thinking skills for every investor and trader, knowing when to take a calculated risk with market uncertainty and a bolder risk when opportunity arises.
CME Real-time Market Data help identify trading set-ups in real-time and express my market views. If you have futures in your trading portfolio, you can check out on CME Group data plans available that suit your trading needs www.tradingview.com

LTC/USD LITECOIN Adam & Eve Pattern On WeeklyThe Adam and Eve pattern is quite effective and usually signals a trend change to bullish. Once this pattern breaks the neckline I think its straight to $200 before any sort of pullback.
Haven't done a chart in a while cause its been the same old stuff, sideways. We are starting to ignite now. Silver is running which means something is breaking in the background financial system. I see the biggest blow off top you've ever seen coming, its the only way out of this, print print print until it doesn't work anymore.
Also I was reading that Bitcoin is removing its cap for spam in each block in October? This could spell disaster for fees and congestion. Litecoin will skyrocket during that time I believe because the fees will be so high it will price out the little guy trying to send a grand or two. I see an influx of people coming to Litecoin. Good luck , none of this is financial advice just my opinion

Solana starting to look bullish again | Target $180 - $260In my previous idea, I anticipated a liquidity hunt below the $140 level, and price action played out exactly as expected. SOL wicked below this key support zone, triggering stop-losses and inducing panic selling — classic behavior before a major reversal. Following this sweep, price quickly reclaimed the range, breaking out of the downward channel, and is now retesting a bullish break of a textbook cup-and-handle pattern, signaling a potential trend continuation to the upside.
📊 Technical Setup
Cup and Handle formation is evident, with the "handle" forming as a downward-sloping channel now being challenged.
Price reclaimed the $140 demand zone post-sweep and is now retesting.
Target zones: $180 → $220 → $260 based on historical resistance levels and measured move projections.
📉 Invalidation Level
A daily close below $120 (marked as the Invalidation Zone) would invalidate this setup and suggest bulls have lost control.
🌐 Macro Perspective
Fed Rate Cut anticipation and cooling inflation data are helping risk-on assets like crypto regain momentum.
SOL staking ETF launching this week, while SOL spot ETF approval imminent.
Solana's growing DeFi ecosystem, along with high TPS performance and low fees, continues to attract developer and user activity. SOL remains a top candidate for sector outperformance in a bullish H2 crypto cycle.
📌 Conclusion
With market structure turning favorable and strong macro tailwinds, SOL may be gearing up for a major breakout rally. Watch the $160 level closely — a decisive break and hold above could confirm the next leg higher.

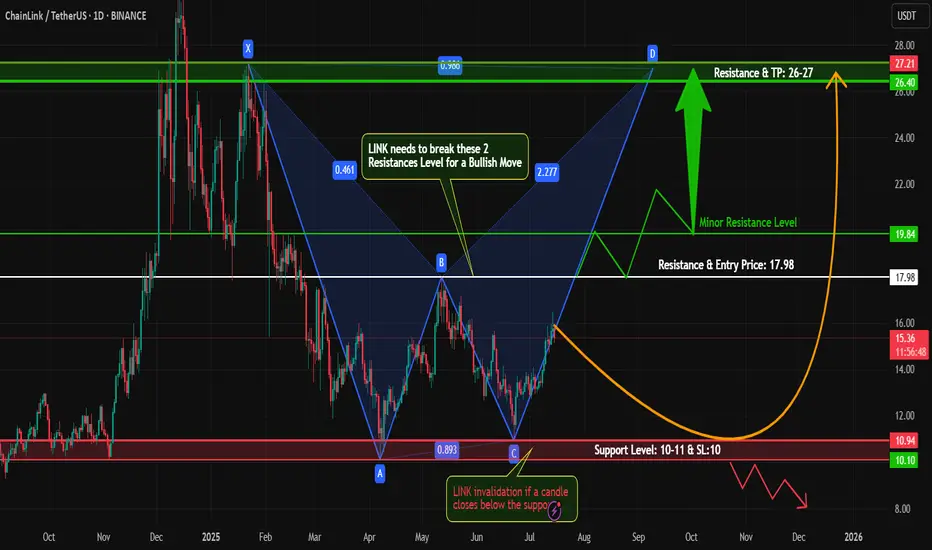
#LINKUSDT – Bullish Harmonic Pattern in Play!Hey Traders!
#LINK is currently trading near the bottom and forming a potential harmonic pattern, suggesting a possible move towards the D-point completion.
Technical Outlook:
Price action is respecting the harmonic structure.
We're watching closely for a break above key minor and major resistance levels.
A successful breakout and retest could confirm a bullish reversal.
Entry on retest with tight risk management and SL as marked on the chart.
Caution: Stay alert for fake breakouts, bearish divergence, or any signs of rejection near resistance. Patience is key — wait for confirmation!
What are your thoughts on #LINK? Are you bullish or bearish? Drop your analysis below!
If you found this setup helpful, like, comment, and follow for more high-probability trading setups every week!
#Crypto #LINK #HarmonicPattern #Altcoins #ChartAnalysis #CryptoTrading #TradingView #BullishSetup #BreakoutTrade #RiskManagement
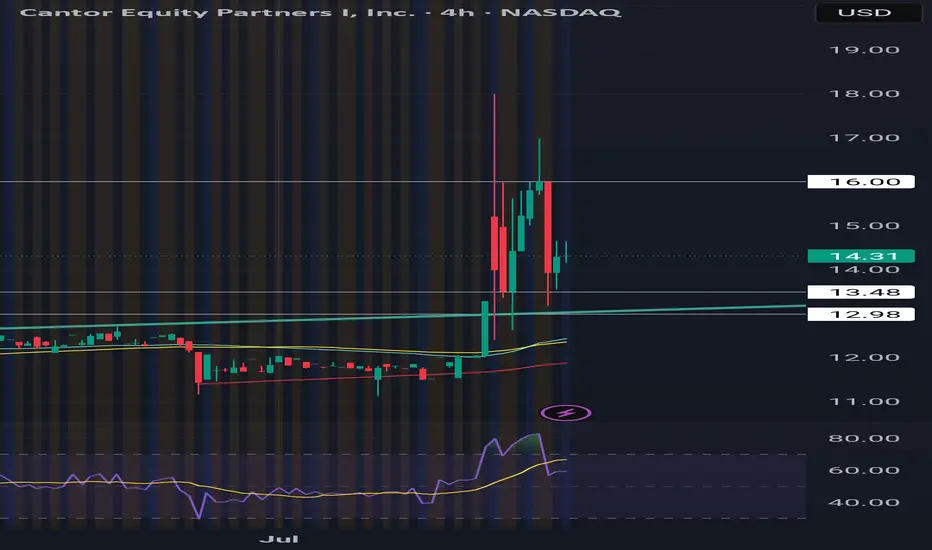
BTC TREASURY Adam Back, a satoshi era OG, is launching Bitcoin Standard Treasury Company (BSTR), which plans to go public through a merger with Cantor Equity Partners I (CEPO), a special-purpose acquisition company. BSTR will debut with 30,021 BTC, valued at approximately $3.5 billion, making it the fourth-largest public Bitcoin treasury. The company has secured $1.5 billion in private investment in public equity (PIPE) financing, the largest for a Bitcoin treasury SPAC merger, with CEPO contributing up to $200 million, subject to shareholder redemptions. The merger, expected to close in Q4 2025, aims to maximize Bitcoin ownership per share and accelerate adoption through Bitcoin-native financial products and advisory services. Ill be loading shares tommorrow and continuing to dca. Btc price swings will influence this heavily wind direction is currently North!
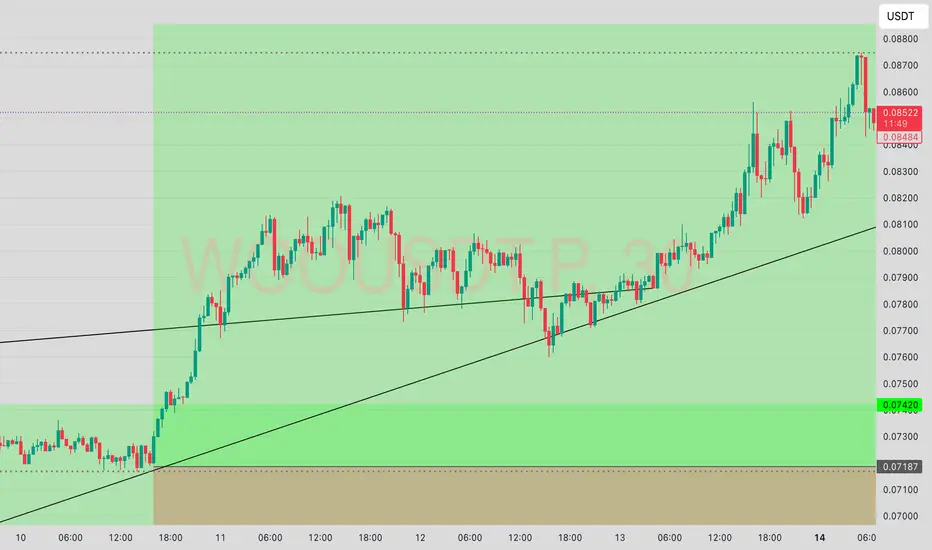
$WOOAnother painful trade here with BYBIT:WOOUSDT.P .
I set a limit entry @0.07187 while the trade came down nearing my entry but reversed @0.07198.
Looking at the chart now, it's nearing TP and I’m surprised I wasn’t in the ride.
So checking back and seeing this pains me. I’m SAD 😢
Is Stellar ready to rally 26% toward 0.55 target?Hello✌
let’s dive into a full analysis of the upcoming price potential for Stellar 📈.
BINANCE:XLMUSDT has surged through multiple daily resistance levels this past week, resembling a powerful breakout 🚀. It is now approaching a key daily support that aligns with the 0.26 Fibonacci retracement level. If this support holds, there is potential for a 26% gain, with a target price of 0.55 📈.
✨ Need a little love!
We pour love into every post your support keeps us inspired! 💛 Don’t be shy, we’d love to hear from you on comments. Big thanks , Mad Whale 🐋

EURUSD Short ProjectDescription:
1. Price Drivers: smart money distribution
2. Current Trend: down
3. Momentum: confirmed bearish
Action: Waiting for entry on the intraday timeframe (Entry will be published further)
*Disclaimer: I will not accept liability for any loss or damage, including without limitation to any loss of profit, which may arise directly or indirectly from use of or reliance on such information.

Some top triggers are getting heatedThe NUPL (Net Unrealized Profit/Loss), RP (Realized Price), and to a lesser extent, the CVDD (Coin Value Days Destroyed) are getting close to triggering. The last time a few top indicators on the BTI got close to triggering, we had a pullback. I think we see a continued rally near-term, but then a pull-back to cool off the indicators before they fully trigger...but what do I know?
Notice that the risk has not yet reached 7, where the previous pull back occurred, but it is very close. Let's see if we are in a 2017 or a 2020-type cycle.
Note: Extrapolating to a CRYPTOCAP:BTC cycle top is very difficult, but I think the BTI is the best shot I can come up with to do that. Using the risk value and the triggers of multiple top indicators should allow us to get close.

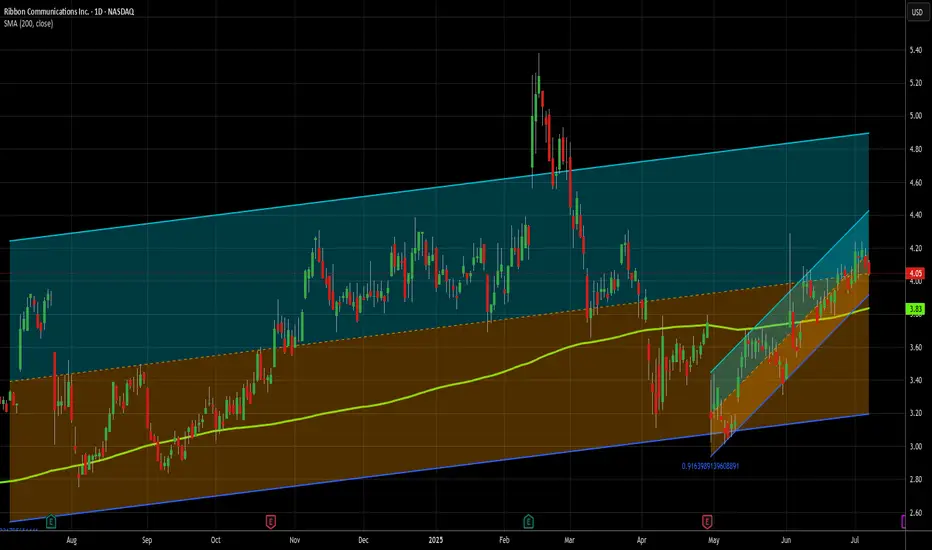
Small cap is the flavor of the day - Long at 4.05I decided to do a small cap stock today. I don't use too many of these as ideas, though I do trade them on my own. I don't usually publish about them because they are inherently more risky than large cap, established stocks. And to be fair, RBBN has a spotty history from a chart perspective.
Go ahead and zoom on out all the way. See that? That's what danger looks like. This stock has lost 80% of its value in the last 10 years, and 50% in the last 4. However, in its defense, it is profitable on a reported earnings basis over the last 12 months, and has held its own for several years now, and that's why I'm not AS nervous as I might otherwise be publishing this.
Additionally, it's solidly above its 200MA and in both a 1 year and 2 month uptrend, so its recent strength is good. I haven't dug down all the way back to its debut, but I suspect I'd have at the very least had a challenge making money on this one over its entire existence. But I am not trading its entire existence today. 75% of the trades in this stock in the last year would have closed in under 2 weeks, so the short term picture is what I'm mostly looking at here, and over the last month or so this has been a very solid stock. Could that change tomorrow? Yup. But I don't have that crystal ball. All I can do is rely on the system that has of late produced excellent results here.
In the last 12 months, there have been 27 buy signals here. 25 closed profitably and 2 are still open and down 18% and 9%, respectively. INCLUDING the losers, however, the median daily return on those trades has been .48% (>10x the market avg) and the average daily return is 1.02% (> 23x the avg daily market return).
Trading is about balancing risks and rewards. This stock is riskier than most, but the rewards are a lot better, too. I don't put all my money into any one trade - that's a TERRIBLE idea. The vast majority of my open trades are relatively safe, large cap stocks. But risky has its place in a portfolio. I made 15% in 2 days recently on QUBT (I posted that trade here) and made almost 18% on NUTX in the last 2 days - just closed that trade today. As a % of my portfolio of trades, ones like that can be small positions, but make a meaningful impact. That's my hope for RBBN here.
Of the 25 winning trades in the last year, over half produced a gain of 4% or more. And the average holding periods of the winners was only 8 days, with 15 of the 25 closing in a week or less. That rapid return also reduces the risk in a stock like this one. Wnen you only stick around for a few days most of the time, it's harder (not impossible) to get caught holding the bag during a drop.
My close will be signal based, and not a particular price target, but the trades I referred to above on RBBN give a good outline. However, the 2 losers have been open since February, so be forewarned that IF you follow me on this one, you might need to buckle your chinstrap. It could get bumpy.
As always - this is intended as "edutainment" and my perspective on what I am or would be doing and why, not a recommendation for you to buy or sell. Act accordingly and invest at your own risk. DYOR and only make investments that make good financial sense for you in your current situation.
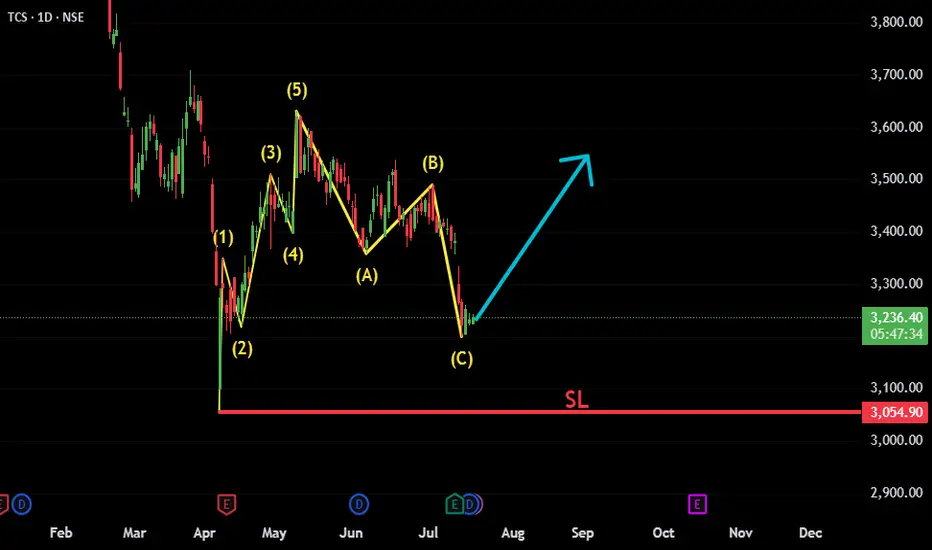
TCS: ABC Correction Complete – New Impulse Wave in FocusTCS appears to have completed a classic Elliott Wave structure, consisting of an initial 5-wave impulsive move followed by an A-B-C corrective phase. The recent price action suggests the correction has likely ended, and a new bullish impulsive move is beginning.
Fundamental trigger:
Interestingly, just a few days ago, TCS announced strong quarterly results — reporting solid profits and declaring a dividend. Despite the positive news, the stock reacted negatively and moved lower. This could have been a classic case of "good news, bad reaction" — possibly a stop-loss hunt or smart money absorbing liquidity before the next leg up.
Key technical points:
✅ Wave 1-2-3-4-5 clearly visible, forming the initial impulse.
✅ A-B-C correction appears complete with price reversing from a key support zone.
📈 Bullish structure forming; watching for confirmation with a break above recent highs.
🔍 Technicals and sentiment suggest renewed upside potential, despite short-term shakeouts.
Invalidation below recent swing low (Beginning of 1st Impulsive).
This setup offers a potential long opportunity with a favorable risk-reward
#TCS #NSE:TCS #ElliottWave #WaveAnalysis #TechnicalAnalysis #ABCCorrection #ImpulsiveWave #LongSetup #ChartAnalysis #NSEStocks #IndianStocks #Dividend #Earnings #PostEarningsMove #TrendReversal #SwingTrading #PriceAction #SmartMoney
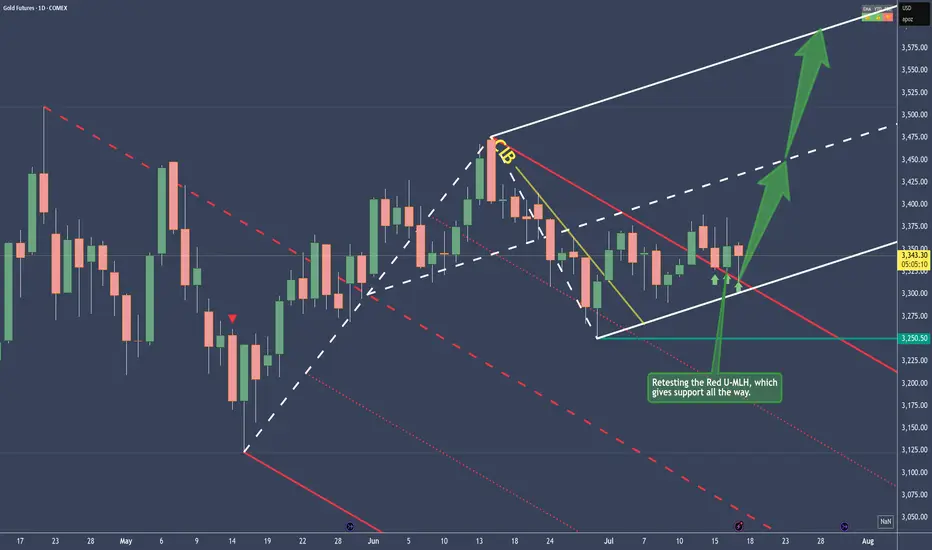
Gold - Bullish and here's whyPrice traveled within the Red Fork, until it broke the CIB Line, which is indicating a Change In Behavior.
From there on, sideways action, until the break of the Red U-MLH happened.
After the close above the Red U-MLH, price has tested it the 3rd time now. At the time of writing, the Bar looks like a PinBar. So it has good sepparation from the bottom, or a long Down-Wick. That's indicates good strenght.
To me this looks like a good long trade, but as everytime, play it save and don't let greed eat your brain ;-)
Global liquidity downtrend cometh!During this current BTC cycle, major uptrends in global liquidity have corresponded to major uptrends in the market 72ish days later. The last major uptrend in liquidity is about to run its course, pause, and then downtrend. If this relationship holds, we are at or near at least a pause in the local up trend. I have my popcorn ready to see if this plays out.
Note: The global liquidity prediction pauses until December 11th and then downtrends, so if we see floating higher prices until that point and then a pause, the relationship would still be valid.
Second Note: I will publish the BGL (Bitcoin Global Liquidity) indicator very shortly. Please test it out and DM me if you see any issues or have suggestions.
--Da_Prof

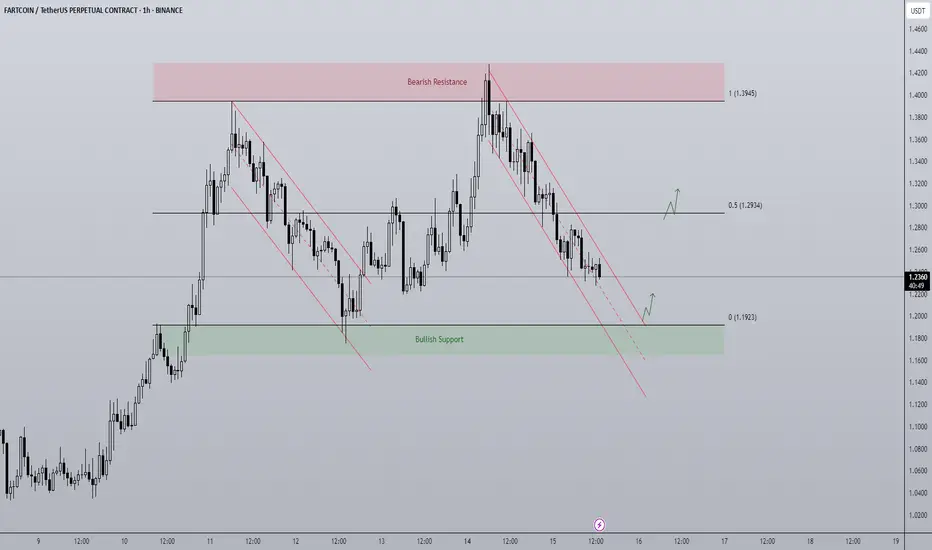
Fartcoin - Rangebound repeat? A BTC makes new highs attention has turned towards altcoins to play catch up.
FARTCOIN has been a top performer of the last month and currently on the 1D timeframe finds itself in a rangebound environment capped between $1.1923 - $1.3945. The end of last week price trended down in a bearish channel from top to bottom and it looks to be doing the same currently. As the supply zone above the range high got swept, price printed a SFP getting back inside the range and began trending down, for me there are two actionable long entries here:
- A range low bounce + breakout of trend channel would be an ideal long entry. An area of clear support coupled with a breakout is a historically strong setup with a clear invalidation if price breaks below the range and gets accepted.
- A more aggressive but potentially less ideal setup would be a breakout of the downtrend before hitting range lows. Higher risk as the level of support is not as defined but in the more risk-on environment crypto is currently in, the chance of major support levels being front run does go up as buyers become more impatient when FOMO grows.
The midpoint is key level to look out for too as a reclaim would mean a run at the highs, rejection opens the door to retest the lows.
USDJPY SELL IDEAAfter yesterday's spiky move caused by d.trump
Market should correct some of those imbalance soon
Target at the ERL

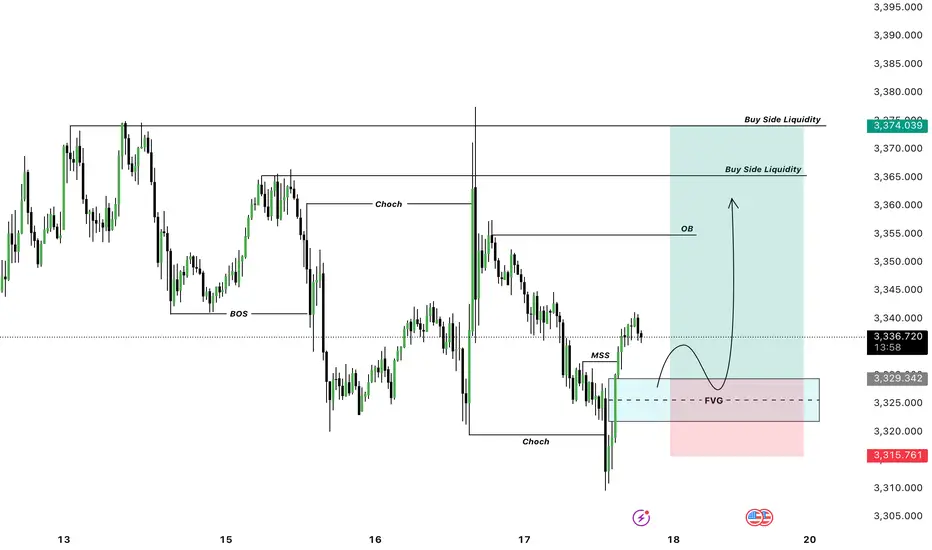
GOLD LONG SETUP Gold Bullish Long Setup
Startegy : FVG + MSS + BUY STRUCTURE
Where To Buy ?
3329 - 3320 Area FVG Buy
Targets : 3350 , 3355, 3360
Stop Loss Previous Low
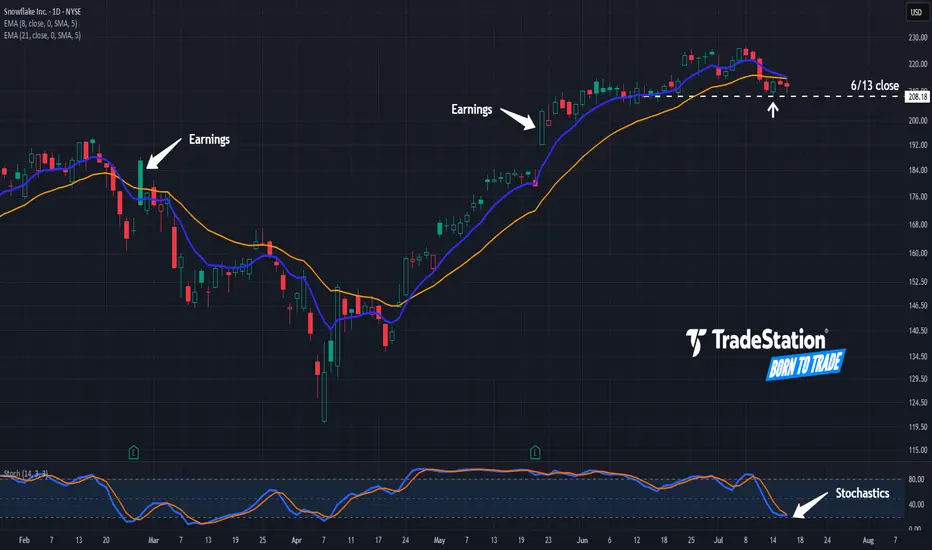
Snowflake Pulls BackSnowflake jumped to a new 52-week high last week, and now it’s pulled back.
The first pattern on today’s chart is the pair of price jumps after the last two quarterly reports. Those may reflect bullish sentiment in the software company.
Second is the June 13 weekly close of $208.18. SNOW appears to be stabilizing after revisiting that level, which may suggest support is in place.
Third, stochastics neared oversold territory and are now trying to turn higher.
TradeStation has, for decades, advanced the trading industry, providing access to stocks, options and futures. If you're born to trade, we could be for you. See our Overview for more.
Past performance, whether actual or indicated by historical tests of strategies, is no guarantee of future performance or success. There is a possibility that you may sustain a loss equal to or greater than your entire investment regardless of which asset class you trade (equities, options or futures); therefore, you should not invest or risk money that you cannot afford to lose. Online trading is not suitable for all investors. View the document titled Characteristics and Risks of Standardized Options at www.TradeStation.com . Before trading any asset class, customers must read the relevant risk disclosure statements on www.TradeStation.com . System access and trade placement and execution may be delayed or fail due to market volatility and volume, quote delays, system and software errors, Internet traffic, outages and other factors.
Securities and futures trading is offered to self-directed customers by TradeStation Securities, Inc., a broker-dealer registered with the Securities and Exchange Commission and a futures commission merchant licensed with the Commodity Futures Trading Commission). TradeStation Securities is a member of the Financial Industry Regulatory Authority, the National Futures Association, and a number of exchanges.
TradeStation Securities, Inc. and TradeStation Technologies, Inc. are each wholly owned subsidiaries of TradeStation Group, Inc., both operating, and providing products and services, under the TradeStation brand and trademark. When applying for, or purchasing, accounts, subscriptions, products and services, it is important that you know which company you will be dealing with. Visit www.TradeStation.com for further important information explaining what this means.
ETH/BTC Poised for a Breakout: A Technical and Fundamental ViewA confluence of technical signals on the weekly ETH/BTC chart, coupled with significant fundamental developments for both Ethereum and Bitcoin, suggests a potential upward move for the pairing in the coming weeks.
Technical Analysis (TA)
The weekly chart for ETH/BTC on Binance reveals a potential bottoming formation after a prolonged downtrend. The price has been consolidating in recent months, and the latest weekly candle shows a strong bullish engulfing pattern, indicating a possible shift in momentum.
Key levels to watch, as identified on the chart, are:
Immediate Resistance: 0.02546 BTC. A decisive close above this level on the weekly timeframe would be the first confirmation of a potential trend reversal.
Further Resistance: 0.02929 BTC and 0.03451 BTC. These represent subsequent hurdles for the bulls to overcome.
Take Profit Target: 0.038 BTC. This level is marked as the ultimate target for this potential upward move.
Timeframe: The analysis on the chart suggests a maximum timeframe of 5 weeks for this trade idea to play out.
Moving Averages: The price is currently trading below the MA Ribbon (SMA, 20, 50, 100, 200), which could act as dynamic resistance. A break above this ribbon would further strengthen the bullish case.
Fundamental Analysis (FA)
The current market environment in July 2025 provides several fundamental catalysts that could impact the ETH/BTC ratio.
For Ethereum (ETH):
Growing Institutional Interest: Ethereum ETFs have seen significant inflows, with over $890 million in July 2025 alone, driven by increasing confidence from institutional investors. Asset managers like BlackRock are accumulating substantial amounts of ETH, reducing the available supply on the market.
Network Upgrades: The upcoming "Pectra" upgrade, which includes Proto-Danksharding (EIP-4844), is anticipated in Q3 or early Q4 2025. This is expected to significantly reduce Layer-2 transaction costs and improve scalability, further enhancing the utility of the Ethereum network. The earlier Pectra upgrade in 2025 already introduced user-friendly features like smart accounts.
Ecosystem Growth: The Linea project, a prominent player in Ethereum's DeFi ecosystem, has a Token Generation Event (TGE) scheduled for July 2025, which is expected to drive market shifts. The overall DeFi ecosystem on Ethereum is showing signs of revitalization.
For Bitcoin (BTC):
Strong Institutional Demand: Similar to Ethereum, Bitcoin is experiencing a wave of institutional adoption, with significant inflows into spot Bitcoin ETFs. Public companies are now holding BTC in their treasuries, and major financial institutions view it as a strategic asset.
New All-Time Highs: Bitcoin has recently surged to new all-time highs, breaking key trendlines and signaling a new bullish era. This strong performance often has a spillover effect on the broader crypto market, including altcoins like Ethereum.
Favorable Macro Environment: Some analysts point to a looser monetary policy from global central banks and inflation concerns as factors boosting demand for hard assets like Bitcoin.
ETH vs. BTC Dynamics:
While Bitcoin's price has seen impressive gains, some analysts believe Ethereum has room to catch up. The ETH/BTC ratio is a key metric for gauging the relative strength of the two leading cryptocurrencies. An upward trend in the ETH/BTC chart, as suggested by the technical analysis, would indicate that Ethereum is outperforming Bitcoin. The performance of ETH relative to Bitcoin is often seen as a barometer for the broader altcoin market.
My point of view
The technical setup on the ETH/BTC weekly chart presents a compelling case for a potential bullish reversal in the short to medium term. This is supported by strong fundamental developments within the Ethereum ecosystem, including significant institutional inflows and major network upgrades. While Bitcoin's own bullish momentum is a factor to consider, the potential for Ethereum to outperform in the coming weeks, as indicated by the provided chart analysis, offers an interesting trading opportunity. Traders should closely monitor the identified resistance levels for confirmation of a breakout.

Today’s main strategy: bulls take the lead, followed by bears!Yesterday, gold maintained a range of fluctuations. The game between bulls and bears was fierce but failed to break the current structure. The overall trend is not clear for the time being. From a fundamental perspective, risk aversion still dominates market expectations, which makes the gold trend lack a directional breakthrough. However, we need to be vigilant that the main funds may force the gold price to fall through extreme suppression in the future. From the 4-hour cycle, gold has been under pressure near the upper track of 3377 and has fallen continuously. It has fallen below the middle track support and touched the lower track. The current price is temporarily supported near the lower track, but the overall situation is still in a wide range of fluctuations. The trend has not yet formed. The short-term strength of the US dollar also suppresses the gold rebound. The current bulls and bears are anxious, and the key support and resistance have not been effectively broken. Currently, pay attention to the effectiveness of the support in the 3325-3320 area. If it pulls back to this area, you can consider a short-term long layout, and the target is the 3340-3350 range above. If it rebounds to this area, you can choose to stop profit and go short at the right time, and the target is the lower track area. If the downward momentum is strong, it may fall below yesterday's low to form a continuous decline.

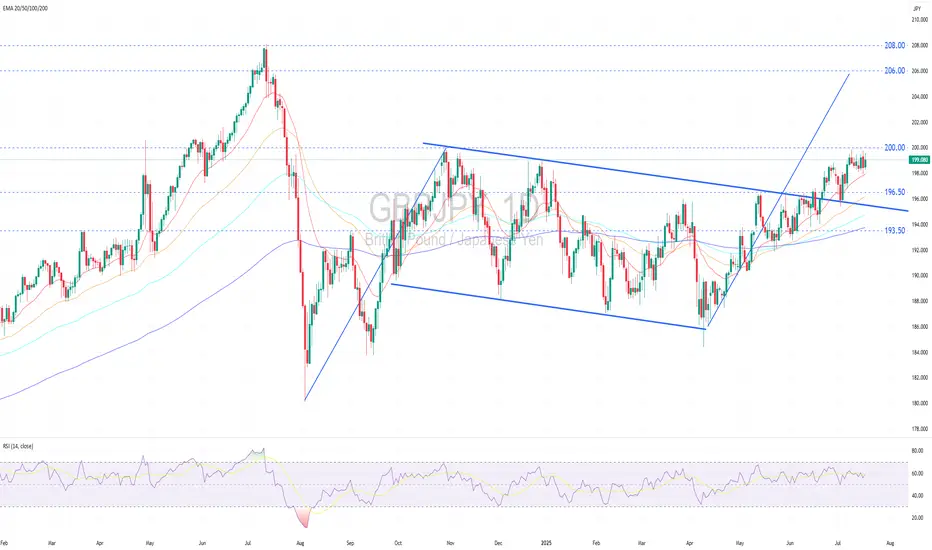
GBPJPY Remains in a Solid Uptrend.GBPJPY remains in a solid uptrend.
Technical Outlook:
GBPJPY remains in a firm uptrend, forming a series of higher highs and higher lows while holding above widening bullish EMAs, signaling strong bullish momentum.
Price is currently consolidating sideways near the recent peak, following a successful retest of the broken descending trendline, a classic bullish continuation setup.
No clear reversal signals have emerged, and the range-bound action suggests accumulation ahead of a potential upward breakout (above 200.00).
A decisive breakout above the psychological resistance at 200.00 would confirm a trend-following breakout, opening upside targets at 206.00 (flagpole projection) and potentially 208.00 (2024 high).
Near-term pullbacks may find support at 196.50 , the prior breakout zone, before resuming the uptrend.
Fundamental Outlook:
The pound is supported by higher-than-expected inflation data for June, with the UK’s Consumer Price Index (CPI) coming in at 3.6%, nearly twice the BoE target. This has led markets to expect that the BoE might delay or pause interest rate cuts at its upcoming meeting in August.
Moreover, the UK Prime Minister’s strong commitment to fiscal discipline has played a pivotal role in reinforcing investor confidence, thereby lending further support to the pound.
In contrast, the BoJ continues to adopt a cautious stance, keeping its policy rate at a relatively low at 0.50%. This conservative approach reflects the central bank’s intent to monitor the economic impacts of US tariff increases before any further action.
The BoJ’s low-rate policy sustains yen carry trades, driving capital outflows into higher-yielding US assets, mostly US treasury bonds, and intensifying downward pressure on the yen.
Analysis by: Krisada Yoonaisil, Financial Markets Strategist at Exness
Report - 17 jully, 2025Executive Notes – Summary
Tariffs Bring In $50bn+ for U.S.: Global partners mostly restrained; only China and Canada retaliated. EU delays action until Aug 1. → Bullish short-term for USD revenue and equities tied to U.S. industrial base; long-term inflation risk rising.
Trump vs Powell (Fed Chair): Trump floated firing Powell; market volatility followed. Odds hit 40%, fell after walk-back. → Bearish for DXY, bullish for XAUUSD and risk hedges.
China-Japan Espionage Flashpoint: Japanese executive jailed. U.S. and Japanese corporates face higher operational risk. → Negative FDI outlook for China, positive momentum for India, Vietnam.
EU–Mercosur Trade Deal at Risk: France demands safeguards on beef, sugar, poultry. Deal approval hinges on political concessions. → Watch agri-commodities (softs), BRL, and EU agri-lobby impacts.
ASML Profit Warning: Trump tariff fears cloud 2026 chip industry outlook; shares drop 11%. → Bearish on EU semis, capital goods.
Nvidia China Deal Revival: U.S. set to grant export licenses for AI GPUs; H20 shipments may resume. → Bullish for China AI adoption and semis; BABA, BIDU, NVDA in rebound territory.
Goldman & JPM Rally on IB Recovery: M&A/IPO flows return; +26% YoY IB fees. → Signals CEO confidence; bullish for dealmakers and sector ETFs (KCE, XLF).
Subsea Cable Ban on China: FCC to block Chinese tech in U.S.-linked subsea networks. → Signals rising digital Cold War; tech supply chains shifting westward.
Germany’s Allianz CEO Sounds Alarm: Warns of fiscal collapse by 2035 if welfare spending not reformed. → Supports hard-asset thesis; bearish EU fiscal stability perception.
Crypto Week & Stablecoin Push: Cantor-led SPAC to buy $4B BTC; U.S. fast-tracking stablecoin rules. → Bullish BTC, USDT dominance, and crypto-native banking platforms.
Full Strategic Macro & Market Analysis
President Trump’s aggressive tariff policy is achieving both economic and political outcomes ahead of the election: $64 billion in Q2 customs revenues and symbolic victory over hesitant global peers. According to Treasury data, tariffs have surged income by over $47 billion YoY. This influx comes with asymmetric retaliation: only China and Canada have meaningfully responded. The EU, under pressure from France’s agricultural bloc, has paused countermeasures, awaiting August 1 negotiations.
The market's muted reaction reflects the novelty of tariffs being treated as quasi-fiscal tools. Yet, the Yale Budget Lab’s finding of a 20.6% effective average tariff — the highest since 1910 — is an inflationary wildcard. UBS projects that core goods prices may push CPI above 2.3% until 2027 without policy reversal, eroding real incomes and squeezing margins across consumer sectors. As noted by Fed officials like John Williams, tariffs alone are lifting inflation by a full percentage point over the next 12 months.
At the same time, Trump’s remarks about firing Fed Chair Powell jolted Treasury and currency markets. The DXY fell nearly 0.9% intraday, while 2-year U.S. yields dropped to 3.90%, pricing in a potentially more dovish successor. This political volatility amplified market preference for inflation hedges and high-quality equity earnings.
Assets:
XAUUSD (Gold):
Trump’s Fed confrontation, rising CPI prints, and global legal-institutional instability support continued gold upside. Technical momentum remains bullish. If DXY dips below 103 and Powell uncertainty rises, gold could retest $2,450.
S&P 500 & Dow Jones:
Rotation continues. Industrials and financials (e.g., Goldman Sachs, JPMorgan) gain from tariff-driven reshoring and M&A revival. However, semis and global tech face drag from ASML warnings and U.S.–China tech decoupling. Dow holds better given dividend strength, but risk spikes if Powell is removed or tariffs push inflation past 3%.
USDJPY:
USD weakening bias persists on Fed risk, though yen gains are capped by geopolitical risk in Asia (e.g., Chinese jet near Japan, espionage cases) and Japan’s sluggish growth. A move toward 152 is possible if Powell exits or the Fed pivots dovishly.
DXY (Dollar Index):
Trump’s instability narrative, threats to Fed credibility, and rising CPI are weighing on the dollar. Watch for a decisive breakdown below 103, especially if ECB/BoE turn hawkish or U.S. deficit headlines worsen.
Crude Oil (WTI):
Supported by strong commodity complex (steel, copper, aluminum all up), tariffs on inputs, and stable OPEC+. Bullish bias into Q3, with demand steady and risk premia rising from China tensions and Middle East unrest.
Macro Risks
Fed Politicization: Powell’s premature dismissal could unravel market confidence in the U.S. rate regime. Bonds and USD would sell off; capital flight risk rises.
Persistent Inflation: Tariffs risk pushing CPI above 3% in 2025. Long-end yields will respond faster than the Fed.
Tech War Escalation: Subsea cable bans, Huawei exclusion, and AI chip controls could trigger further retaliation from China.
EU-Mercosur Breakdown: French farming veto could stall EU diversification efforts and strengthen protectionist politics in Europe.
Emerging Opportunities
U.S. Banks and Dealmakers: Goldman Sachs and JPMorgan gains point to a rebound in capital markets activity. KCE ETF, GS, and MS are prime exposure vehicles.
AI-Semiconductor Complex (Selective): Nvidia’s China deal reversal allows for a tactical rebound in NVDA, BIDU, BABA, despite broader export controls.
Bitcoin Accumulation Wave: Trump-aligned SPACs (Cantor Equity Partners 1, BSTR Holdings) are spearheading institutional BTC acquisition. Stablecoin legislation expected to favor U.S. dollar dominance.
Dividend-Centric Strategies: Payout increases from industrials (Costamare, ILPT) outnumber dividend cuts. Defensive dividend plays are outperforming growth narratives in volatile macro backdrops.
Possibilities:
XAUUSD (Gold)
Short-Term (1–4 weeks): Likely to stay elevated or push higher amid Fed independence concerns and strong CPI tailwinds. A sustained move above $2,400 opens a path to $2,450–2,480, especially if Powell’s status deteriorates or the DXY breaks 103.
Medium-Term (3–6 months): Remains supported by structural inflation and global de-dollarization themes (e.g., stablecoins, geopolitical risk in Asia, digital infrastructure war). Positioning may increase if the Fed turns more political.
S&P 500
Short-Term: High volatility. Earnings remain solid, especially in financials and industrials, but valuation compression risk persists if long-end rates stay above 5%. Potential 1–2% pullbacks on Powell uncertainty.
Medium-Term: Rotation-led upside possible if Fed stability is restored. But if tariffs worsen CPI and margins compress, we could see a multi-month consolidation. AI and industrial resilience may cap downside.
USDJPY
Short-Term: Expected to test downside near 152. Japanese yen gaining haven demand, and dovish Fed risk undermines USD strength. If risk sentiment worsens (China, Powell), JPY outperforms.
Medium-Term: Neutral-to-bearish. If the Fed resumes cuts or dollar confidence erodes, USDJPY could move sub-150. BOJ remains dovish, limiting gains beyond that.
DXY (US Dollar Index)
Short-Term: Under pressure. If Powell's removal gains traction or more tariffs fuel CPI, DXY may decisively lose 103 support. Temporary rebounds on safe-haven flows possible.
Medium-Term: Bearish bias forming. Stablecoin growth, Trump-led policy volatility, and global diversification efforts (e.g., EU trade deals) weigh on demand for USD assets.
Crude Oil (WTI)
Short-Term: Bullish tone holds. Supply-side support from OPEC+, tariffs lifting input costs, and solid U.S. industrial activity. Potential retest of $85/bbl.
Medium-Term: Risk of higher volatility. If global growth slows (China contraction or Fed missteps), oil could retreat to mid-$70s. But inflationary pressure remains net supportive.
Dow Jones Industrial Average
Short-Term: Outperforming due to resilient bank earnings, dividend momentum, and defensive bias. Likely to remain range-bound with modest upward drift unless Powell is ousted.
Medium-Term: Cautiously bullish. Dividend themes remain strong, and industrials benefit from tariff protection. But inflation and long-duration debt concerns could cap gains.

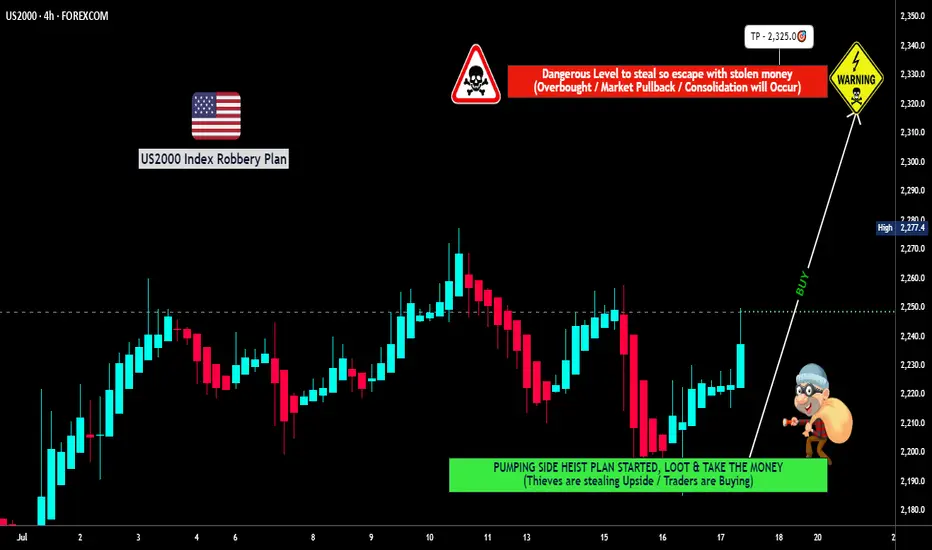
"US2000 THIEF TRADE: SWIPE & ESCAPE BEFORE BEARS!"🔥💰 "RUSSELL 2000 HEIST" – THIEF TRADING STYLE (BULLISH LOOTING IN PROGRESS!) 💰🔥
🚨 ATTENTION, MARKET ROBBERS & MONEY MAKERS! 🚨
(Thief Trading Strategy – High-Reward, Low-Risk Escape Plan!)
🎯 MISSION: US2000 / RUSSELL 2000 INDEX
(Current Market Status: Bullish Heist in Progress!)
🔓 ENTRY POINT: "THE VAULT IS OPEN!"
"SWIPE THE BULLISH LOOT AT ANY PRICE!" 🏦💨
Pro Thief Move: Use Buy Limit Orders (15-30min TF) near recent swing lows/highs for sneaky pullback entries.
Advanced Heist Tactics: Layered DCA entries (multiple limit orders) for maximum stealth & profit.
🛑 STOP-LOSS (ESCAPE ROUTE):
SL @ Nearest Swing Low (4H TF – 2200.0)
Risk Management Tip: Adjust SL based on your loot size (position sizing) & number of orders.
🏴☠️ TARGET: 2325.0 (OR ESCAPE BEFORE THE BEARS CATCH YOU!)
Scalpers Alert! 🚨 Only LONG-side scalp – if you’re rich, go all-in. If not, join the swing heist & use Trailing SL to lock profits!
💥 WHY THIS HEIST WILL WORK:
✔ Bullish Momentum Fueling the Rally
✔ Weak Bears Trapped Near Resistance
✔ Smart Money Accumulating Before Breakout
✔ Institutional Flow & Macro Trends Aligned (Check COT Report & News!)
📰 THIEF’S NEWS ALERT:
🚨 Beware of High-Impact News! (Avoid new trades during volatility.)
🚨 Use Trailing SL to Protect Your Loot!
💖 SUPPORT THE HEIST SQUAD!
👉 SMASH THAT "LIKE" & "BOOST" BUTTON! 👈
(More heists = More profits for all!)
🎭 DISCLAIMER:
This is NOT financial advice – just a Thief Trading Strategy! Trade at your own risk. Market conditions change fast, so stay sharp!
🚀 NEXT HEIST COMING SOON… STAY TUNED, ROBBERS! 🤑