Coinbase Premium Signals OversoldThe Coinbase Premium (CBP) is currently signaling "oversold". This is an indicator which identifies extremes in the price of CRYPTOCAP:BTC on Coinbase in relation to the average of the Binance and Bybit CRYPTOCAP:BTC price. The CBP has done a pretty good job over the last few years of identifying levels of high and low risk for the price of $BTC.
Fundamental Analysis

Still a lot of room for BTC riskAccording to past cycles, there is still a lot of room to the upside for the risk metric.

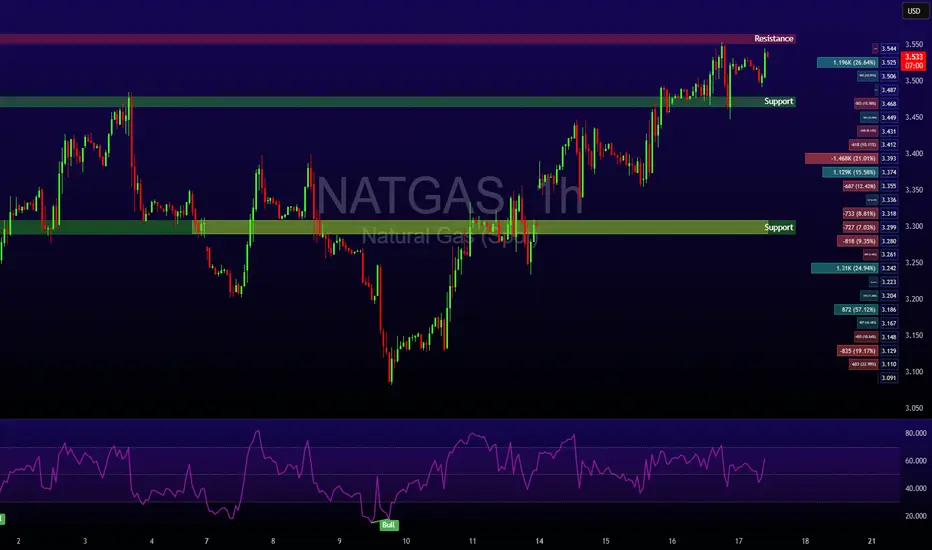
Heatwave Fuels Breakout as Fundamentals AlignNatural Gas has reclaimed the spotlight with a sharp move above $3.56, breaking through a key resistance level as a heatwave grips large parts of the United States. With above-average temperatures forecast to persist into late July, demand for cooling remains elevated, significantly boosting power consumption across the board.
Supply remains tight despite elevated production levels. Liquefied Natural Gas (LNG) feedgas volumes are rising as export demand holds strong, keeping domestic stockpiles in check. While some temporary relief in demand could arrive next week, the broader outlook remains bullish. Weather models suggest persistent heat, and traders are increasingly positioning for sustained tightness in the balance of supply and demand.
Technical Setup:
• Key level breached: $3.48 (100-day EMA) decisively broken
• Current price zone: Approaching $3.57, the next major pivot
• Momentum: If bulls secure a weekly close above $3.57, the market could enter a longer-term uptrend with $3.65 and $3.80 in sight.
Takeaway: Natural gas traders should monitor weather patterns and storage data closely. Sustained heat could keep the rally intact, but short-term pullbacks may offer entry points for trend-followers.
GBP/CAD Clarity in Motion! Levels Are Locked In Hey everyone 👋
📌 BUY LIMIT ORDER / GBP/CAD Key Levels
🟢 Entry: 1,83873
🎯 Target 1: 1,84104
🎯 Target 2: 1,84372
🎯 Target 3: 1,85040
🔴 Stop: 1,83316
📈 Risk/Reward Ratio: 2.18
I double-checked the levels and put together a clean, focused analysis just for you. Every single like seriously boosts my motivation to keep sharing 📈 Your support means the world to me!
Huge thanks to everyone who likes and backs this work 💙 Our goals are crystal clear, our strategy is solid. Let’s keep moving forward with confidence and smart execution!

BTC Next Move within 11-15 DaysBTC will hit $62,528.74 Within 11-15 Days
The historical trend suggests that once Bitcoin (BTC) surpasses the $50,000 threshold, it typically enters a bullish phase, experiencing significant gains. This observation is based on past market behavior, where crossing this key price point has often led to increased investor confidence and subsequent price surges.

FHNthe last financial news came out good and this means that the fundamentals are good, the technicals are also good.
must buy

Oh CANDADA!🇨🇦A simple idea, which I will gradually fill with life:
Act 1:
-> the 🇨🇦CAD comes to life.
📊🔮🇺🇲 US retail sales, which will be published today at 2:30 pm, will be higher than expected by the consensus.
Further acts and updates will be follow✅️

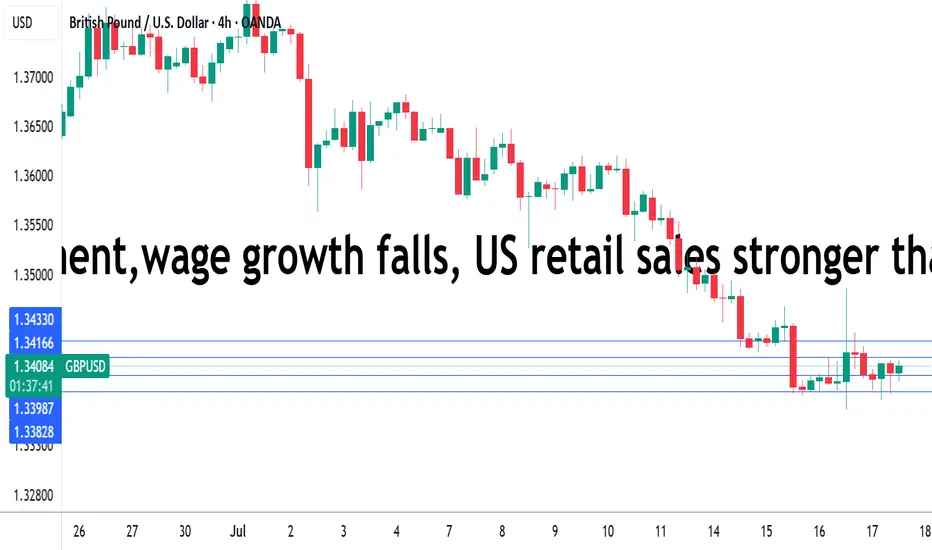
UK employment,wage growth falls, US retail sales shineThe British pound showing limited movement on Thursday. In the North American session, GBP/USD is trading at 1.3406, down 0.09% on the day.
Today's UK employment report pointed to a cooling in the UK labor market. The number of employees on company payrolls dropped by 41 thousand in June after a decline of 25 thousand in May. Still, the May decline was downwardly revised from 109 thousand, easing concerns of a significant deterioration in the labor market.
Wage growth (excluding bonuses) dropped to 5.0% from a revised 5.3%, above the market estimate of 4.9%. The unemployment rate ticked up to 4.7%, up from 4.6% and above the market estimate of 4.6%. This is the highest jobless level since the three months to July 2021.
The latest job data will ease the pressure on the Bank of England to lower rates, as the sharp revision to the May payroll employees means the labor market has not deteriorated as much as had been feared. Still, the employment picture remains weak and the markets are expecting an August rate cut, even though UK inflation was hotter than expected in June.
US retail sales bounced back in June after back-to-back declines. Consumers reacted with a thumbs-down to President Trump's tariffs, which took effect in April and made imported goods more expensive.
The markets had anticipated a marginal gain of just 0.1% m/m in June but retail sales came in at an impressive 0.6%, with most sub-categories recording stronger activity in June. This follows a sharp 0.9% decline in May.
The US tariffs seem to have had a significant impact on retail sales, as consumers continue to time their purchases to minimize the effect of tariffs.
Consumers increased spending before the tariffs took effect and cut back once the tariffs were in place. With a truce in place between the US and China which has slashed tariff rates, consumers have opened their wallets and are spending more on big-ticket items such as motor vehicles, which jumped 1.2% in June.
Trump's five major factors! Will gold continue to rise?The past six months may have been dizzying, but a clear theme has emerged since U.S. President Donald Trump returned to the White House: It’s good news for the gold market.
Although gold prices broke through $3,500 an ounce nearly three months ago, setting a new record high, five key factors that have emerged since the start of Trump’s second term are likely to continue to support gold prices in the coming months. These factors may even prove that the precious metal is becoming a core asset class in investors’ portfolio strategies.
David Miller, co-founder and chief investment officer of Catalyst Funds, said that as the market enters the third quarter, gold remains a standout asset class that “provides both a hedge against the potential risks of geopolitical conflict and a break from the erosion of fiat currencies.”
The first key factor supporting gold is demand from central banks, which indicates that the market has weakened confidence in the U.S. dollar. Miller pointed out in emailed comments that central bank demand is surging, and the BRICS countries, especially China and India, are accelerating the accumulation of gold reserves “as part of a broader de-dollarization strategy.” According to a report released by the World Gold Council on Wednesday, the People’s Bank of China’s official gold holdings have climbed for eight consecutive months.
David Russell, head of global market strategy at TradeStation, said the global tariffs threatened and implemented by Trump have accelerated the "de-dollarization process." De-dollarization refers to efforts by some countries to reduce their reliance on the U.S. dollar as a reserve currency.
"Trade is becoming less dependent on the U.S. end market and less dependent on the dollar. This is more like the 19th century than the era after World War I and World War II," Russell said in emailed comments. "This trend back to the old model is creating structural demand for gold after decades of neglect. Fiat currencies are in decline," he added.
Russell also said the decline in the credit quality of developed country governments, such as the United States, is also a major concern for the market. "We have lost our AAA rating from the three major rating agencies because of growing deficits and looming pressure on unfunded liabilities such as Social Security," he said, referring in part to Moody's downgrading its top credit rating for the United States in May. "After decades of procrastination, we are running out of ways to go."
That said, trade policy is a third factor affecting gold. Russell said that "large budget deficits or increased tariffs" would reduce demand for U.S. Treasuries, supporting gold prices.
With both 2-year and 10-year Treasury yields falling so far this year and real rates under pressure from inflation, "the opportunity cost of holding gold is falling," noted Catalyst Funds' Miller. That's leading to a fourth potential support for gold -- a resurgent interest in gold exchange-traded funds and other alternatives.
In the first half of 2025, North America led the growth in global gold ETF inflows, according to the World Gold Council. Global physically-backed gold ETFs saw inflows of $38 billion in the first half of this year, marking the strongest half-year performance since the first half of 2020, according to the World Gold Council.
Finally, from a technical perspective, gold prices have held above $3,250 an ounce for much of June, Miller said. That shows signs of "a potential breakout as equity market volatility returns," he said. Gold for August delivery closed at $3,359.10 an ounce on Wednesday.
“Gold is not just a crisis hedge, it is becoming a core asset class in modern portfolio strategies.” Miller said that the current macroeconomic environment “justifies a meaningful allocation to gold and gold-related strategies.”
He said: “The combination of fragile stock market sentiment, uncertain policy direction and structural macro headwinds reinforces our view that gold is not just a crisis hedge, it is becoming a core asset class in modern portfolio strategies.” PEPPERSTONE:XAUUSD ACTIVTRADES:GOLD ICMARKETS:XAUUSD ACTIVTRADES:GOLD EIGHTCAP:XAUUSD VELOCITY:GOLD

Bitcoin Strategic Compression Beneath the Cloud Gate.⊣
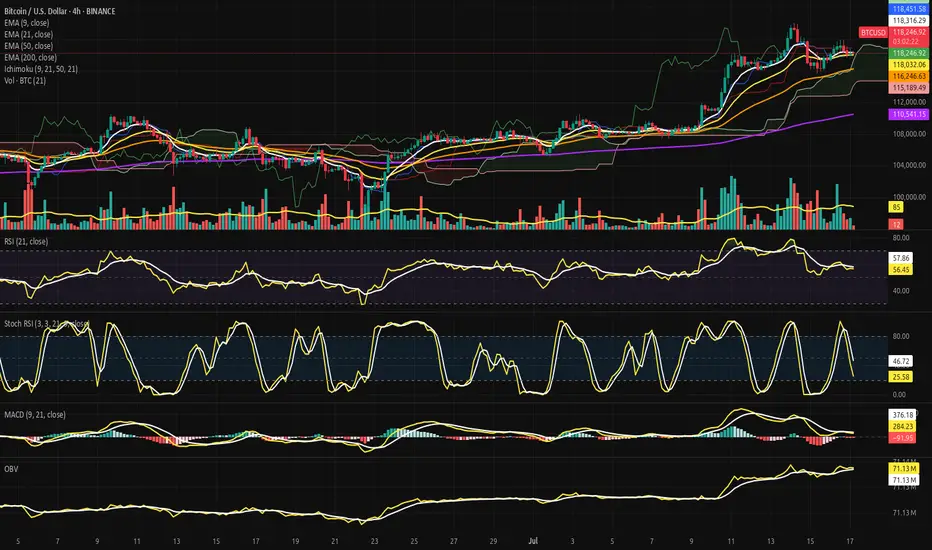
⟁ BTC/USD - BINANCE - (CHART: 4H) - (July 17, 2025).
◇ Analysis Price: $118,099.62.
⊣
⨀ I. Temporal Axis - Strategic Interval – (4H):
▦ EMA9 - (Exponential Moving Average - 9 Close):
∴ EMA9 is currently positioned at $118,286.83, marginally above the current price of $118,099.62;
∴ The slope of the EMA9 has begun to turn sideways-to-downward, indicating loss of short-term acceleration;
∴ The price has crossed below EMA9 within the last two candles, suggesting an incipient rejection of immediate bullish continuation.
✴️ Conclusion: Short-term momentum has weakened, positioning EMA 9 as immediate dynamic resistance.
⊢
▦ EMA21 - (Exponential Moving Average - 21 Close):
∴ EMA21 is measured at $118,018.67, positioned slightly below both price and EMA9, indicating a recent tightening of trend structure;
∴ The slope of EMA21 remains positive, preserving the medium-range bullish structure intact;
∴ EMA21 has been tested multiple times and held as support since July 15 - confirming tactical reliability as dynamic floor.
✴️ Conclusion: EMA21 stands as a critical pivot zone; any sustained breach would denote structural stress.
⊢
▦ EMA50 - (Exponential Moving Average - 50 Close):
∴ EMA50 is currently located at $116,240.85, well below current price action;
∴ The curve maintains a healthy positive inclination, affirming preservation of broader intermediate trend;
∴ No contact or proximity to EMA50 over the last 20 candles - indicating strong bullish detachment and buffer zone integrity.
✴️ Conclusion: EMA50 confirms medium-term bullish alignment; not yet challenged.
⊢
▦ EMA200 - (Exponential Moving Average - 200 Close):
∴ EMA200 stands at $110,539.69, forming the base of the entire 4H structure;
∴ The gradient is gradually rising, reflecting accumulation over a long time horizon;
∴ The distance between price and EMA200 reflects extended bullish positioning, yet also opens risk for sharp reversion if acceleration collapses.
✴️ Conclusion: Long-term structure remains bullish; early signs of overextension exist.
⊢
▦ Ichimoku Cloud - (9, 21, 50, 21):
∴ Price is currently above the Kumo (cloud), placing the pair within a bullish regime;
∴ Tenkan-sen (conversion) and Kijun-sen (base) lines show narrowing separation, suggesting momentum compression;
∴ Senkou Span A > Span B, and the cloud ahead is bullishly twisted, though thinning - indicating potential vulnerability despite structural advantage.
✴️ Conclusion: Bullish regime intact, but loss of momentum and cloud compression warrant caution.
⊢
▦ Volume + EMA21:
∴ Current volume for the latest candle is 3 BTC, compared to the EMA21 of 84 BTC;
∴ This indicates an extremely low participation phase, often associated with distribution zones or indecisive consolidation;
∴ Previous impulsive candles (July 15) reached well above 100 BTC - the current contraction is stark and strategically significant.
✴️ Conclusion: Absence of volume threatens trend continuation; energy depletion apparent.
⊢
▦ RSI - (21) + EMA9:
∴ RSI (21) is positioned at 55.73, marginally above neutral zone;
∴ EMA 9 of RSI is 57.71, crossing downward against RSI - bearish micro signal;
∴ No divergence is present versus price action - oscillator confirms current stagnation rather than exhaustion.
✴️ Conclusion: RSI losing strength above neutral; lacks momentum for breakout, but no capitulation.
⊢
▦ Stoch RSI - (3,3,21,9):
∴ %K is 21.44, %D is 45.34 - both pointing downward, in deacceleration phase;
∴ Recent rejection from overbought zone without full reset into oversold - signaling weak bullish thrust;
∴ Historical cycles show rhythmical reversals near current levels, but only with supportive volume, which is absent now.
✴️ Conclusion: Short-term momentum failed to sustain overbought breakout - micro-correction expected.
⊢
▦ MACD - (9, 21):
∴ MACD line is at -104.80, Signal line at 268.16 - large separation, histogram deeply negative;
∴ The bearish crossover occurred with declining volume, implying fading momentum rather than aggressive sell-off;
∴ No bullish divergence formed yet - continuation of correction remains technically favored.
✴️ Conclusion: MACD confirms trend exhaustion; no reversal in sight.
⊢
▦ OBV + EMA 9:
∴ OBV is 71.13M, perfectly aligned with its EMA9 - indicating equilibrium in volume flow;
∴ No directional bias in accumulation or distribution - flatlining suggests passive environment;
∴ Prior OBV uptrend has stalled since July 15 - reinforcing narrative of hesitation.
✴️ Conclusion: Institutional flow is neutral; no aggressive positioning detected.
⊢
🜎 Strategic Insight - Technical Oracle: The current price structure presents a classic post-impulse compression configuration within a preserved bullish environment. Despite the higher timeframe alignment, multiple short-term indicators exhibit tactical dissonance and signs of momentum decay. This inconsistency reflects a market caught between structural optimism and tactical hesitation.
♘ Key strategic signals - Structural Alignment:
∴ All major EMA's (9, 21, 50, 200) remain stacked in bullish order with no bearish crossovers imminent;
∴ Price remains above the Ichimoku Cloud and above EMA50 - both confirming structural dominance by buyers.
♘ Momentum Degradation:
∴ RSI (21) is drifting below its EMA9, weakening the momentum required for further upside continuation;
∴ Stochastic RSI has rolled over aggressively, failing to reach oversold before reversing - mid-cycle weakness is confirmed.
♘ Volume Collapse:
∴ The current volume profile is critically weak - 3 Bitcoin against an average of 84 Bitcoins (EMA21);
∴ Price attempting to sustain above EMA's with no conviction signals distribution or passivity.
♘ MACD & OBV:
∴ MACD histogram remains deep in negative territory, and no bullish crossover is visible;
∴ OBV is flat - neither accumulation nor distribution dominates, leaving directional thrust suspended.
✴️ Oracle Insight:
∴ The technical field is Structurally Bullish, but Tactically Compressed.
∴ No breakout should be expected unless volume decisively returns above baseline (84 Bitcoins EMA);
∴ Below $117,800, the structure risks transition into a corrective phase;
∴ Above $118,450, potential trigger zone for bullish extension if accompanied by volume surge.
♘ Strategic posture:
∴ Wait-and-observe regime activated;
∴ No entry condition satisfies both structure and momentum at present;
∴ Tactical neutrality is advised until confirmation.
⊢
∫ II. On-Chain Intelligence - (Source: CryptoQuant):
▦ Exchange Reserve - (All Exchanges):
∴ The total Bitcoin reserves held on all exchanges continue a sharp and uninterrupted decline, now at ~2.4M BTC, down from over 3.4M in mid-2022;
∴ This downtrend has accelerated particularly after January 2025, with a visible drop into new lows - no accumulation rebound observed;
∴ Historically, every prolonged depletion of exchange reserves correlates with structural bullish setups, as supply becomes increasingly illiquid.
✴️ Conclusion: On-chain supply is structurally diminishing, confirming long-term bullish regime intact - mirrors technical EMA alignment.
⊢
▦ Fund Flow Ratio - (All Exchanges):
∴ Current Fund Flow Ratio stands at 0.114, which is well below historical danger thresholds seen near 0.20-0.25 during local tops;
∴ The ratio has remained consistently low throughout the 2025 uptrend, indicating that on-chain activity is not directed toward exchange-based selling;
∴ Spikes in this indicator tend to precede local corrections - but no such spike is currently present, reinforcing the notion of non-threatening capital flow.
✴️ Conclusion: Capital is not rotating into exchanges for liquidation - volume weakness seen in 4H chart is not linked to sell intent.
⊢
▦ Miners' Position Index - (MPI):
∴ The MPI sits firmly below the red threshold of 2.0, and currently ranges in sub-neutral levels (~0.5 and below);
∴ This suggests that miners are not engaging in aggressive distribution, and are likely retaining Bitcoin off-exchange;
∴ Sustained low MPI readings during price advances confirm alignment with institutional and long-term accumulation behavior.
✴️ Conclusion: Miner behavior supports structural strength - no mining-induced supply pressure present at this stage.
⊢
🜎 Strategic Insight - On-Chain Oracle:
∴ Across the three strategic indicators, no on-chain evidence supports short-term weakness;
∴ Supply is declining - (Exchange Reserve ↓);
∴ Funds are not preparing for exit - (Flow Ratio stable);
∴ Miners are not selling - (MPI subdued).
✴️ This constellation reinforces the thesis of Structural Bullishness with Tactical Compression, and suggests that any pullback is not backed by foundational stress.
⊢
𓂀 Stoic-Structural Interpretation:
∴ The multi-timeframe EMA stack remains intact and aligned - (9 > 21 > 50 > 200);
∴ Price floats above Ichimoku Cloud, and above EMA21 support, confirming elevated positioning within a macro bull channel;
∴ On-chain metrics confirm supply contraction, miner retention, and absence of fund rotation toward exchanges - structure remains sovereign;
∴ RSI - (21) slips under its EMA9 with low amplitude, indicating absence of energetic flow;
∴ Stoch RSI fails to reset fully and points downward - suggesting premature momentum decay;
∴ MACD histogram remains negative, while volume is significantly beneath EMA baseline (3 BTC vs 84 BTC);
∴ Price faces resistance at Kijun-sen ($118.451), acting as tactical ceiling; no breakout signal detected.
⊢
✴️ Interpretatio Finalis:
∴ Structural integrity remains unshaken - the architecture is bullish;
∴ Tactically, however, the battlefield is fogged - silence reigns in volume, hesitation in oscillators;
∴ A true continuation requires volume resurrection and resolution above $118,450. Until then, neutrality governs the edge.
⊢
⧉
Cryptorvm Dominvs · ⚜️ MAGISTER ARCANVM ⚜️ · Vox Primordialis
⌬ - Wisdom begins in silence. Precision unfolds in strategy - ⌬
⧉
⊢
Ethereum UP UP UPThe Perfect Storm: Multiple Technical Indicators Align for ETH's Next Leg Up
With Ethereum currently trading at $3,429, a comprehensive multi-faceted technical analysis reveals compelling evidence for continued bullish momentum through the remainder of 2025. Let's dive into the convergence of powerful technical signals pointing to ETH's next major move.
RSI: Hidden Strength Behind the Momentum
While Ethereum's daily RSI hovers around 72-73, typically considered overbought territory, this actually represents strength rather than exhaustion in a powerful bull trend. Historical analysis shows that during Ethereum's strongest rallies, RSI can maintain readings above 70 for extended periods, often reaching 80-85 before meaningful corrections.
The weekly RSI at 66 is particularly telling—showing robust momentum without reaching extreme levels. This creates the perfect scenario: strong enough to maintain upward pressure, yet not overheated enough to trigger immediate profit-taking. This "Goldilocks zone" for RSI often precedes the most explosive phases of bull markets.
Wyckoff Accumulation: The Smart Money Footprint
The recent price action perfectly aligns with Wyckoff's "Re-accumulation After Spring" pattern:
The May 2025 low represented a classic "Spring" that flushed out weak hands
The subsequent rally formed a textbook "Sign of Strength" (SOS)
We've completed the "Backup" phase with higher lows
Current price action suggests we're at the "Last Point of Support" (LPS)
According to Wyckoff methodology, this LPS typically precedes the most powerful "Mark-Up" phase—where institutional accumulation transitions to public participation and price discovery accelerates dramatically. The completion of this pattern projects a move to the $4,500-$5,000 range within the forecast period.
Order Blocks: Institutional Footprints Reveal the Path Forward
Order block analysis reveals significant institutional buying between $3,000-$3,200, creating a formidable support zone. More importantly, there's a notable absence of major selling order blocks above current levels until approximately $3,800-$4,000.
This "clean air" above current prices suggests minimal resistance and the potential for rapid price appreciation once momentum builds. The most significant buy-side order blocks have been forming during recent consolidations, indicating smart money accumulation before the next leg up.
Volume Profile: The Silent Confirmation
Volume analysis provides the confirmation needed to validate our bullish thesis:
Rising prices accompanied by increasing volume (particularly on up-days)
Volume Profile shows thin areas above $3,500, suggesting potential for rapid price discovery
The Volume-Weighted Average Price (VWAP) continues to slope upward, confirming the strength of the trend
The Volume Point of Control (VPOC) has shifted higher in recent weeks, indicating accumulation at higher prices—a classic sign of institutional confidence.
Fibonacci Projections: Mathematical Roadmap to Higher Targets
Using the recent swing low of $2,150 (May 2025) to the current level as our base measurement:
The 161.8% extension projects a target of approximately $4,200
The 200% extension suggests a move toward $4,700
The 261.8% extension (often reached in strong bull markets) points to $5,400+
What's particularly bullish is that these Fibonacci extensions align perfectly with key psychological price levels and unfilled liquidity pools above the market.
Elliott Wave Structure: The Roadmap to $5,000
The current Elliott Wave count suggests we're in the early stages of a powerful Wave 3 of 5 from the May lows:
Wave 1: $2,150 to $2,800
Wave 2: Pullback to $2,450
Wave 3: Currently underway, targeting $4,200-$4,500 (typical Wave 3 = 1.618 × Wave 1)
Wave 4: Future consolidation likely in the $3,800-$4,000 range
Wave 5: Final push potentially reaching $4,800-$5,200
Wave 3 is typically the longest and most powerful in the Elliott sequence, suggesting we're entering the most explosive phase of this bull cycle.
Price Projection Timeline
July-August 2025:
Initial push through the $3,600 resistance level, followed by accelerating momentum toward $3,800-$4,000. Any pullbacks will find strong support at $3,200, creating ideal entry opportunities for those who missed the initial breakout.
September 2025:
Breakthrough of the psychological $4,000 barrier, triggering increased media attention and retail participation. This phase could see rapid price discovery to $4,200-$4,400 as volume expands dramatically.
October-November 2025:
Final wave extension pushing ETH toward the $4,800-$5,200 range, potentially culminating in a blow-off top characteristic of Wave 5 completions. This represents a 40-50% appreciation from current levels.
The Confluence That Cannot Be Ignored
What makes this analysis particularly compelling is the rare confluence of multiple technical frameworks all pointing to the same conclusion. When Wyckoff accumulation patterns, Elliott Wave projections, Fibonacci extensions, RSI momentum, and order block analysis all align, the probability of the projected outcome increases exponentially.
Smart money is positioning for this move now, as evidenced by the order block formation and volume patterns. For the strategic investor, the current price level—despite being near recent highs—represents an attractive entry point before the next major leg up in Ethereum's journey.
The technical roadmap is clear: Ethereum is poised for a significant appreciation through the remainder of 2025, with multiple technical frameworks projecting targets in the $4,500-$5,200 range by year-end.

AUDNZD Breakout: Long Opportunity in Ascending ChannelToday I want to share with you a Long position opportunity in AUDNZD ( OANDA:AUDNZD ).
Let's first take a brief look at the AUDNZD fundamentals .
RBNZ kept rates at 3.25% , signaling likely further cuts in August.
RBA paused at 3.60% , but dovish bias remains; markets expect more easing ahead.
As NZD is more pressured by immediate rate cuts than AUD, the fundamental setup favors a bullish AUDNZD.
Now let's find a long position for AUDNZD using technical analysis .
AUDNZD seems to have managed to break through the Heavy Resistance zone(1.0963 NZD-1.0870 NZD) and is moving near the Support zone(1.0964 NZD-1.0954 NZD) on the 1-hour time frame .
AUDNNZD is also moving in an Ascending Channel .
I expect AUDNZD to rise at least to the Resistance lines , the second target is the Resistance zone(1.103 NZD-1.0993 NZD).
Note: Stop Loss(SL): 1.0944 NZD
Please respect each other's ideas and express them politely if you agree or disagree.
Australian Dollar/New Zealand Dollar Analyze (AUDNZD), 1-hour time frame.
Be sure to follow the updated ideas.
Do not forget to put a Stop loss for your positions (For every position you want to open).
Please follow your strategy and updates; this is just my Idea, and I will gladly see your ideas in this post.
Please do not forget the ✅' like '✅ button 🙏😊 & Share it with your friends; thanks, and Trade safe.

"PEL is having formed a Cup and Handle pattern
*Chart Pattern Identified**:
A **Cup with Handle** formation has been identified on the daily/weekly chart of **Piramal enterprise**, signaling a potential bullish breakout. This classic continuation pattern typically leads to strong upward moves once the handle breakout is confirmed.
🔍 **Breakout Levels and Price Targets**
1. **Primary Breakout Level – ₹1275**
* This marks the neckline of the **Cup with Handle** formation.
* A confirmed breakout at ₹1275 would validate the pattern.
(based on the measured move from the depth of the cup added to the breakout point)
* Acts as a **pre-breakout resistance** or consolidation level.
* A **daily or weekly close above ₹1,275** with strong volume would indicate early momentum and buyer interest.
* **Target after this level is breached**: ₹1275 (primary breakout zone), and if sustained, an extended target of **₹1820**.
### 📌 **Technical Outlook**
| Level | Significance | Action |
| ------ | ------------------------ | --------------------------------------------------- |
| ₹1275| Cup with handle breakout | Key confirmation zone; breakout of pattern |
| ₹1820 | Extended target | Projected move after full breakout confirmation |
---
### 📈 **Trade Strategy**
* **Entry Option 1**: Anticipatory buy near ₹1,275.
* **Entry Option 2**: Breakout confirmation buy above ₹1275 with higher risk-reward toward ₹1820.
* **Volume Confirmation**: Essential at 1275 levels.
* **Stop-loss**: Dynamic trailing stop-loss below handle lows or breakout support zones depending on entry.
---
### ⚠️ **Risk Management & Considerations**
* Ensure confirmation via **volume expansion** and **daily/weekly close** above key breakout zones.
* Be cautious of false breakouts, especially if moves happen on low volume or during broader market weakness.
* Monitor sectoral momentum (capital goods, engineering, or mining equipment) as it may influence breakout strength.

Key level for GBPUSDKey level for the bulls highlighted in green. We've pulled deeeep into the discount of the daily bullish leg, which is ideal. We're more than likely going to see the sentiment reports flip to majority bearish, which again, further confluence (for me at least). Waiting for a clear 1-4h bullish BOS, liquidity sweep and imbalance. Only then will I look for a long term swing trade to the upside.
Lots of news this week which coincide well with level. From my experience, we may see a nice range created around this level, and then when news hits we'll start the move higher. That's my take at least, let me know your thoughts.

NQ Weekly Recap-Projection 13.07.2025NQ Weekly Recap + Outlook
1️⃣ Recap:
NQ made a new All-Time High, but the breakout ended up being a deviation. Price got rejected and started pulling back.
This signals potential weakness and suggests price may want to explore lower levels.
2️⃣ Bearish Scenario:
📍Target: Daily Swing low (Blue line)
📍Deeper target: Weekly Fair Value Gap (Purple zone)
I’ll look for LTF confirmations around these zones to position for potential longs.
3️⃣ Bullish Catalyst Watch:
There’s increasing speculation that Powell may resign this week.
If that happens, we could see:
✅ Strong bullish momentum
✅ Little to no retracement
✅ Immediate push into new ATHs
Weekly Plan Summary:
🔸 Scenario 1 - Pullback Continuation:
Look for reactive long setups at Daily Swing or W FFVG zone.
🔸 Scenario 2 - Powell Resignation:
Expect a breakout move with momentum — potentially no retrace.
Stay nimble. Trade what the chart confirms, not what the news promises.

FX Wars Episode 6 - The return of the USDA simple idea, which I will gradually fill with life:
The USD returns and with it the claim to its FX throne.
Act 1:
📊🔮🇺🇲 US retail sales, which will be published today at 14:30, will be higher than consensus expectations.
🟡-> the US consumer is alive and well and will continue to keep the US economy afloat.
Further acts will follow ✅️
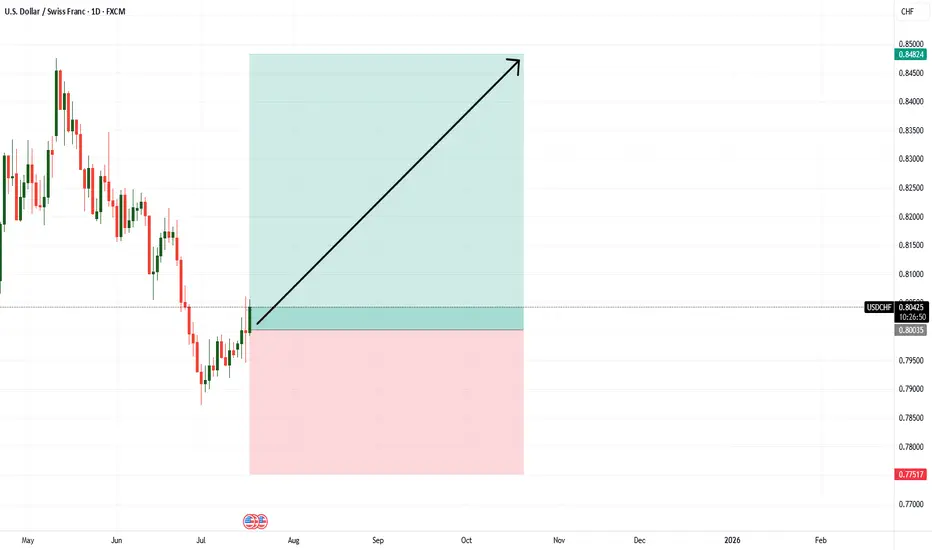
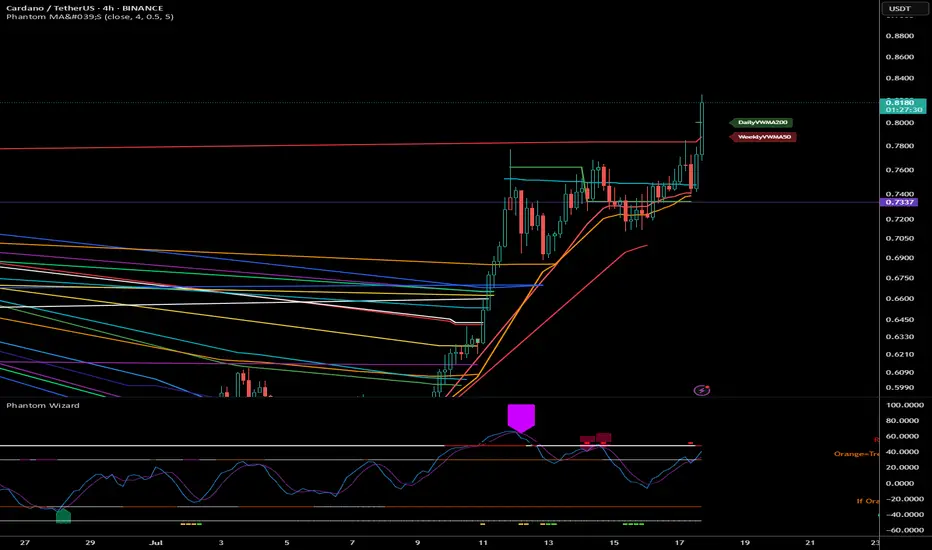
ADA all the way Cardano's Ascent: A Technical Outlook for Q3-Q4 2025
Breaking Through Resistance: Cardano's Path to $1.00 and Beyond
Following a period of extended consolidation, Cardano (ADA) has demonstrated a significant shift in character, breaking out decisively from a key resistance zone. Currently trading near $0.82 as of July 18, 2025, ADA has entered a new phase of bullish momentum. This analysis will dissect the technical landscape to project its potential trajectory through the end of the year, identifying critical price levels and probable targets.
Current Market Context
After consolidating in a range between $0.70 and $0.77 for several weeks, ADA has executed a powerful breakout, surging over 15% in the last few days to establish a multi-month high at $0.825. This move signals a clear victory for buyers and a potential end to the preceding sideways market structure. The immediate challenge for bulls is to defend this breakout level and convert prior resistance into firm support, setting the stage for the next major leg higher.
RSI Analysis: Emerging Strength with Room to Run
The recent price surge has propelled the daily Relative Strength Index (RSI) into overbought territory, currently reading above 70. While this often signals a short-term exhaustion and suggests a minor pullback or consolidation is likely, the underlying momentum on higher timeframes remains constructive.
The weekly RSI is trending sharply upwards from the neutral 50-level but remains well below the extreme overbought readings (80+) that have historically marked major cycle tops for ADA. This divergence between short-term overbought conditions and long-term momentum capacity is a classic sign of a healthy, strengthening trend. It indicates that while a brief pause is probable, the primary path of least resistance remains upward for the coming months.
Price Action & Volume Analysis: The Anatomy of a Breakout
The price action leading up to this point exhibits classic signs of accumulation followed by a markup phase:
Accumulation Phase: The trading range between $0.70 and $0.77 showed contracting volatility and was likely a period of "cause-building," where informed market participants accumulated positions.
Sign of Strength (SOS): The recent impulsive move from $0.77 to over $0.82 represents a clear SOS. This breakout was likely accompanied by a significant increase in volume, confirming the market's conviction and overwhelming sellers who were active at the resistance level.
A successful retest of the breakout zone at $0.75 - $0.77 on diminishing volume would be the strongest possible confirmation of a new, sustainable uptrend.
Supply and Demand Zone Analysis: Charting the Path Forward
The recent breakout has fundamentally altered the market structure, turning a key supply zone into a new floor of demand.
Major Demand Zone (New Support): A critical demand zone has now been established between $0.75 - $0.77. This area, formerly resistance, is now the most important level for bulls to defend to maintain the bullish structure.
Secondary Support Cluster: Should the primary zone fail, the next significant support lies at $0.68 - $0.70, the floor of the previous accumulation range.
Overhead Supply Zones: Unlike an asset at all-time highs, ADA faces historical resistance. The next major supply zones are located near $0.95 and, more significantly, the psychological and technical barrier at $1.10 - $1.15.
Fibonacci Extension Framework: Projecting Bullish Targets
Using the recent swing low of the accumulation phase (approx. $0.70) and the recent swing high ($0.825), we can project logical price targets for the current impulse wave:
The 127.2% extension projects a target of approximately $0.88.
The 161.8% extension, a common target for strong trends, points toward $0.92.
A more extended move to the 200% extension suggests a potential test of $0.97, aligning closely with the psychological $1.00 level.
These Fibonacci-derived targets provide a clear roadmap for the potential upside if the current bullish momentum is sustained.
Price Projection Timeline
Late July - August 2025:
Expect a period of consolidation or a healthy pullback. The overbought daily RSI suggests the market needs to pause. A retest of the $0.77 support level would be a prime opportunity for trend-continuation entries. A successful defence of this zone is critical.
September - October 2025:
Following the consolidation, the trend is expected to resume, targeting the Fibonacci extension levels of $0.88 - $0.92. This move would represent the confirmation of the new uptrend and would likely attract a second wave of buyers.
November - December 2025:
Should the Q4 market environment remain favourable, a push toward the major psychological and technical resistance at $1.00 - $1.15 is highly probable. This would represent a significant milestone and could trigger a more substantial corrective phase as long-term holders take profits.
Support Zones:
Primary: $0.75 - $0.77 (The breakout point; must hold)
Secondary: $0.68 - $0.70 (Floor of the previous range)
Resistance & Target Zones:
Immediate: $0.825 (Recent high)
Target 1: $0.88 - $0.92 (Fibonacci cluster)
Target 2: $0.97 - $1.00 (Fibonacci & psychological level)
Major Resistance: $1.10 - $1.15 (Historical supply zone)
Conclusion: The Road to One Dollar
The technical evidence strongly suggests that Cardano has initiated a new bullish impulse wave. The breakout from its multi-week consolidation range is a significant technical event that has shifted the market bias firmly in favour of the bulls. While a short-term pullback to retest the breakout level around $0.77 is a high probability, this would likely serve as a healthy reset before the next major advance.
Based on the confluence of price action, momentum analysis, and Fibonacci projections, a move toward the $0.95 - $1.15 range is a realistic objective for Cardano by the end of 2025.
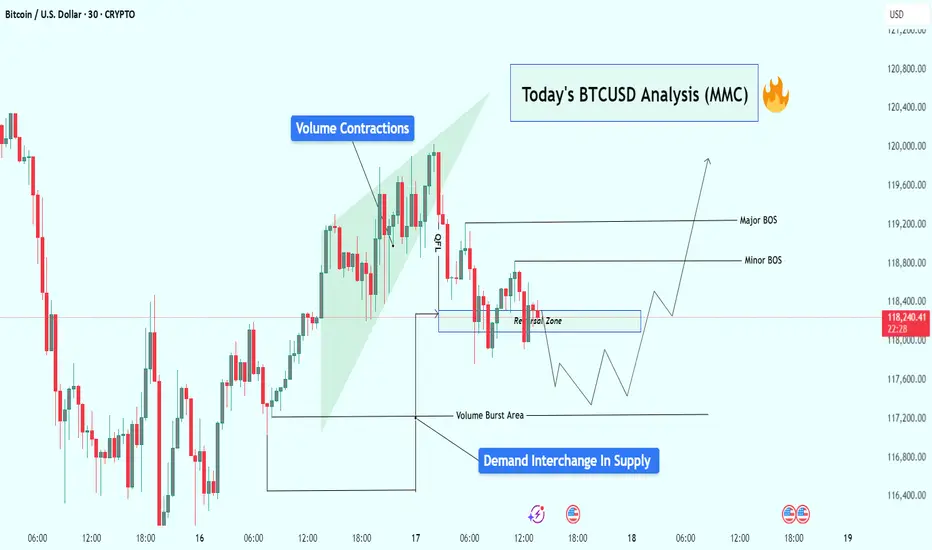
BTCUSD Analysis : Reversal Brewing from Volume Burst Demand Zone🧠 Overview:
Bitcoin is currently showing signs of a potential bullish reversal, following a classic Market Maker Cycle (MMC) pattern. The price action has been clean, respecting both volume dynamics and structural levels, setting the stage for a possible breakout above key areas of interest.
Let’s dive into the detailed breakdown:
🔍 Key Technical Elements:
1️⃣ Volume Contractions – Early Sign of Momentum Shift
At the top left of the chart, we observe a sharp upward move, followed by volume contraction within a rising wedge. This typically represents:
Absorption of orders
Reduced volatility
Market indecision
This kind of structure often precedes a reversal or aggressive breakout, depending on how price behaves near liquidity zones.
2️⃣ Fakeout/Trap Above – Classic MMC Manipulation Phase
After the rising wedge formed, BTC experienced a quick fakeout (stop hunt) just above the highs, then dropped sharply. This was the manipulation leg — a clear signal that liquidity above the wedge was taken and smart money is now repositioning.
🧠 Market makers love to trap breakout traders before moving the opposite way. The drop confirms manipulation is complete.
3️⃣ Reversal Zone + Demand Interchange into Supply
Price then entered a marked reversal zone which was previously an area of demand — now interchanging into supply. This zone is critical because:
It aligns with volume burst zones
It acted as support turned resistance
Multiple rejections confirm order flow shift
This tells us smart money is now testing this area to accumulate or trap sellers.
4️⃣ Volume Burst Area – Institutional Involvement Confirmed
We can clearly identify a Volume Burst Area, where price spiked with strong momentum — this is not retail trading. This zone is now being revisited for a potential bullish re-accumulation.
Expect reaction from this area, as it likely contains unmitigated buy orders from institutions.
5️⃣ Break of Structure (BOS) Mapping:
Minor BOS: Breaks short-term lower highs, showing early intent.
Major BOS: Breaks significant structure, confirming shift in trend direction.
A successful retest of demand and then break of both BOS levels will likely lead to a strong bullish continuation.
📈 Trade Plan & Potential Price Path:
There are two potential bullish entry strategies forming:
✅ Scenario 1: Clean Breakout Plan
Price holds the current reversal zone
Breaks Minor BOS, then Major BOS
Retest of BOS confirms continuation
📍 Target: $119,600+
✅ Scenario 2: Liquidity Sweep Entry
Price dips lower into Volume Burst Area
Sweeps liquidity below and prints a bullish reaction
Enters from discount zone
Same upside targets apply
🧠 This would be a smart money entry — entering from the lowest point of pain for retail traders.
🧵 Final Thoughts:
BTC is setting up beautifully for a reversal continuation pattern within the MMC framework. We’ve seen:
📉 Initial drop (accumulation phase)
🎭 Fake breakout (manipulation phase)
📈 Upcoming expansion (breakout phase)
All signs point to a high-probability move upward, especially if price confirms with BOS + retest. Be patient, wait for price action to align with structure and volume clues.
Gold Market Analysis (XAU/USD) – MMC Analysis + Liquidity Target🧠 Market Context Overview:
Gold recently experienced a highly impulsive move from a major demand zone, suggesting strong smart money activity. The market is currently in the redistribution phase of the MMC (Market Maker Cycle), transitioning between a reversal impulse and a liquidity targeting move.
Let’s dissect the key zones, structure, and confluences that support the ongoing market narrative.
📍 1. Strong Demand Reaction (3X Demand Spike):
We start with a triple-tap demand rejection, where the price sharply reversed to the upside. This kind of movement typically represents:
Institutional Entry Points
Stop-Hunt Below Previous Lows
Liquidity Grab Before Expansion
This strong bullish engulfing candle signifies position building by smart money, often the beginning of a significant leg up.
🧱 2. Reversal Zone & Liquidity Imbalance:
The highlighted green zone between $3,370–$3,375 is crucial. Why?
It’s an inefficiency zone where price moved too fast with low resistance.
This created a liquidity void that typically needs to be revisited (also known as FVG – Fair Value Gap).
The area also coincides with structural resistance, making it a high-probability target for price to revisit and reject again or break through with intent.
📌 Smart money always returns to areas of unfilled liquidity to close their positions or trap late retail entries.
🔺 3. Volume Contraction (Wedge Pattern Formation):
After the explosive push upward, the market started compressing, forming a descending wedge — a classical volume contraction pattern.
What does this mean?
Volatility is decreasing
Liquidity is building up
Big breakout is expected
It’s like pulling a slingshot — the more it contracts, the stronger the release will be. The direction will depend on which side breaks first.
🔁 4. Previous Structure Flipped (Support turned Resistance):
You’ll notice a key level around $3,353–$3,355 acting as a flipped structure.
This was previously a support zone that got broken.
Now it’s acting as resistance — a classic example of support/resistance flip.
This adds confluence to the idea of a possible rejection or reaction in this area.
🧠 Structure flipping is a smart money trick — break structure, retrace to trap liquidity, and then run the opposite direction.
📊 5. MMC Logic – Market Maker Cycle in Play:
Here’s how the MMC is flowing:
Accumulation (bottom consolidation)
Manipulation (liquidity sweep below demand)
Expansion (aggressive upward move)
Contraction (volume dies, price slows down)
Now we’re waiting for the next manipulation or expansion phase.
The current wedge is the pause before the next move, which could fill liquidity in the reversal zone or go lower to sweep resting sell-side liquidity.
🎯 Trading Scenarios:
✅ Bullish Bias (if breakout happens):
Break and close above the wedge
Retest previous flipped structure successfully
Target: Liquidity zone at $3,370–$3,375
🎯 This move would fill the imbalance and potentially tag sell-side liquidity sitting at the top.
❌ Bearish Bias (if rejection holds):
Failure to break above flipped structure
Breakdown from the wedge
Target: Demand origin around $3,325–$3,315
🧲 A move lower would make sense if liquidity remains uncollected beneath the range.
🧵 Final Thoughts:
Gold is currently in a high-probability setup zone. We have:
✅ Clear demand reaction
✅ Imbalance above
✅ Volume contraction
✅ Flipped structure
✅ Strong MMC confluence
Now it's a waiting game. Let the market show its hand — either a clean breakout with volume or a fakeout/rejection and reversal.
📌 "Trade what you see, not what you think. Let the levels and liquidity guide your decision."

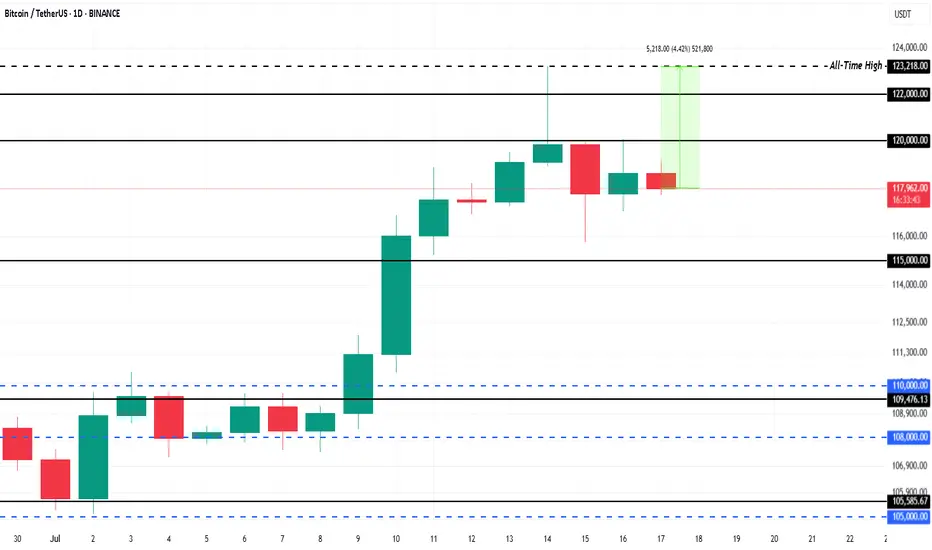
$1.5 Billion ETF Inflows Could Push Bitcoin Price 4% to New ATHBINANCE:BTCUSDT is currently trading at $118,325, facing resistance at the $120,000 level. This resistance is crucial for Bitcoin if it wants to break back to its ATH of $123,218 . The 4.4% gap to reach the ATH indicates potential for growth, but Bitcoin needs to secure support above $120,000 for this to happen.
This week, spot BINANCE:BTCUSDT exchange-traded funds (ETFs) saw over $1.5 billion in inflows , a significant portion of which occurred in the last 48 hours during Bitcoin’s dip.
The influx of institutional money highlights that investors are confident in Bitcoin’s potential despite the market cooling. If this trend persists, it could propel BINANCE:BTCUSDT price upward, as institutional support provides stability.
If BINANCE:BTCUSDT can hold above $120,000 and push past $122,000, it could continue its ascent toward new all-time highs. The current market conditions and ETF inflows support a bullish outlook, with a significant chance of breaking the resistance.
However, the risk of profit-taking remains , which could lead to a price drop. If BINANCE:BTCUSDT faces selling pressure, it could fall back to $115,000 , erasing a portion of recent gains. This would invalidate the bullish thesis, causing Bitcoin to retest lower support levels.
EURUSD : The trend is still downAfter what Trump said last night, the trend is still down.
I will keep selling.
If we look carefully, 'they' did tell us beforehand that we should keep selling. Just know where to look.
Good luck, and let's make lots of money.

Buying opportunities on EURUSDYesterday, EURUSD saw a sharp spike after reports that Trump might fire the Federal Reserve Chair.
Although this wasn’t confirmed, the news triggered short-term volatility before the market settled down again.
At the moment, EURUSD is reacting to key support levels. Watch for the formation of a higher low and potential signs of a new bullish move.
The goal remains a breakout above the previous high and continuation of the main uptrend.

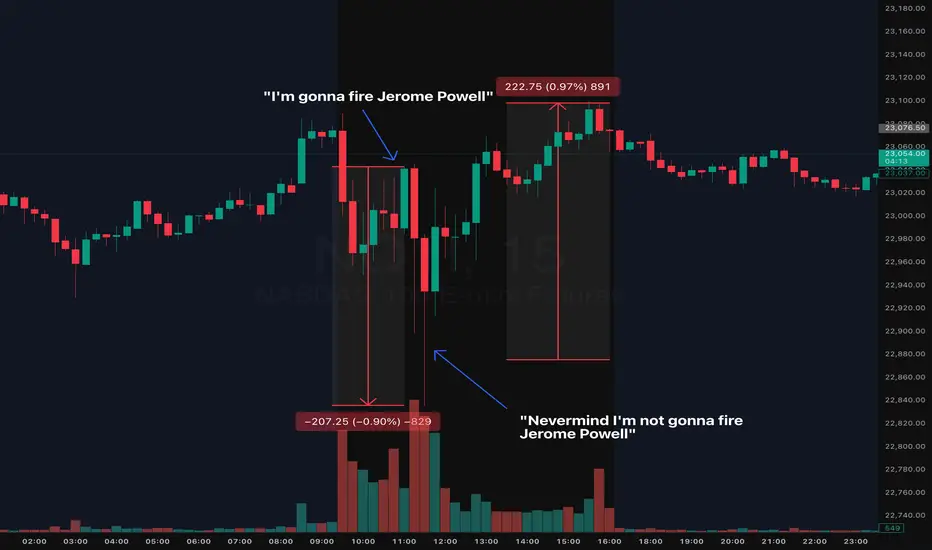
2025 Trading Final Boss: Daily Market Manipulation, The New NormMarking this point in history because we'll likely forget and move on.
During the early hours of the July 16th NYC session, we saw indices quickly flush ( CME_MINI:NQ1! CME_MINI:ES1! ) nearly 1% on the news that Trump will fire Jerome Powell. The dip was bought almost instantly.
Shortly after the dip was bought (roughly 0.50% recovery), guess what? Trump announced, he is "not considering firing Jerome Powell". The dip then recovered and achieved a complete V to finish the day somewhat green. Make what you want of it but always use a stop loss in these tough conditions.
Welcome to 2025 Trading Final Boss