KPIT: From Code to Car – Is This the Next Auto-Tech Multibagger?📊 Technical Chart Insights
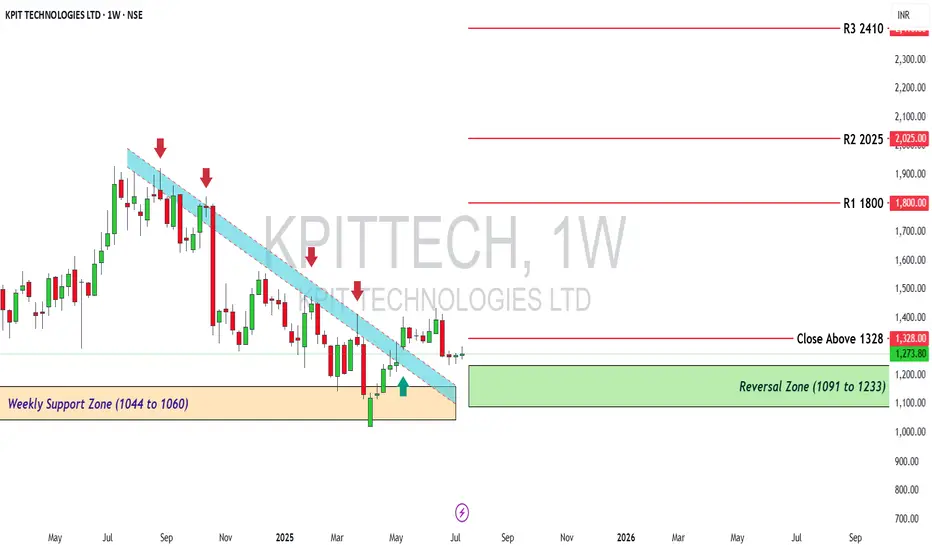
The stock was in a strong downtrend but has now broken above the descending trendline, which is a positive signal.
It has shown a strong reversal from the weekly support zone between ₹1,044 and ₹1,060.
A clear reversal zone is visible between ₹1,091 and ₹1,233 — this is a good accumulation or buy zone for long-term investors.
The stock is currently facing resistance at ₹1,328. A weekly close above this level can confirm a breakout.
If the breakout happens, potential price targets are:
₹1,800 (R1)
₹2,025 (R2)
₹2,410 (R3)
🧠 Investment Strategy Based on Both Views
For Long-Term Investors:
KPIT has strong fundamentals, is in a future-ready business, and is debt-free.
Ideal to buy in dips within ₹1,090 to ₹1,200 range (reversal zone).
Add more if the stock gives a weekly close above ₹1,328.
For Short-Term Traders:
Avoid entries until the stock closes above ₹1,328.
You can enter short-term trades near ₹1,090–₹1,200, with a stop-loss below ₹1,044.
Watch for upside moves towards ₹1,800 or higher if breakout holds.
✅ Strengths
High revenue and profit growth
Strong cash flow and zero debt
High return on equity and capital
Serves leading global auto brands
Positioned well for the EV and autonomous vehicle boom
⚠️ Risks
Valuation is high, so returns may slow in the short term
Relies heavily on global auto industry health
Any correction in global markets can affect KPIT stock
📌 Conclusion
KPIT is a strong company fundamentally and is showing technical signs of reversal.
Ideal for long-term investors looking for growth in auto-tech.
Best approach: buy on dips or breakout above ₹1,328.
Be cautious of short-term volatility but confident in long-term potential.
Disclaimer: lnkd.in
Fundamental Analysis
$HOOD Swing Trade – Riding the Rocket or Chasing the Wick?
🚀 NASDAQ:HOOD Swing Trade – Riding the Rocket or Chasing the Wick? 📈
📅 Posted: July 18, 2025
💡 Strong momentum, but no institutional push – is this the top or just getting started?
⸻
🧠 Multi-AI Model Summary
Model Consensus 🟢 Cautiously Bullish
RSI (Daily): 78.5 → 🚨 Overbought territory
5D/10D Perf: +8.49% / +9.29% → 🔥 Hot trend
Options Flow: Neutral (1:1 call/put) → 💤 No strong hands
Volume: Avg (1.0x) → ❌ Weak confirmation
VIX: Low (<20) → ✅ Swing-friendly environment
“Momentum is there, but it’s skating on thin volume. Institutions are silent. Proceed with caution.”
⸻
🎯 Trade Setup – HOOD Call Option
• Strike: $110.00
• Expiry: August 1, 2025
• Entry Price (Premium): $6.30
• Profit Target: $8.10 (≈ +28.6%)
• Stop Loss: $3.80 (≈ -40%)
• Size: 1 contract
• Confidence: 65%
• Entry Timing: At market open
• Key Watch Zone: Needs breakout above $108 with rising volume for confirmation
⸻
⚠️ Risk Radar
• 📉 RSI 78.5 = high pullback risk
• 🧊 Volume lacks institutional bite
• 📊 Neutral options flow = market unsure
• 🔄 No trade? → If price opens flat or drops below $106 with low volume — sit out
⸻
🧪 Strategy Tip
This is a momentum-chaser’s trade, not a conviction play. If you’re in, monitor aggressively. Take partial profits if momentum fades.
⸻
📊 TRADE SNAPSHOT
{
"instrument": "HOOD",
"direction": "call",
"strike": 110.0,
"expiry": "2025-08-01",
"confidence": 0.65,
"profit_target": 8.10,
"stop_loss": 3.80,
"size": 1,
"entry_price": 6.30,
"entry_timing": "open",
"signal_publish_time": "2025-07-18 14:04:07 UTC-04:00"
}
⸻
🔁 Like + Repost if you’re watching HOOD’s next move
💬 Comment below: Momentum magic or rug risk?

EURGBP Long Project1. Price Drivers: higher timeframe demand
2. Current Trend: up
3. Momentum: bullish
Action: Waiting for entry on the intraday timeframe (entry will be published further)
*Disclaimer: I will not accept liability for any loss or damage, including without limitation to any loss of profit, which may arise directly or indirectly from use of or reliance on such information.

Is Your Altcoin on the Chopping Block?-Update: Originally posted on July 8, 2025… but swiftly vanished into the void by a moderator (rookie mistake—I neglected the sacred posting rules). Turns out, publishing has rules… that I did not interpret accurately?
To my loyal circle of 5 followers: if this feels like déjà vu, my sincerest apologies for the rerun. But with the winds shifting and the drums beating for alts season, I figured it was worth a resurrection.
Let the thrills—and the calls—begin. 🎭📈
Whenever you see “-Update:” that’s the latest as of today — 07/18/25.
Is Your Altcoin on the Chopping Block? 🪓
Brace yourself—this might sting.
Odds are, your favorite altcoin is walking a tightrope. And while I’m not here to spread doom, I am here to give you a wake-up call. Don’t shoot the messenger.
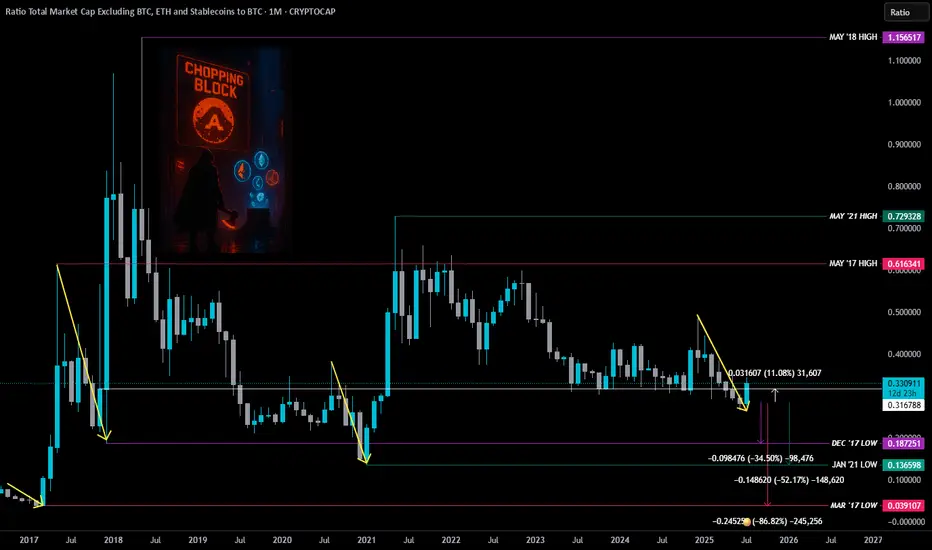
TradingView recently dropped a chart that cuts through the noise: Total3ESBTC.
It’s a ratio of the Total Crypto Market Cap (minus BTC, ETH, and stablecoins) to Bitcoin.
Translation?
👉 A clear, undistorted look at how the altcoin market is actually doing—without ETH clouding the view or stablecoins muddying the waters.
Think of it like night-vision goggles for spotting altcoin strength—or weakness—in the shadows of BTC dominance.
Perfect tool to sniff out market rotation—that sweet spot where Bitcoin hands the baton to alts or rips it back.
So why should you care?
Because the writing's on the wall... and most altcoins might not survive what's coming.
Let’s break it down:
ZOOMED OUT – MONTHLY VIEW 🔭
Before every major altcoin run, there’s always a major low.
You’ll notice three big ones:
🔴 March 2017 (Pink Line)
🟣 Dec 2017 (Purple Line)
🟢 Jan 2021 (Green Line)
Yes, some individual alts have pumped. A few even went full parabolic.
But if altcoins as a whole were ready to fly? They would've taken off already.
-Update: Yes, they finally did it this week… but hold that excitement—there’s more to the story.
Instead, the altcoin ratio broke a critical support (White Line) back in May... and even closed below it. That’s not bullish—it’s a red flag flapping in the wind.
– Update: We just sliced through that white line, but for most alt’s to stay strong, we need a monthly close above it.
Strangely enough (or coincidental, if you believe in coincidences) ...
🗓️ All the major altcoin market highs happened in MAY.
Not once. Not twice. Every. Single. Time.
🔴 May 2017
🟣 May 2018
🟢 May 2021
Call it coincidence. Call it cycle magic.
Maybe it’s a message from the crypto gods—and they don’t whisper for no reason.
So if we just had another May, and the ratio is still sliding with no reversal in sight… ask yourself:
Was that the high?
Or are we still heading toward the low that resets the board?
Here’s the hard pill 💊
If altcoins are ever going to go up again, odds are they’ll need to hit one of these historical lows first.
That’s not a prediction. It’s just how the markets have moved before major alt run.
📉 That means more pain ahead.
We’re talking potential drops of:
🔻 -32% to revisit Dec '17 levels
🔻 -51% to retest Jan '21 lows
🔻 -85% if we go full wipeout to March '17
Harsh? Yeah.
But better you hear it now than wonder “what happened?” when the floor caves in.
The worst part?
Most won’t believe this until it’s already too late.
-Update: Those lows haven’t been tested yet—might be wise to hold off on loading your bags to the brim. Patience pays.
Now here’s the uncomfortable twist:
There’s a legit case to be made that we may never see another “real” alt season again.
Why?
🪙 Liquidity is being siphoned by stablecoins
📈 Speculation is migrating to AI stocks
⚠️ Risk appetite is narrowing
Altcoins used to be the Wild West. Now? They’re the illiquid backyard of a global casino.
BUT… Let’s put on our degen-tinted glasses for a second.
Suppose the Fed hits the panic button:
🛩️ Rates cut
💸 QE returns
🚁 Helicopter money rains from the sky (not that they’d ever do that… right?)
– Update: Crypto Week is announced and broadcasted to the herd.
What happens then?
That’s when this chart—this ugly, broken, bleeding chart—might finally spring back to life.
– Update: Clearing those lows would’ve made this week feel a lot more convincing. But if you’re looking for signs of life—ETH/BTC chart might just be lighting the way. 🚀
Stay Sharp! 🐋R hUNTING!
THIS IS NOT FINANCIAL ADVICE. FOR EDUTAINMENT PUPOSES ONLY.
I am starting to think TradingView is Haunted. Anyways... ZM🎯 BOATS:ZM Gap Fill Setup – Targeting $84.53 by Week of 7/22
Zoom (ZM) may be setting up for a bullish gap-fill retracement off strong confluence support near $73.81. After a full fib retrace to the 0.5–0.618 zone, the current candle structure shows potential for a reversal toward the unfilled gap at $84.53.
🧠 VolanX Thesis:
✅ 0.5 Fib from March–May rally holding firm
✅ Gap from early June remains unfilled
✅ Bullish reversal candle forming at support
⚠️ Volume drying up on downside = potential exhaustion
🎯 Fib Levels to Watch:
🔹 0.618 = $77.27 (resistance → reclaim zone)
🔹 Gap Fill = $84.53
🔹 1.236 / 1.618 = $89.68 / $92.60 (momentum extension zones)
📈 Trade Idea (Illustrative):
plaintext
Copy
Edit
Entry: $74.50
Stop: $71.90
Target 1: $84.53 (gap fill)
Target 2: $89.60 (Fibonacci extension)
Gap fills often occur within 3–7 trading days when supported by fib reversal structure + buyer absorption.
Not Fin Advice! TY
📌 #ZM #Zoom #VolanXProtocol #GapFill #SmartMoneyConcepts #FibRetracement #DailySetup #WaverVanir #BreakoutTrading #TradingView

Inside day on MondayThe structure in the daily S&P 500 chart implies an inside day for Monday. It indicates a loss of momentum and is potentially bearish.

DIYWallSt Trade Journal:$238 Lessons From Monthly Expiration07/18/25 Trade Journal, and ES_F Stock Market analysis
EOD accountability report: +238.75
Sleep: 5. hours
Overall health: Was working late last night and didn't get much sleep.
VX Algo System Signals from (9:30am to 2pm)
— 8:30 AM Market Structure flipped bullish on VX Algo X3!
— 10:30 AM Market Structure flipped bearish on VX Algo X3!
— 11:10 AM VXAlgo ES X1 Buy signal (didn't work that well)
— 12:10 PM VXAlgo NQ X1DD Sell Signal
— 12:19 PM Market Structure flipped bullish on VX Algo X3!
What’s are some news or takeaway from today? and What major news or event impacted the market today?
Today was monthly expiration for options and we got a lot of X7 Sell signals but structure was bullish so I tried to take a long at MOB and got burned. Flipped bearish and started shorting the rest of the day and ended up making money back.
News
*US STOCKS MOVE LOWER AFTER REPORT SAYS TRUMP PUSHES FOR 15-20% MINIMUM TARIFF ON ALL EU GOODS
What are the critical support levels to watch?
--> Above 6335= Bullish, Under 6315= Bearish
Video Recaps -->https://www.tradingview.com/u/WallSt007/#published-charts

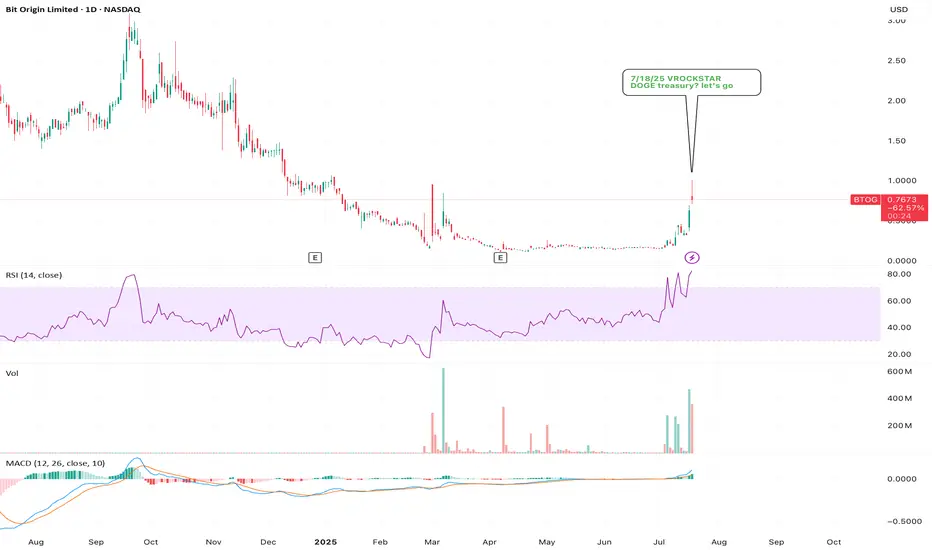
7/18/25 - $btog - DOGE treasury? let's go7/18/25 :: VROCKSTAR :: NASDAQ:BTOG
DOGE treasury? let's go
- doge is the better meme
- POW
- still small
- this ticker trades "cheap" vs. what they need to raise
- no way otherwise to buy doge in this way
- i'll add to this next week if down
V
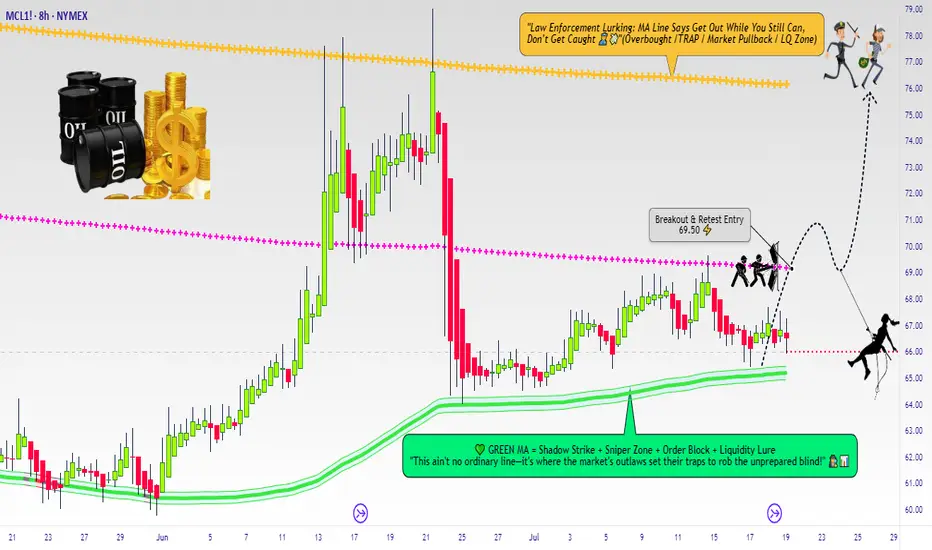
Micro WTI Swing Breakout Setup – Robbing Liquidity the Smart Way🛢️ "Crude Ops: The WTI Energy Vault Breakout Plan" 🛢️
(A Thief Trader Swing Setup | MA Breakout Trap Heist 💰💥)
🌍 Hola! Bonjour! Marhaba! Hallo! Hello Robbers & Market Movers! 🌟
Welcome to another high-voltage heist mission straight from the Thief Trading Den. This ain’t just a chart—this is an Energy Market Extraction Plan based on real smart money footprints 🔎.
🔥 Master Robbery Setup: MICRO WTI CRUDE OIL FUTURES 🎯
We got a bullish breakout alert from the shadows! This is not a drill.
💣 ENTRY STRATEGY
💼 "The Heist Begins Above 68.50"
Watch the Moving Average (MA) zone closely—this is where weak hands get trapped and we slide in with stealth limit or breakout orders:
🛠️ Plan of Entry:
Buy Stop Order: Just above 68.500 (after confirmation of breakout ✅).
Buy Limit Layering (DCA): On pullbacks around 15m/30m swing lows for precision entries.
🧠 Pro Tip: Use alerts to catch the exact entry ignition spark—don't chase, trap with patience like a true thief.
🛑 STOP LOSS (SL)
⚠️ "No SL? That’s a rookie mistake."
SL should only be placed post-breakout using the 8H wick-based swing low (around 66.50).
💡 SL is your personal vault door—set it according to:
Lot size
Risk appetite
Layered entry strategy
📌 Reminder: No SL or order placement before breakout. Let the market show its hand first.
🎯 TARGET ZONE (Take Profit)
Primary Target: 76.00 🏁
But hey... the smartest robbers escape before alarms ring — so trail that stop, secure your profits, and vanish like smoke 🥷.
💥 FUNDAMENTAL & SENTIMENT CATALYSTS
🔥 Current bullish energy comes from:
📉 USD weakness
🏭 Crude inventory drawdowns
⚖️ Geopolitical supply shocks
🐂 Hedge funds scaling long per latest COT data
📊 Intermarket cues from risk-on assets
🧠 Do your diligence: Go check fundamentals, COTs, and macro narratives before entering. Info = Edge.
📢 RISK MANAGEMENT NOTE
🚨 Don't go wild. Market is volatile, especially around:
News drops 📉
Fed or OPEC speeches 🎙️
Crude inventory reports 🛢️
Pause entries during news events. Use trailing SLs to lock the vault behind you.
❤️ SUPPORT THE ROBBERY MISSION
💣 Smash that BOOST button if this plan hits your nerve.
Let’s keep robbing liquidity zones together and growing the Thief Trader Brotherhood 🕵️♂️💰.
📡 Stay tuned for the next stealth heist drop. We rob the market with class. 💎🚀
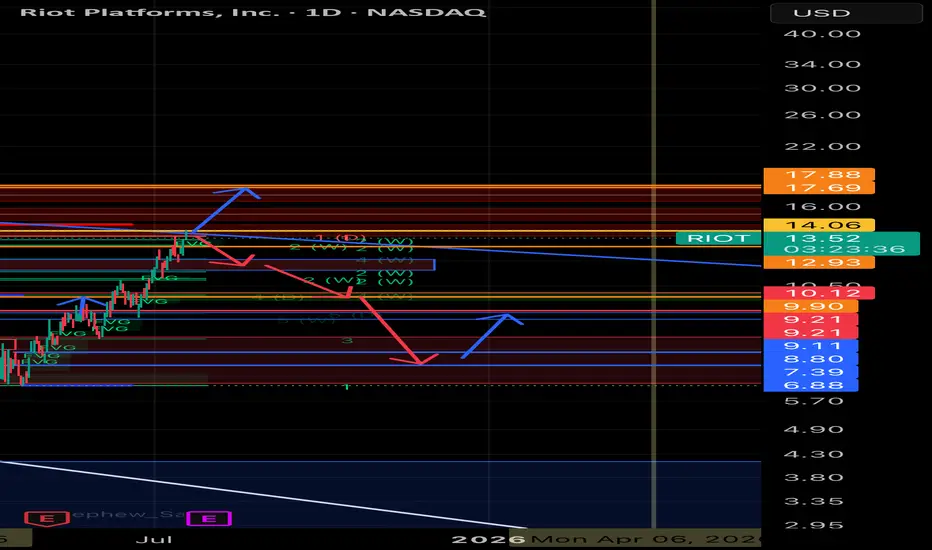
RIOT Platforms, Inc. ($RIOT) – Price Decision Point Near: $17 Br
📆 Timeframe: Daily (1D)
📈 Current Price: ~$13.56
🪙 Key Correlation: Moves in strong tandem with Bitcoin ( CRYPTOCAP:BTC )
⸻
🔧 Chart Analysis Summary
NASDAQ:RIOT has approached a major confluence zone just below $14.06, where several resistance levels, order blocks, and fair value gaps converge. Historically, this zone has rejected price multiple times, making it a critical inflection point.
The technicals suggest a binary outcome is likely in the near term:
⸻
🟢 Upside Scenario – Target: $17.35 to $17.88
If RIOT breaks above the $14.06 resistance with conviction:
• Price could push quickly toward $17.35–$17.88, where:
• Multiple historical supply zones exist
• Large prior rejection candles originated
• LuxAlgo and order block indicators flag institutional interest
• Momentum would likely align with a concurrent breakout in Bitcoin above $120K
⸻
🔴 Downside Scenario – Target: $10.12 to $9.70
If RIOT fails to close above $14 and loses $12.93 support:
• Expect retracement toward:
• $12.05
• $11.50
• Key demand near $10.12–$9.70
• These zones are backed by previous price consolidation, fair value gap fills, and historical bounce levels.
⸻
🔗 Bitcoin ( BITSTAMP:BTCUSD ) Connection
📉 Current BTC Price: ~$117,747
BTC has recently:
• Tagged a long-standing resistance band ($119,182–$120,000)
• Rejected sharply with multiple fair value gaps below
• Holding trendline support, but weakening structure is visible
If Bitcoin breaks below its trendline, a move toward $91K–$92K becomes likely — this would drag RIOT down with it.
If Bitcoin breaks above $120K, momentum could surge across crypto-exposed stocks, and RIOT may follow with a rapid leg up.
⸻
🎯 Conclusion
Scenario Trigger RIOT Target
✅ Bullish BTC breaks $120K $17.35–$17.88
❌ Bearish BTC rejects + loses trendline $12.05 → $11.50 → $10.12–$9.70
⸻
❓Your Turn:
Do you think RIOT breaks out or breaks down?
Let’s see how this unfolds.
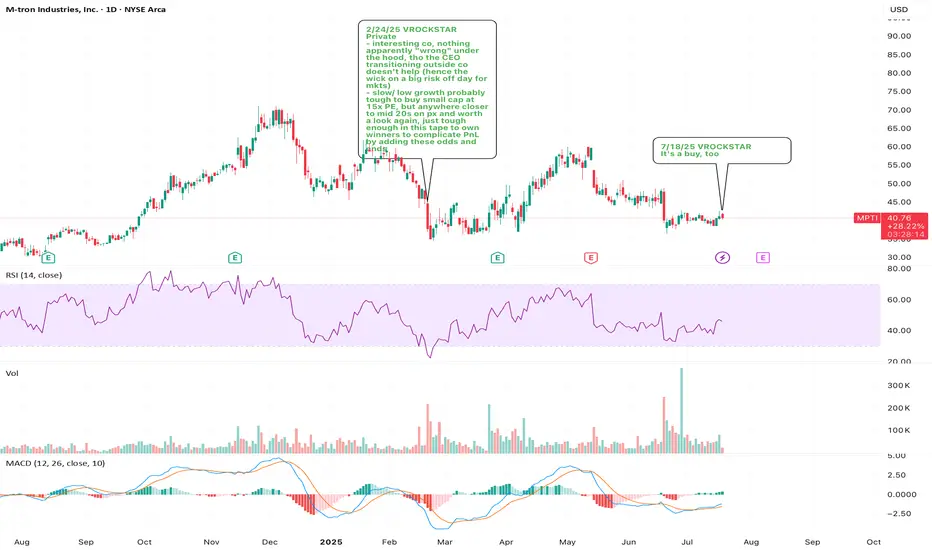
7/18/25 - $mpti - It's a buy, too7/18/25 :: VROCKSTAR :: AMEX:MPTI
It's a buy, too
- in the world of meme everything
- it helps to trade closer to $1, bc apes like to talk about $1 going to $100.
- it's also helps to have an active options chain
- but nevertheless, there are good businesses that are growing, generate cash and have good stories in the right industries that don't necessarily check those boxes
- while i'll probably not neck out on this one today, mainly bc i have my hands full w higher conviction stories, it's one of the top names on my space list ( OTC:MDALF really got away from me, even before i felt comfortable writing about it... kept going higher)
- i'd put this one as probably a close #2 even tho it's much smaller, in a totally different domain, and more defense oriented (and for the record, all war is evil, almost self evidently). however, protection and protecting oneself is a necessary element of the world we live in. these guys supply some cool warez
here's a description from koyfin
M-tron Industries, Inc. designs, manufactures, and markets frequency and spectrum control products to control the frequency and timing of signals in electronic circuits in various applications in the United States and internationally. The company offers radio frequency, microwave, and millimeter wave filters; cavity, crystal, ceramic, lumped element, and switched filters; high performance and high frequency oven-controlled crystal oscillators (OCXO), integrated phase-locked loops OCXOs, temperature-compensated crystal oscillators, voltage-controlled crystal oscillators, and low jitter and harsh environment oscillators; crystal resonators, integrated microwave assemblies, and solid-state power amplifier products. It serves commercial and military aerospace, defense, space, avionics, and industrial markets. The company was founded in 1965 and is headquartered in Orlando, Florida.
- so while MSD+ fcf yields are "good", they're not really in my "it's obvious" zone. then again, typically this is the case for good co's running just fine
- i'd want to get some clarity on why CEO left, which i haven't - any ideas or digs here on the comments wb appreciated
- what do u think anon?
V
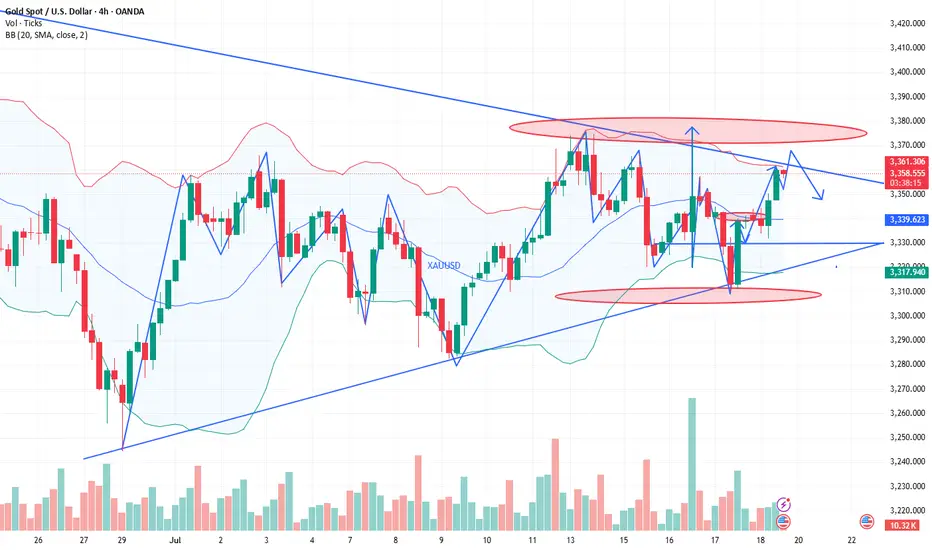
How to operate the gold market opening next MondayAnalysis of gold market trends next week:
Analysis of gold news: Spot gold fluctuated and rose in a narrow range during the U.S. market on Friday (July 18), and is currently trading around $3,354.05 per ounce. On Thursday, spot gold staged a thrilling "deep V" market. Under the dual stimulation of the U.S. retail sales data in June exceeding expectations by 0.6% and the number of initial jobless claims falling to 221,000, the U.S. dollar index once soared to a monthly high of 98.95, instantly suppressing spot gold to an intraday low of $3,309.82 per ounce. But surprisingly, the gold price then rebounded strongly and finally closed at $3,338.86, down only 0.25%. This "fake fall" market reveals the deep contradictions in the current market-although economic data temporarily supports the strengthening of the U.S. dollar, investors' concerns about inflation caused by tariffs are forming a "hidden buying" of gold. The joint rise of the U.S. dollar and U.S. bond yields did suppress gold prices, but strong takeover orders emerged in each falling window. Behind this phenomenon, smart money is quietly making plans. When the 10-year U.S. Treasury yield climbed to a monthly high of 4.495%, gold refused to fall further. This divergence suggests that the market has serious differences on the direction of the Fed's policy.
Technical analysis of gold: After the opening yesterday, gold continued to fall slowly, and the negative impact of the unemployment data in the U.S. market further suppressed the bullish momentum. The lowest price in the U.S. market reached 3310, and the cumulative decline for the whole day exceeded 30 US dollars. But the key is that gold rebounded again at midnight, forming a wide range of fluctuations on Thursday, which was completely in line with expectations. The 3310 bottom-picking and long-term strategy given during the session successfully captured large profits in the band. This trend once again verified the core judgment of this week: gold is in a high-level fluctuation dominated by a bullish trend, and the practical value of this view continues to highlight. After clarifying the current dual attributes of "bullish trend + volatile trend", Friday's trading needs to focus on the effective profit space within the range. It is expected that the 3375-3310 large range will be difficult to break this week, and the small range can be locked at 3355-3320. Before the range is broken, high-selling and low-buying operations can be performed.
.
The technical side shows that the daily line and the 4-hour Bollinger Bands are closed synchronously. At this time, there is no need to worry about the direction, and effective trading can be achieved by keeping a close eye on the range boundary. It is worth noting that the 4-hour moving average system has obvious upward divergence characteristics. Continuing the rebound momentum at midnight on Thursday, gold still has room to rise today, and the upper target is 3360-3365. The small cycle support is clear: 3330 and 3320 are not broken, both are good opportunities for long positions. During the US trading session, it is necessary to pay attention to the breaking of the 3365 and 3375 resistance levels: if the pressure is not broken, there will be room for a decline, and short-term short positions can be tried. On the whole, Charlie suggests that the short-term operation strategy for gold next week should focus on buying on pullbacks and buying on dips, supplemented by rebounds and selling on highs. The short-term focus on the upper side is the 3375-3385 line of resistance, and the short-term focus on the lower side is the 3340-3330 line of support. FX:XAUUSD ACTIVTRADES:GOLD VANTAGE:XAUUSD TVC:GOLD ICMARKETS:XAUUSD CMCMARKETS:GOLD SAXO:XAUUSD

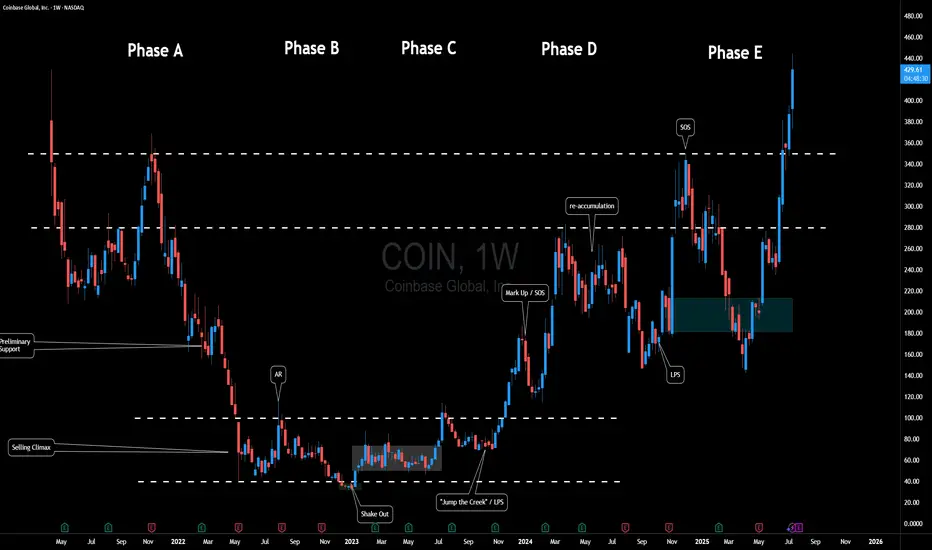
$COIN Fun Wyckoff InterpretationHere's a fun Wyckoff-inspired take on Coinbase Global ( NASDAQ:COIN ) over the past few years, mapping its weekly chart to the classic Accumulation Schematic. Wyckoff's method, envisioning the "Composite Man" quietly scooping up shares during weakness before blasting off... fits COIN perfectly, especially in crypto's wild swings.
We can see a textbook multi-year accumulation from mid 2022, a breakout into markup in 2024, and even a cheeky re-accumulation mid-2024 to fuel the latest highs.
Phase A: Stopping the Downtrend
After the initial IPO Coinbase experienced quite a bit of downside pressure.
Eventually price began to range between $40 and $100.
Phase B: Building Cause
Months of boring sideways chop.
Sellers exhausted because let's think for a moment... If crypto was truly going to stick around - how much lower could this thing go?
Smart money absorbs.
Phase C: The Trap
That shakeout low at ~$32 in early 2023. If you study Wyckoff, this is Schematic #1 vibes.
Phase D: Demand Dominates
Explosive rally (SOS) to ~$280 in early 2024, breaking the range on surging volume.
Mid-2024 pullback to ~$150 acts as a mini Re-Accumulation with its own LPS at the low. Higher lows / mitigation confirm no real distribution yet. Another SOS post-re-accumulation, pushing toward $400+.
Phase E: Markup Phase
Where will the composite man be eyeing for the next target?
Overall, Crypto adoption's heating up (BTC ETF flows, regulatory, etc), and the chart's still in a strong uptrend. But remember, Wyckoff's not crystal ball... it can however be used as a roadmap to navigate the chart.
Fun fact: COIN often mirrors BTC, so keep an eye out for correlation.
What's your opinion - accumulation complete or more shakeouts ahead? 🚀📈
Disclaimer: Not financial advice; DYOR! Chart based on weekly data up to July 2025.
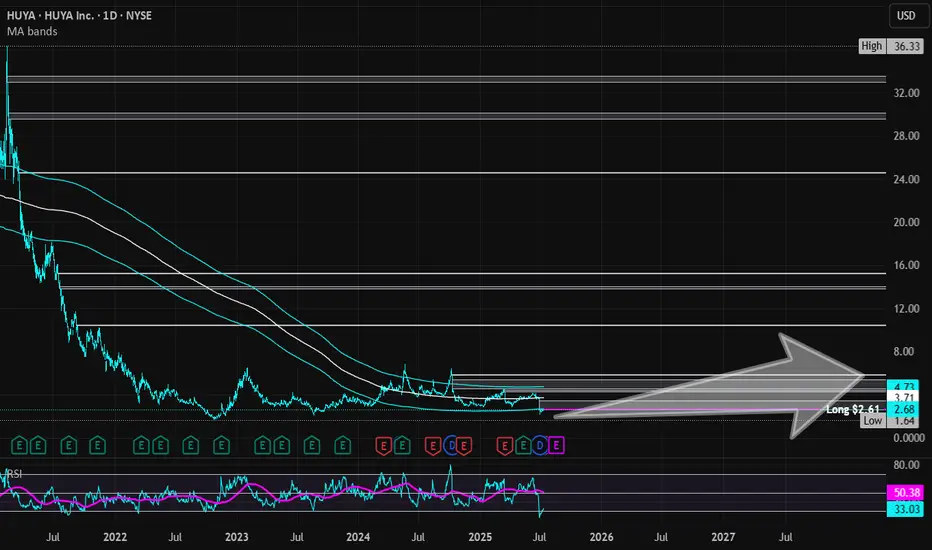
HUYA | HUYA | Long at $2.61HUYA NYSE:HUYA operates game live streaming platforms in China. This stock got my attention based on the reported fundamentals and price position, but moderate "Chinese delisting" risks exist given the US's new political administration.
Book Value = $3.23 (Undervalued)
Forward P/E = 4.1x (Growth)
Debt-to-equity = 0x (Healthy)
Quick Ratio = 1.56x (Healthy)
Altman's Z Score = <1.8 (Bankruptcy risk is relatively high)
From a technical analysis perspective, the stock price momentum has shifted upward based on the historical simple moving average. The price often consolidates within and slightly outside of this simple moving average band before progressing higher (after a long period of selling). While near term-declines are a risk, a longer-term hold (if the fundamentals do not change and delisting doesn't occur) may pay off given the value, growth, and overall health of the company.
Thus, at $2.61, NYSE:HUYA is in a personal buy zone.
Targets into 2028:
$3.45 (+32.2%)
$5.80 (+122.2%)
Is Genius act , really genius ?!In my view GENIUS act is really harmful for crypto. It will force stablecoin issuers to buy a huge amount of U.S. treasuries/debt to stay in the U.S.
For the largest stable coin tether, we have two scenarios here:
1. Tether complies:
If the largest stablecoin, Tether, complies, the entire crypto market will become tightly bound to the U.S. economy. So, if the U.S. economy takes a dive, crypto will follow—hard. We already see correlation, but this will supercharge it.
On top of that, a crypto selloff could trigger one of these stablecoins to go bankrupt, forcing them to dump their U.S. treasuries, which would send shockwaves through the U.S. economy itself.
2. Tether refuses:
If Tether rejects this requirement, the U.S. might ban it. That could trigger a massive market crash. Worse, Tether might start to depeg from the dollar, like Luna did — and we all remember how that ended: absolute bloodbath.
Also it's fun to know how Chatgpt as an unbiased viewer thinks about genius act and it's relation with alt coins pump :
1. “Regulation = legitimacy” hopium
People see the GENIUS Act and think:
"OMG crypto is finally legal in the U.S. Let’s YOLO into everything that’s not a stablecoin!"
So even though the law targets stablecoins, it gives the illusion that altcoins are now “safe” to buy. Spoiler: they’re not.
2. USDC & Tether under pressure → people rotate into altcoins
Smart money’s thinking:
"If stablecoins get frozen or boring, let's ride the volatility wave elsewhere."
➡️ So they ditch stablecoins or high-cap BTC/ETH and ape into altcoins for bigger upside (or gambling addiction, whichever).
3. Low-cap alts pump on hype & narrative
Always happens. Whenever a big regulatory event hits:
ETH L2s pump (Polygon, Arbitrum)
Privacy coins get spicy (Monero, Zcash)
Meme coins go nuts (because why not)
Layer-1s and DEX tokens get love (Solana, Avalanche, Uniswap)
Everyone's front-running some imaginary future utility.
4. Retail sees green candles and FOMOs in
You know how it goes:
Twitter says “GENIUS Act = bullish for crypto”
TikTokers scream “ALT SEASON BABY 🚀”
People ape into garbage with 12 commas in the name
So prices go up. Until they don’t.
⚠️ WARNING: This pump is not based on fundamentals
It’s pure:
Misinterpretation
Speculation
Short-term rotation
a sprinkle of dumbass energy
It can reverse fast if market digests the actual legal implications.
Altcoins are pumping because people mistakenly think regulation = approval = pump season. Also because crypto traders have the attention span of a goldfish on Adderall.

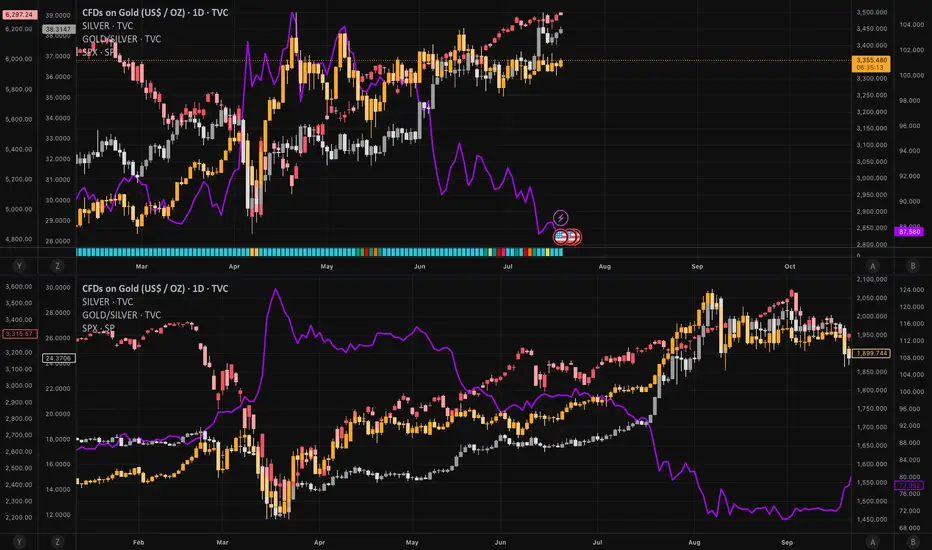
Bear-Trap armed: Gold ticks 4 / 5 boxes - waiting for the spark1️⃣ Why the 2020 déjà-vu is EVEN louder
2025 (now) 2020 (pre-rally)
TradingView ideas still bearish 💬
> 70 % 60 % bearish
Managed-money net-longs ≈ 115 k
-35 % from Apr. –25 % from peak
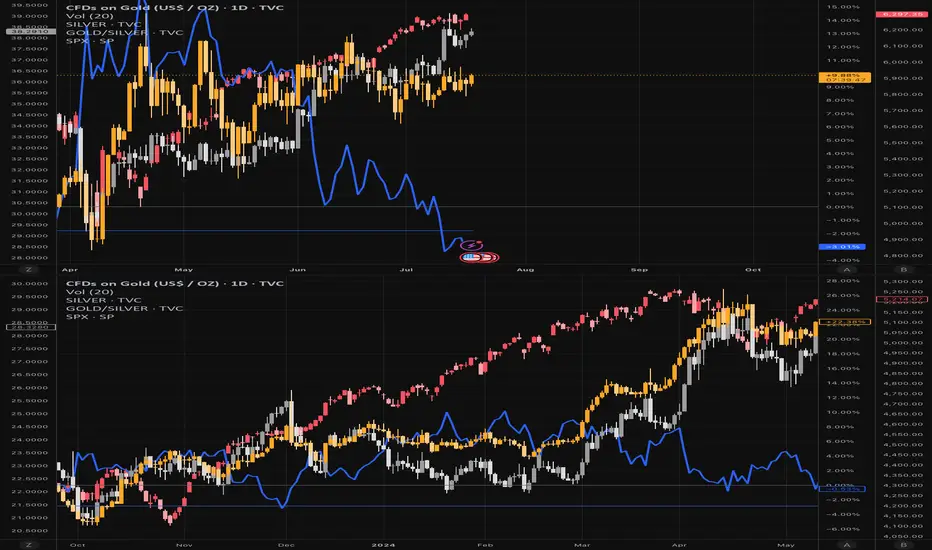
+ $741 m PM-ETF inflow Record IN-flows
G/S ratio 87 (< 90) Fell to 95
S&P keeps making highs Ditto
2️⃣ What’s still different
Real 10-y TIPS yield +0.7 % vs -1 % in 2020 → smaller monetary tail-wind.
Gold is already at an infl-adj. record – expect a short & sharp squeeze, not a fresh multi-year super-cycle (yet).
3️⃣ Checklist – updated
Signal Status 18 Jul Comment
———————————————————
Gold DAILY close ≥ $3 200–3 250 YES – $3 354 ✔
G/S ratio < 90 YES – 87 ✔
CFTC net-longs < 150 k YES – ~115 k ✔
ETF flows turn positive. YES – $741 m ✔
Equity stress (VIX > 25 or SPX −5 %) NOT YET – VIX 16.5 ✖
4 / 5 boxes = 99 % primed. One spark missing.
4️⃣ What could light the fuse
Date Potential trigger Why it matters
22 Jul Mega-tech Q2 earnings (NVDA/AMD) Any guidance miss → SPX wobble
30 Jul FOMC Fed holds but sounds dovish USD dump + yield spike risk
1 Aug Trump s “reciprocal” duties Imported-inflation scare → VIX pop
Early Aug. DXY crashes < 96 in < 5 days. Disorderly USD slide = funding stress
Hit ≥ 2 of: DXY < 96, VIX > 25, SPX -5 % or HY-spread +75 bp → final ✔.
Bottom line
The bear-trap thesis aged well: sentiment, positioning, ETFs, and G/S ratio have already clicked bullish.
Only equity-market stress is missing. A fast USD slide or a tariff shock right after a neutral Fed is the most likely detonator.
Stay nimble: Collect premium inside $3 250-3 400 while volatility sleeps – but keep alarms on VIX 25 and DXY 96. One red headline could still launch the squeeze.
Disclaimer: Educational opinion, not investment advice. Futures & CFD trading is risky – do your own research and consult a professional.
1 minute ago
Elevance Health | ELV | Long at $286.00What are seeing in the healthcare and health insurance provider industry right now is destruction before a once-in-a-lifetime boom. The baby boomer generation is between 60 and 79 right now and the amount of healthcare service that will be needed to serve that population is staggering. Institutions are crushing them to get in - it's just near-term noise, in my opinion. My personal strategy is buy and hold every healthcare opportunity (i.e. NYSE:CNC , NYSE:UNH , NYSE:HUM etc).
Elevance Health NYSE:ELV just dropped heavily due to lower-than-expected Q2 2025 earnings, a cut in full-year profit guidance from $34.15-$34.85 to ~$30 EPS, and elevated medical costs in Medicaid and ACA plans. It's near-term pain (may last 1-2 years) which will highly likely lead to long-term growth. The price has touched my historical simple moving average "crash" band. I would not be shocked to see the price drop further into the $260s before a rise. However, the near-term doom could go further into the year. I am anticipating another drop to the "major crash" simple moving average band into the $190s and $220s to close out the remaining price gaps on the daily chart that occurred during the COVID crash. Not to say it will absolutely reach that area, but it's locations on the chart I have for additional buys.
Thus, at $286.00, NYSE:ELV is in a personal buy zone (starter position) with more opportunities to gather shares likely near $260 before a bounce. However, if the market or healthcare industry really turns, additional buys planned for $245 and $212 for a long-term hold.
Targets into 2028:
$335.00 (+17.1%)
$386.00 (+35.0%)

Gold trend analysis and latest exclusive operation suggestionsTechnical analysis of gold: After the opening yesterday, gold continued to fall slowly. The negative impact of unemployment data in the US market further suppressed the bullish momentum. The lowest price in the US market reached 3310, and the cumulative decline for the whole day exceeded 30 US dollars. But the key is that gold in the New York market rebounded again, forming a wide range of fluctuations on Thursday, which was completely in line with expectations. The 3310 bottom-picking and long-term strategy given during the session successfully captured large profits in the band. This trend once again verified the core judgment of this week: gold is in a high-level fluctuation dominated by the bullish trend, and the practical value of this view continues to highlight. After clarifying the current dual attributes of "bullish trend + oscillating trend", Friday's trading needs to focus on the effective profit space within the range. It is expected that the 3375-3310 large range will be difficult to break during the day this week, and the small range can be locked at 3355-3320. The high-selling and low-buying operations can be performed before the range is broken.
The technical side shows that the daily line and the 4-hour period Bollinger band are closed simultaneously. At this time, there is no need to worry about the direction, and effective trading can be achieved by keeping a close eye on the range boundary. It is worth noting that the 4-hour moving average system has obvious upward divergence characteristics. Continuing the rebound momentum of the New York market on Thursday, gold still has room to rise today, and the upper target is 3360-3365. The small cycle support is clear: 3330 and 3320 are not broken, both are good opportunities for long positions. During the US trading period, we need to pay attention to the breaking of the 3365 and 3375 resistance levels: if they are under pressure and not broken, there will be room for a fall, and you can try short-term shorting. Overall, Charlie recommends that the short-term operation strategy for gold today is mainly to step on the low and long, supplemented by the rebound high. The short-term focus on the upper side is the 3375-3385 resistance, and the short-term focus on the lower side is the 3345-3335 support. PEPPERSTONE:XAUUSD VELOCITY:GOLD EIGHTCAP:XAUUSD ACTIVTRADES:GOLD EIGHTCAP:XAUUSD CMCMARKETS:GOLD EIGHTCAP:XAUUSD
Bear-Trap armed: Gold ticks 4 / 5 boxes - waiting for the spark
1️⃣ Why the 2020 déjà-vu is EVEN louder
2025 (now) 2020 (pre-rally)
TradingView ideas still bearish 💬
> 70 % 60 % bearish
Managed-money net-longs ≈ 115 k
(-35 % from Apr) –25 % from peak
+ $741 m PM-ETF inflow, first after months Record IN-flows
G/S ratio 87 (< 90) Fell to 95
S&P keeps making highs. Ditto
2️⃣ What’s still different
Real 10-y TIPS yield +0.7 % vs -1 % in 2020 → smaller monetary tail-wind.
Gold is already at an infl-adj. record – expect a short & sharp squeeze, not a fresh multi-year super-cycle (yet).
3️⃣ Checklist – updated
Signal Status 18 Jul Comment
———————————————————
Gold DAILY close ≥ $3 200–3 250 YES – $3 354 ✔
G/S ratio < 90 YES – 87 ✔
CFTC net-longs < 150 k YES – ~115 k ✔
ETF flows turn positive. YES – $741 m ✔
Equity stress (VIX > 25 or SPX −5 %) NOT YET – VIX 16.5 ✖
4 / 5 boxes = 99 % primed. One spark missing.
4️⃣ What could light the fuse
Date Potential trigger Why it matters
22 Jul Mega-tech Q2 earnings (NVDA/AMD) Any guidance miss → SPX wobble
30 Jul FOMC Fed holds but sounds dovish USD dump + yield spike risk
1 Aug Trump s “reciprocal” duties Imported-inflation scare → VIX pop
Early Aug. DXY crashes < 96 in < 5 days. Disorderly USD slide = funding stress
Hit ≥ 2 of: DXY < 96, VIX > 25, SPX -5 % or HY-spread +75 bp → final ✔.
Bottom line
The bear-trap thesis aged well: sentiment, positioning, ETFs, and G/S ratio have already clicked bullish.
Only equity-market stress is missing. A fast USD slide or a tariff shock right after a neutral Fed is the most likely detonator.
Stay nimble: Collect premium inside $3 250-3 400 while volatility sleeps – but keep alarms on VIX 25 and DXY 96. One red headline could still launch the squeeze.
Disclaimer: Educational opinion, not investment advice. Futures & CFD trading is risky – do your own research and consult a professional.
EURUSD 1st Sell EntryEntry: 1.16216
Stop Loss (R): 1.16516
Take Profit (4R): 1.15016
*Disclaimer: I will not accept liability for any loss or damage, including without limitation to any loss of profit, which may arise directly or indirectly from use of or reliance on such information.

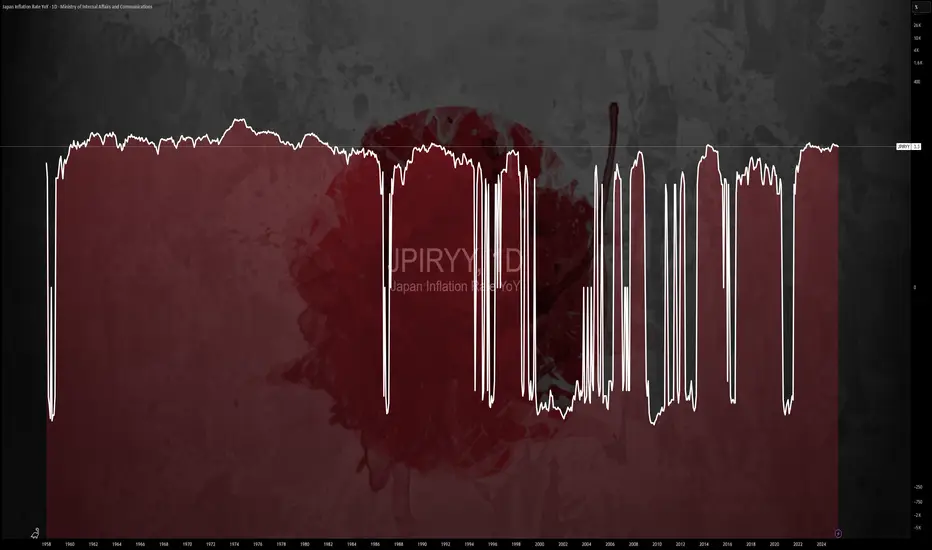
$JPIRYY -Japan Inflation Hits 7-Month Low (June/2025)ECONOMICS:JPIRYY 3.3%
June/2025
source: Ministry of Internal Affairs & Communications
-Japan’s annual inflation rate eased to 3.3% in June 2025 from 3.5% in May, marking the lowest reading since last November, as a sharp slowdown in electricity and gas prices offset persistent upward pressure from rice.
Core inflation also matched the headline rate at 3.3%, pointing to a three-month low and aligning with expectations.
EURUSD BULLISH MOMENTUMMarket Structure
Higher highs and higher lows forming on the H4 and Daily timeframe.
Price may have broken out of a previous consolidation range, confirming bullish momentum.
Key Levels
former resistance, now support, psychological and historical levelS.

Long Term Investment cum Trading Idea ( FnO Stock)ASHOKLEY LTP 217
Tgt:242/264/295🤞🏻
Long-term: 328/399/432🤞🏻🤞🏻
May add more on dips till 206-191
For investors with a long-term perspective and the ability to add on dips or hold calmly.
Time Frame: 4 to 12 months 🤞🏻
Trade as per your risk management and investment plan.
#luv4stockmarket
#scammersfreetrading
#atmanirbharinvesting
