COACH VS BOSS / RECOGNIZING BOSS FORMATION ON CHART 📊Hello Traders!
I want to show you the importance of Boss formation in trading, and how to recognize this formation on a chart.
Traders, if you liked my idea or if you have a different vision related to this trade, write in the comments. I will be glad to see your perspective.
____________________________________
Follow, like, and comment to see my content:
www.tradingview.com
Fundamentalanalsysis

USDJPY Bullish Ahead of US GDP AnnouncementHi Traders!
USDJPY is in an ascending channel, and there is a bullish outlook on the market.
Here are the details:
After the pullback from the weekly high, the market seems to have found support near the channel support line.
We are now looking for a break and close above the 20 EMA for a confirmation signal to target an exit near the weekly high.
Preferred Direction: Buy
Entry Level: 143.250
Stop Level: 142.271
Target Level: 145.209
Technical Indicators: 20 EMA
Please make sure to click on the like/boost button 🚀 as your support greatly helps.
Trade safely and responsibly.
BluetonaFX

RECOGNIZING ENGULFING CANDLESTICK Hello traders!
- I want to present the engulfing candlestick pattern and will try to explain why it is important to recognize this pattern formation.
- The engulfing candlestick is a crucial tool in technical analysis for traders in financial markets. It serves as a powerful indicator of potential trend reversals or continuation, providing valuable insights into market sentiment and potential future price movements.
- Recognizing and interpreting these patterns can enhance the ability to spot potential trend reversals, confirm existing trends, and make informed trading decisions. However, like any technical analysis tool, it is important to use engulfing patterns in conjunction with other indicators and risk management techniques for a comprehensive approach to trading.
Follow, like, and comment to see the daily/weekly content:
www.tradingview.com

CHFJPY I Technical & fundmental forecastWelcome back! Let me know your thoughts in the comments!
** CHFJPY Analysis - Listen to video!
We recommend that you keep this pair on your watchlist and enter when the entry criteria of your strategy is met.
Please support this idea with a LIKE and COMMENT if you find it useful and Click "Follow" on our profile if you'd like these trade ideas delivered straight to your email in the future.
Thanks for your continued support!

USDJPY I Bullish USD unemployment claims long from supportWelcome back! Let me know your thoughts in the comments!
** USDJPY Analysis - Listen to video!
We recommend that you keep this pair on your watchlist and enter when the entry criteria of your strategy is met.
Please support this idea with a LIKE and COMMENT if you find it useful and Click "Follow" on our profile if you'd like these trade ideas delivered straight to your email in the future.
Thanks for your continued support!

GOLD to Reach new ATH this year War on Ukraine - Asian dumping the dollar - Gaz & Oil crisis - Food crisis - Inflation - Everyone will get back to gold | A new geo-political era is coming, and I think without the supremacy of the USD

AI-Driven Market Analysis: Revolutionizing Financial InsightsIntroduction
Market analysis has long been the cornerstone of financial decision-making, offering insights into market trends, asset valuation, and investment opportunities. Traditionally, this analysis has relied on a combination of statistical methods, fundamental analysis, and expert judgment to interpret market dynamics and forecast future movements. However, the finance industry is currently undergoing a seismic shift with the introduction and integration of Artificial Intelligence (AI).
AI, with its unparalleled ability to process and analyze vast quantities of data at unprecedented speeds, is revolutionizing market analysis. Unlike traditional methods, which often struggle with the sheer volume and complexity of modern financial data, AI algorithms can quickly sift through global market data, news, and financial reports, identifying patterns and correlations that might escape human analysts. This capability is not just about handling data efficiently; it's about uncovering deeper market insights and offering more nuanced, informed perspectives on market movements.
The growing role of AI in financial market analysis is multifaceted. It encompasses predictive analytics, which forecasts market trends and asset price movements; risk assessment, which evaluates potential risks and market volatility; and sentiment analysis, which gauges market sentiment by analyzing news, social media, and financial reports. These AI-driven approaches are transforming how investors, traders, and financial institutions make decisions, offering a more data-driven, precise, and comprehensive view of the markets.
As we delve deeper into the world of AI-driven market analysis, it's crucial to understand both its potential and its limitations. While AI provides powerful tools for market analysis, it also introduces new challenges and considerations, particularly around data quality, algorithmic bias, and ethical implications. In this article, we'll explore how AI is changing the landscape of market analysis, examining its applications, benefits, and future prospects in the ever-evolving world of finance.
The Evolution of Market Analysis
A Brief History of Market Analysis in Finance
Market analysis in finance has a storied history, evolving through various stages as it adapted to changing markets and technological advancements. Initially, market analysis was predominantly fundamental, focusing on the intrinsic value of assets based on economic indicators, financial statements, and industry trends. Technical analysis, which emerged later, shifted the focus to statistical trends in market prices and volumes, seeking to predict future movements based on historical patterns.
Over the decades, these approaches were refined, incorporating increasingly sophisticated statistical models. However, they remained limited by the human capacity to process information. Analysts were constrained by the volume of data they could analyze and the speed at which they could process it. This often led to a reactive approach to market changes, rather than a predictive one.
Transition from Traditional Methods to AI Integration
The advent of computer technology brought the first major shift in market analysis. Computers enabled quicker processing of data and complex mathematical modeling, allowing for more sophisticated analyses that could keep pace with the growing volume and velocity of financial market data. The introduction of quantitative analysis in the latter part of the 20th century marked a significant step in this evolution, as it used complex mathematical and statistical techniques to identify market opportunities.
The real transformation, however, began with the integration of AI and machine learning into market analysis. AI's ability to learn from data, identify patterns, and make predictions, has taken market analysis to an entirely new level. AI algorithms can analyze vast datasets — including historical price data, financial news, social media sentiment, and economic indicators — much faster and more accurately than any human analyst could.
This integration of AI into market analysis has led to the development of predictive models that can forecast market trends and anomalies with a higher degree of accuracy. AI-driven tools are now capable of real-time analysis, providing instantaneous insights that help traders and investors make more informed decisions. Furthermore, AI's ability to continually learn and adapt to new data sets it apart from static traditional models, allowing for a more dynamic and responsive approach to market analysis.
The transition from traditional methods to AI integration represents a paradigm shift in market analysis. This evolution is not just about adopting new tools but signifies a fundamental change in how financial markets are understood and navigated. As we continue to advance in the realm of AI, the potential for even more sophisticated and insightful market analysis grows, promising to reshape the landscape of finance in ways we are only beginning to comprehend.
Fundamentals of AI in Market Analysis
The integration of Artificial Intelligence (AI) and machine learning into market analysis marks a significant advancement in the way financial data is interpreted and utilized. Understanding the fundamentals of these technologies is essential to appreciate their impact on market analysis.
Explanation of AI and Machine Learning
AI refers to the simulation of human intelligence in machines that are programmed to think and learn like humans. In the context of market analysis, AI enables the automation of complex tasks, including data processing, pattern recognition, and predictive analytics.
Machine learning, a subset of AI, involves the development of algorithms that can learn and improve from experience without being explicitly programmed. In market analysis, machine learning algorithms analyze historical data to identify patterns and predict future market behavior. The more data these algorithms are exposed to, the more accurate their predictions become.
Types of AI Models Used in Market Analysis
1. Neural Networks: Inspired by the human brain's structure, neural networks consist of layers of interconnected nodes that process data in a manner similar to human neurons. In market analysis, neural networks are used for their ability to detect complex patterns and relationships within large datasets. They are particularly effective in predicting price movements and identifying trading opportunities based on historical market data.
2. Regression Models: These models are fundamental in statistical analysis and are used to understand relationships between variables. In finance, regression models help in forecasting asset prices and understanding the impact of various factors (like interest rates, GDP growth, etc.) on market trends.
3. Time Series Analysis Models: Time series models are crucial in financial market analysis, as they are specifically designed to analyze and forecast data points collected over time. These models help in understanding and predicting trends, cyclicality, and seasonal variations in market data.
4. Natural Language Processing (NLP): NLP is used to analyze textual data, such as financial news, earnings reports, and social media posts, to gauge market sentiment. By processing and interpreting the nuances of human language, NLP models can provide insights into how public sentiment is likely to impact market movements.
5. Decision Trees and Random Forests: These models are used for classification and regression tasks. In market analysis, they can help in categorizing stocks into different classes based on their characteristics or in predicting the likelihood of certain market events.
6. Reinforcement Learning: This type of machine learning involves algorithms learning optimal actions through trial and error. In trading, reinforcement learning can be used to develop strategies that adapt to changing market conditions to maximize returns.
Each of these AI models brings a unique set of capabilities to market analysis. Their ability to handle large volumes of data, recognize complex patterns, and make informed predictions is transforming the field of financial analysis, allowing for more nuanced and sophisticated market insights. As AI technology continues to evolve, its applications in market analysis are poised to become even more integral to financial decision-making.
Key Applications of AI in Market Analysis
The incorporation of Artificial Intelligence (AI) in market analysis has opened up new frontiers in understanding and predicting market behavior. AI's ability to process vast datasets and uncover intricate patterns provides invaluable insights for investors, traders, and financial analysts. Here are some key applications of AI in market analysis:
1. Predictive Analytics for Market Trends
One of the most significant contributions of AI in market analysis is predictive analytics. AI algorithms, particularly those based on machine learning, are adept at analyzing historical data to forecast future market trends. These algorithms can identify subtle patterns and correlations that might be invisible to the human eye, enabling predictions about price movements, market volatility, and potential trading opportunities. As these models are exposed to more data over time, their accuracy in forecasting trends continues to improve.
2. Real-time Data Processing and Interpretation
The financial markets generate vast amounts of data every second. AI excels in processing this data in real-time, providing instantaneous insights that are critical in a fast-paced trading environment. This capability allows for the monitoring of live market conditions, immediate identification of market shifts, and quick response to unforeseen events. Real-time analysis ensures that trading strategies can be adjusted promptly to capitalize on market opportunities or mitigate risks.
3. Automated Technical Analysis
Technical analysis involves the study of historical market data, primarily price and volume, to forecast future market behavior. AI-driven automated technical analysis takes this to a new level by using algorithms to scan and interpret market data at scale. These algorithms can automatically identify technical indicators, chart patterns, and other key metrics used in technical analysis. This automation not only speeds up the analysis process but also eliminates human bias and error, leading to more objective and reliable insights.
4. Sentiment Analysis from News and Social Media
Market sentiment, the overall attitude of investors towards a particular market or security, can significantly influence market movements. AI, particularly through Natural Language Processing (NLP), plays a crucial role in analyzing sentiment. It processes vast amounts of unstructured data from news articles, financial reports, social media posts, and other textual sources to gauge public sentiment towards the market or specific investments. By analyzing this data, AI can provide insights into how collective sentiment is likely to impact market trends and investment decisions.
These applications highlight the transformative role of AI in market analysis. By leveraging AI for predictive analytics, real-time data processing, automated technical analysis, and sentiment analysis, market participants can gain a more comprehensive, accurate, and nuanced understanding of market dynamics. This advanced level of analysis is not only enhancing traditional market analysis methods but is also shaping new strategies and approaches in the financial sector.
Case Studies: Success Stories of AI-Driven Market Analysis
The integration of Artificial Intelligence (AI) in market analysis has not only been a topic of academic interest but has also seen practical applications with significant impacts on market decisions. Several real-world case studies illustrate how AI-driven analysis has transformed trading strategies and financial insights. Here are a couple of notable examples:
Case Study 1: AI in Predicting Stock Market Trends
One of the most prominent examples is the use of AI by a leading investment firm to predict stock market trends. The firm developed a machine learning model that analyzed decades of market data, including stock prices, trading volumes, and economic indicators. This model was designed to identify patterns that precede significant market movements.
In one instance, the AI system predicted a substantial market correction based on unusual trading patterns it detected, which were subtle enough to be overlooked by traditional analysis methods. The firm acted on this insight, adjusting its portfolio to mitigate risk. When the market did correct as predicted, the firm was able to avoid significant losses, outperforming the market and its competitors.
Case Study 2: Enhancing Hedge Fund Strategies with AI
Another case involves a hedge fund that integrated AI into its trading strategies. The fund employed deep learning algorithms to analyze not just market data but also alternative data sources such as satellite images, social media sentiment, and supply chain information. This comprehensive analysis allowed the fund to identify unique investment opportunities and trends before they became apparent to the market at large.
For example, by analyzing satellite images of retail parking lots, the AI could predict quarterly sales trends for certain companies before their earnings reports were released. Combining these insights with traditional financial analysis, the fund made informed decisions that led to substantial returns, demonstrating the power of AI in enhancing traditional investment strategies.
Impact of AI on Specific Market Decisions
These case studies illustrate the profound impact AI can have on market decisions. AI-driven market analysis allows for more accurate predictions, better risk management, and the identification of unique investment opportunities. It enables market participants to make more informed, data-driven decisions, often leading to better financial outcomes.
Moreover, the use of AI in these examples highlights a shift towards a more proactive approach in market analysis. Rather than reacting to market events, AI allows analysts and investors to anticipate changes and act preemptively. This shift is not just about leveraging new technologies but represents a broader change in the philosophy of market analysis and investment strategy.
In summary, these real-world applications of AI in market analysis showcase its potential to transform financial strategies and decision-making processes. As AI technology continues to evolve and become more sophisticated, its role in market analysis is set to become even more integral and impactful.
Future of AI in Market Analysis
The landscape of market analysis is rapidly evolving, with Artificial Intelligence (AI) at the forefront of this transformation. The future of AI in market analysis is not just about incremental improvements but also about paradigm shifts in how financial data is processed, interpreted, and utilized for decision-making. Here are some emerging trends and potential shifts that could redefine the role of AI in market analysis:
Emerging Trends and Technologies
1. Advanced Predictive Analytics: The future will likely see more sophisticated predictive models using AI. These models will not only forecast market trends but also provide probabilistic scenarios, offering a range of possible outcomes with associated probabilities.
2. Explainable AI (XAI): As AI models become more complex, there will be a greater need for transparency and interpretability. XAI aims to make AI decision-making processes understandable to humans, which is crucial for trust and compliance in financial markets.
3. Integration of Alternative Data: AI's ability to process and analyze non-traditional data sources, such as satellite imagery, IoT sensor data, and social media content, will become more prevalent. This will provide deeper, more diverse insights into market dynamics.
4. Real-time Risk Management: AI will enable more dynamic risk assessment models that update in real-time, considering the latest market data and trends. This will allow for more agile and responsive risk management strategies.
5. Automated Compliance and Regulation Monitoring: AI systems will increasingly monitor and ensure compliance with changing regulatory requirements, reducing the risk of human error and the burden of manual oversight.
6. Quantum Computing in Market Analysis: The potential integration of quantum computing could exponentially increase the speed and capacity of market data analysis, allowing for even more complex and comprehensive market models.
Potential Shifts in Market Analysis Strategies
1. From Reactive to Proactive Analysis: AI enables a shift from reacting to market events to proactively predicting and preparing for them. This will lead to more forward-thinking investment strategies.
2. Personalization of Investment Strategies: AI can tailor investment advice and strategies to individual investors' profiles, risk appetites, and goals, leading to more personalized financial planning and portfolio management.
3. Democratization of Market Analysis: Advanced AI tools could become more accessible to a broader range of investors and firms, leveling the playing field between large institutions and smaller players.
4. Increased Emphasis on Data Strategy: As AI becomes more central to market analysis, there will be an increased focus on data strategy - how to source, manage, and leverage data effectively.
5. Redefining Skill Sets in Finance: The rising importance of AI will change the skill sets valued in finance professionals. There will be a greater emphasis on data science skills alongside traditional financial analysis expertise.
In conclusion, the future of AI in market analysis is not just promising but revolutionary. It is poised to redefine traditional practices, introduce new capabilities, and create opportunities for innovation in the financial sector. As these technologies advance, they will continue to shape the strategies and decisions of market participants, marking a new era in financial market analysis.

MEMEUSDT to hit 0.1 by December6.9b market cap and only 1b + released.
MEMECoin has no roadmap, but backed by a huge community, with founding company being 9GAG, as well as tons of investors, whales and socialites backing it.
Next phase of development sees the following:
- Product
- Event
- New NFT collection (following its 3 minted out collection with floor price of 4eth)
- Integration (to be revealed)
- Swags (Community goes nuts on this)

Gold Future for the Upcoming WeekIn the coming days, it's likely that the price of gold will reach a new high. We base this expectation on the fact that gold is currently touching a demand level on 1995-1997$ the H1 chart, a level often associated with price increases. Additionally, we've noticed an order block coinciding with a Fibonacci level, which adds weight to our prediction. Keep an eye on these factors as you consider your trading decisions.

Unlocking Gold's Next Move Factors at Play in the Marketgold price is gaining momentum in anticipation of a further increase, with the Bull Flag pattern still in effect, giving hope to buyers. The 14-day Relative Strength Index (RSI) is approaching overbought levels, indicating the potential for more upward movement.
The immediate resistance for the gold price is at $1,997, which corresponds to the five-month highs. Breaking above $2,000 on a weekly closing basis is crucial for further gains. The next significant resistance level is around $2,020, which represents the mid-May highs.
On the other hand, if the price is rejected near the multi-month high of $1,997, it could lead to a sharp correction towards the previous day's low at $1,972. If it continues to decline, the next support level to watch is at $1,963, followed by the psychological level of $1,950.
Gold is currently trading above $1,980 as it takes a pause after recent volatile trading. Factors influencing the market include the possibility of Japanese FX intervention, strong US Gross Domestic Product (GDP) data, ongoing Middle East concerns, and positive earnings from Amazon.com Inc. The focus is shifting to US inflation data.
The positive market sentiment is partially suppressing the US Dollar and US Treasury bond yields, allowing gold to maintain its positive momentum. Investor optimism is fueled by strong post-market earnings reports from US tech companies, including Amazon.com Inc.
Despite geopolitical tensions in the Middle East, including military strikes by the US and preparations for a ground invasion in Gaza, gold remains influenced by broader market sentiment, geopolitical developments, end-of-week flows, and bond market movements.
The US Congress has a new Speaker of the House, Mike Johnson, and concerns about a government shutdown persist. While the US Personal Consumption Expenditures - Price Index is on the horizon, it may receive limited attention as the recent US Q3 GDP report already included quarterly PCE inflation figures. The report showed a 4.9% annualized growth rate in the third quarter, surpassing the 4.2% estimate, largely driven by factors such as consumer spending, inventories, exports, residential investment, and government spending. This economic performance aligns with the Federal Reserve's outlook for higher interest rates in the future, even though it didn't significantly impact the US Dollar or Treasury bond yields. Gold initially corrected lower in response to the data but later found support to close slightly higher on Thursday.

Technical Tuesday 10/17/23Last Technical Tuesday went really well for 380 pips. Waited patiently for any set ups I like, fundamentally and technically speaking this all Im liking at the moment. Feels like Gold should continue upward momentum.

Breaking the trendline, GOLD recovery before the sell trendAs gold breaks through key resistance levels, investors are closely monitoring the market for further signals of a bullish trend. However, it's important to stay informed about factors like geopolitical events, central bank decisions, and economic data, as they can significantly impact the gold market. Traders should exercise caution, practice risk management, and remain adaptable to changing market dynamics to make informed decisions in this evolving environment.

GOLD, ShortGold has been able to fill liquidity to 1879.800 and could correct to 1845 to fulfill Fibonacci retracement to 50% before a possible surge up to 1900 in the coming days.
The PPI News on Wednesday, 11th October was a positive news for the greenback (Dollar index) and the CPI and UoM Consumer Sentiment News is coming on Thursday and Friday, 12th/13th October.
Usually, the CPI news is negative for Gold so let's see how it could determine the direction of the gold market.

Bitcoin (BTC) technical and fundamental analysisThe price of Bitcoin has entered the 4-hour Imbalance zone, as we warned in all our recent ideas. Consequently, the price has broken above the global descending trendline and moved out of the previous price range. This BTC rally is associated with a significant accumulation of short positions, with the total volume of shorts reaching up to 85% compared to longs. During the upward impulse, short positions totaling over $100 million were liquidated.
Currently, we anticipate trading within the 4-hour Imbalance zone to fill gaps in horizontal trading volume levels. If the price fails to consolidate itself above the resistance block, it's likely go to correction of the recent upward impulse to the 0.61-0.78 Fibonacci levels. During this correction, it may also retest EMA50 and the descending trendline.
However, if buyers manage to maintain their strength and continue the upward movement, we anticipate a test of the next significant resistance block around the psychological level 30,000.
📉 Global view of the Bitcoin market
On the daily logarithmic chart, Bitcoin's price is testing the intersection of the 200-day and 200-week moving averages. If it consolidate above these moving averages, the next target for the upward movement could be a retest of the upward trendline above which lies the 1-week Imbalance zone. In this zone, gaps in horizontal trading volume levels need to be filled. However, to achieve this, buyers will need to overcome the significant resistance block at 30,000-32,000.
It's important to note that the RSI indicators on the 4-hour and 1-day timeframes are already entering the oversold territory, indicating a potential trend reversal on the horizon.
Additionally, it's worth remembering that the Bitcoin price has not yet fully played out the breakout from the bearish wedge pattern. Furthermore, there hasn't been a proper correction of the entire uptrend since the beginning of this year. These factors suggest that the market may still experience significant volatility and potential price movements in the near future. Traders should closely monitor these and be prepared for various scenarios.
Levels long positions:
23,000 - level of the cost zone control point (POC)
22,000 - 0.61 Fibonacci retracement level
20,000 - 0.78 Fibonacci retracement level
17000-19000 - Imbalance zone 1H
Levels for short positions:
29,000-30,000 - 0.78 Fibonacci retracement level
32 000-35000 - Imbalance zone 1W
36,000-38,000 - zone of possible retest of the trend line
40,000 - psychological resistance level
The index of fear and greed is in the neutral zone - 50.
The total capitalization of the cryptocurrency market increased to $1083 billion, and the Bitcoin dominance index increased to 50.53.
According to the analysis of the accumulation of large blocks in order books, the supply and demand zones are located at the following levels:
🟢 Demand zone: 20000 - 26000
🔴 Offer zone: 29000 - 32000
📊 Fundamental analysis
Historical data has shown that October has traditionally been a favorable month for Bitcoin price growth. Currently, there's an active hashtag campaign on social media called #Uptober, indicating optimism among cryptocurrency enthusiasts for a positive trend in October.
Large investors continue to accumulate Bitcoin. According to on-chain analysis, addresses holding between 10 and 10,000 BTC are accumulating coins. This suggests that institutional investors remain bullish on Bitcoin.
In the world of U.S. politics, a compromise bill was passed, preventing a government shutdown at least until November 17th. This news has provided support to all risk asset markets, including cryptocurrencies.
The American stock market initially responded to this news with a slight upward impulse in the S&P500 index, but it was later overshadowed by a decline. Meanwhile, the U.S. Dollar Index (DXY) continues to rise. These factors highlight the dynamic and interconnected nature of the financial markets, with political developments, institutional interest, and seasonal patterns all playing a role in influencing market sentiment and asset prices.
🌐 Upcoming macroeconomic events
The following dates are expected to bring increased volatility in both the stock and cryptocurrency markets:
➤ October 3rd at 17:00 - Job Openings and Labor Turnover Survey (JOLTS) data for August.
➤ October 12th at 15:30 - U.S. Consumer Price Index (CPI).
➤ November 1st at 21:00 - New Federal Reserve interest rate decision.

DXY, Ready to ShortThe last week DXY movement fulfilled my idea which I predicted price to hit the key level at 105.8
For the past 13 -14 weeks, the DXY has been on an ascending trend from 99.23 to 105.756. The current resistance has been a key level since 1st December 2022.
Price is currently reacting on a resistance trendline of the main ascending channel since 26th September 2022.
The resistance trendline coincides with the 105.834 key resistance which has historically driven the DXY down.
The DXY could initiate a BEARISH WAVE first to 103.100 to retest the Daily EMA-200 & 50.
The FED could consider a rate hike in the last quarter of 2023 in the midst of a possible DXY bearish waves.

DXY, to continue price ascending to 105.834Last week's DXY index candle bullishly closed with a strong rejection with from the 104.643 support because all of the USD fundamentals (The CPI, Core PPI, Core Retail Sales, etc.) which occurred last week went to strengthen the dollar.
The DXY is expected to consolidate between current level of 105.351 and 105.00 since there is not important fundamentals between Monday and Tuesday before a potential rise to 105.834
There are important fundamentals coming up this week form Wednesday to Friday
-FOMC Statement and press conference
-Federal Funds Rate
-Unemployment Claims
-Flash Manufacturing PMI

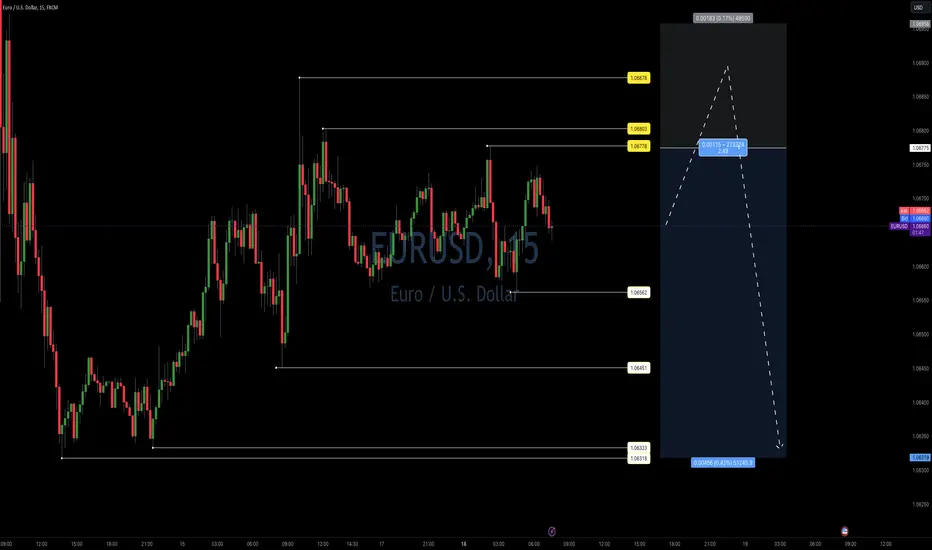
EUR USD IdeaWe are currently observing the US Dollar trading in a sideways pattern, situated just behind the daily supply and demand zones. This situation has resulted in the accumulation of a significant number of stop-loss orders on both the sell and buy sides. Additionally, there are fundamental drivers expected to impact the Dollar later this week.
Given this scenario, it's crucial for us to carefully evaluate our trading strategy. We need to determine the most logical approach to trade the EUR/USD lower and the Dollar higher. Up to this point, we have refrained from initiating a short position, as we missed the opportunity to enter at the supply zone last week.
However, if we witness the market triggering the yellow stops on the chart and subsequently targeting the white liquidity zones on the chart, it could strongly suggest institutional involvement. Let's continue to closely monitor the market to see how this situation develops.
Dollar Bullish Momentum Continues Despite Global Challenges
The global economy is facing a number of challenges, including rising inflation, slowing growth, and geopolitical tensions. These challenges have led some economists to warn of a potential stagflation environment, characterized by high inflation and low economic growth. Overall, the dollar had a few battles with other intermarket factors that tried to halt its bullish momentum, which has been ongoing for months.
The euro had many indications last week that it plans to strengthen its currency by increasing interest rates in the near future. Germany, which is the eurozone's largest economy, supported this with its ZEW economic sentiment, which came back better than expected, causing short-term weakness during the New York session. Fuel was then thrown on the fire, making the dollar aggressively bullish with the statements made during the ECB press conference. In addition, the unemployment claims and retail sales being better than expected fueled the dollar's ongoing bullish momentum.
With the upcoming Fed rate, where do you think is the next destination for the dollar?

Has Oil Reached Peak Demand? Unveiling the Unique OPEC+ DealIntroduction:
In recent years, the global oil market has witnessed significant shifts that have left traders and analysts questioning the future of this vital commodity. One of the most intriguing developments is the unique Russia-Saudi Arabia OPEC+ deal, which has sparked speculation about whether we have reached peak oil demand. In this article, we will delve into the details of this groundbreaking agreement and encourage traders to question their long-term perspectives on oil in a cautious tone of voice.
Understanding the Russia-Saudi Arabia OPEC+ Deal:
The Russia-Saudi Arabia OPEC+ deal, initiated in 2016, aimed to stabilize oil prices by managing production levels. This unprecedented alliance brought together the world's largest oil producers, including Russia, Saudi Arabia, and other OPEC members, to collectively adjust their output to balance supply and demand. The agreement's primary objective was to prevent a repeat of the 2014 oil price crash, which had severe repercussions for the global economy.
Peak Demand: A Paradigm Shift:
However, the dynamics of the global energy landscape have evolved since the inception of the Russia-Saudi Arabia OPEC+ deal. Heightened concerns over climate change, coupled with the rapid growth of renewable energy sources, have led to a paradigm shift in the way we perceive and consume energy. As a result, the notion of peak oil demand has gained traction, suggesting that global oil demand may have reached its peak and is now on a downward trajectory.
Call-to-Action: Questioning Longs on Oil:
In light of these emerging trends, traders must reevaluate their long-term perspectives on oil. While the oil demand will likely persist for years to come, the Russia-Saudi Arabia OPEC+ deal and changing global dynamics necessitate a cautious approach. Here are a few key points to consider:
1. Diversify Your Portfolio: As the energy landscape transforms, it becomes crucial to diversify investment portfolios to include renewable energy sources, clean technologies, and other sustainable sectors. This will help mitigate potential risks associated with a declining demand for oil.
2. Stay Informed: Keep a close watch on market trends, technological advancements, and government policies that promote renewable energy. Understanding the evolving landscape will enable traders to make informed decisions and adapt to changing market conditions.
3. Embrace Innovation: Explore opportunities within the renewable energy sector, such as investing in solar, wind, or hydrogen technologies. These sectors are expected to experience significant growth and may provide alternative avenues for profitable investments.
Conclusion:
The unique Russia-Saudi Arabia OPEC+ deal has undoubtedly played a crucial role in stabilizing oil prices and ensuring market equilibrium. However, the rise of renewable energy sources and growing concerns over climate change have led to the notion of peak oil demand. As traders, it is essential to question our longs on oil and adopt a cautious approach while diversifying our portfolios, staying informed, and embracing innovation. By doing so, we can navigate the evolving energy landscape and seize opportunities that arise from this transformative period in the history of the global oil market.

USDX UPATEhi all
My understanding is that the usdx has already been price in.
The FOMC meets eight times a year and issues projections in march, june, september, and december.
FED announces two rate hikes in June. 1st increases the rate in July to 5.50.
Since the impact from oil barely began in September, I don't think the FOMC will raise interest rates this week to 5.75. Therefore, the FOMC will raise rates for the 2nd time in September, to 25 basis points, once the CPI data in September reveals just how severe the harm is. I expect the USDX strengthening at that time.
**My trading strategy is not intended to be a signal. It's a process of learning about market structure and sharpening my trading skills**
Thanks a lot for your support

USOIL WEEKLY TRADE IDEAhi all
Since Saudi Arabian oil output was expected to be reduced on August 28, the price of US oil has been rising steadily for four days.
Not only will the US economy be impacted by this oil decrease, but also the primary currency. The CPI is approaching, and the FED announced a raise 0.25 bps at its meeting in September.
So, from a technical standpoint, I expect a pullback around 38 - 50 fibo retracement before continuing long oil until cpi and fomc.
Let me know what you think In the comments!
**My trading strategy is not intended to be a signal. It's a process of learning about market structure and sharpening my trading skills**
Thanks a lot for your support

XAUUSD, correction to 1932 Gold may correct upwards to 1932 before potentially declining further to 1920 and possibly to 1914.

EURUSD, to decline further The price movement fulfilled my previous idea publication.
What do I expect next??
EURUSD is expected to potentially fulfill a Fibonacci retracement to the 1.07658 resistance level before declining further to the next significant support level at 1.06375.
