Fundamental Market Analysis for May 6, 2025 USDJPYUSDJPY:
The Japanese Yen (JPY) declined against its US counterpart during Tuesday's Asian session, albeit without any follow-through selling. Despite the Bank of Japan's (BoJ) ‘restrained’ guidance last Thursday, Japan's rising inflation and prospects for continued wage increases leave the door open for further policy tightening by the central bank. In addition, uncertainty over US President Donald Trump's trade policy and rising geopolitical tensions continue to act as tailwinds for the safe-haven yen.
Meanwhile, the prospect of more aggressive rate cuts by the Federal Reserve (Fed) is not helping the US Dollar (USD) attract meaningful buyers and is helping to limit the upside for the USD/JPY pair. Traders also seem unwilling to wait for more signals on the Fed's policy outlook before positioning for the next leg of directional movement. Thus, the main focus will be on the outcome of the two-day FOMC meeting, which starts this Tuesday and which will give the dollar a fresh impetus.
Trading recommendation: BUY 143.90, SL 143.60, TP144.80
Fundamentalanalsysis

EGX30 Trend AnalysisEGX30 stock started to fall, reaching the 32,383.579 support line, the 32,343.473 support line, and the 32,283.315 support line, showing the sellers' dominance over the buyers. This is because investors are cautious about the U.S. meeting with many countries, including China, on trade deals, aiming to secure a fair trade deal. In addition, it was expected that the EGX30 would not breach the resistance line 32,463.789, as there is no historical upward trend in this zone.

Fundamental Market Analysis for May 6, 2025 GBPUSDGBPUSD:
The GBP/USD pair started the new week on a subdued note and is fluctuating in a narrow trading range around 1.3260-1.3265, near the one-week low reached during the Asian session.
The US Dollar (USD) remains on the defensive below multi-week highs amid heightened economic uncertainty amid US President Donald Trump's tariff plans and is a key supportive factor for the GBP/USD pair. Furthermore, the prospect of more aggressive policy easing by the Federal Reserve (Fed) is further undermining the US Dollar.
Despite a better than expected US non-farm payrolls report on Friday, investors seem convinced that the US central bank will resume its rate-cutting cycle in June and reduce borrowing costs by 100 basis points by the end of this year. This, along with optimism about a potential de-escalation of the trade war between the US and China, is reducing demand for the safe-haven dollar.
However, traders seem reluctant to make new bullish bets on GBP/USD and prefer to wait for this week's key event - the Bank of England's (BoE) monetary policy meeting on Thursday. The UK central bank is expected to cut interest rates by 25bps and take a somewhat soft stance amid downside risks to growth from the trade war.
In addition, this week traders will face the publication of the FOMC meeting minutes, which will affect the USD price dynamics and give a meaningful impetus to the GBP/USD pair.
Trading recomendation: SELL 1.3280, SL 1.3290, TP 1.3180

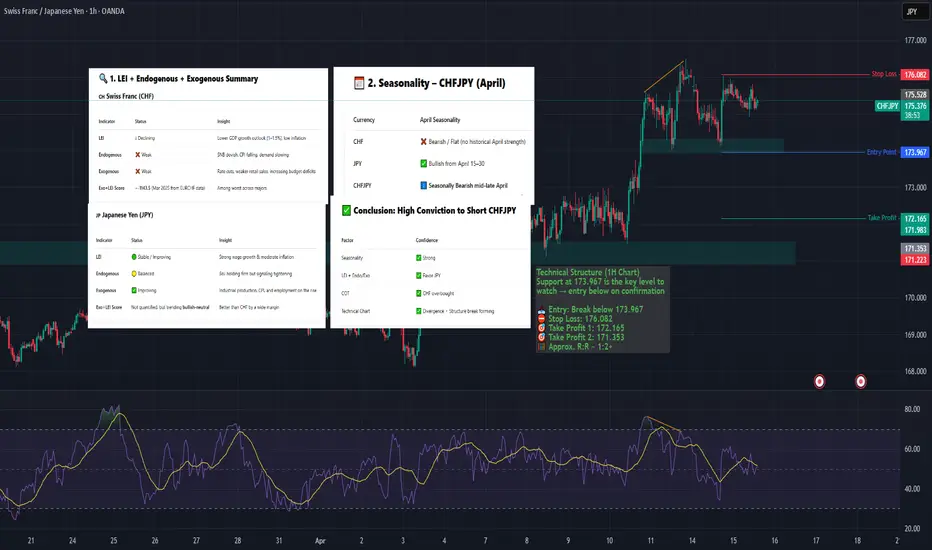
CHFJPY – Bearish Reversal Setup (Mid-April)Summary
CHFJPY short is supported by weak macro + divergence + seasonal timing.
CHF is fundamentally the weakest major, while JPY is seasonally strong and technically aligned.
🧠 Fundamental & Seasonal Overview
CHFJPY presents a high-probability short opportunity for the second half of April:
CHF Fundamentals = Weakest among majors
↳ SNB recently cut rates to 0.25%, CPI down to 0.3%, GDP slowing
↳ Exo+LEI Score ≈ -1143 — highly bearish
JPY Fundamentals Improving
↳ BoJ cautiously hawkish (wage growth + inflation rising)
↳ Seasonality favors JPY mid-late April
COT: CHF near top → risk of unwind; JPY also elevated, but justified by fundamentals
📉 Seasonality
CHFJPY is historically bearish from April 15–30
CHF flat to weak, while JPY typically strengthens in risk-off flows and Q2
Fundamental Market Analysis for March 01, 2025 USDJPYThe USD/JPY pair is trading with small losses, hovering around the mid-143.00s after disappointing US economic growth data and weak Japanese economic reports caused a divergence in sentiment between the two currencies. The US economy contracted 0.3 per cent in the first quarter of 2025, the first contraction since 2022, missing growth expectations and highlighting the impact of rising imports and government spending cuts. At the same time, Japan released weaker-than-expected industrial production and retail sales data, limiting the yen's gains even as global risk appetite declined.
On the macroeconomic front, the US Bureau of Economic Analysis reported that real GDP contracted 0.3% in Q1, missing the market forecast for a 0.4% increase and slowing sharply from the 2.4% growth in Q4 2024. The contraction was primarily driven by a 41 per cent rise in imports and lower government spending. Meanwhile, core PCE inflation, the Fed's preferred measure of inflation, fell to 2.3 per cent year-on-year, in line with expectations and below February's 2.5 per cent. Other data showed a slowdown in job creation, with the ADP report showing just 62,000 new jobs in April against expectations of 108,000.
Despite the softer data, personal spending remained flat in March, rising 0.7%, while incomes rose 0.5%. However, market sentiment turned cautious, with the Dow Jones Industrial Average falling more than 200 points to stagnate around 40,300.
In Japan, the yen weakened 0.5% against the dollar as industrial production and retail sales data disappointed, highlighting the fragility of the domestic economy.
Trade recommendation: BUY 144.20, SL 144.00, TP 145.00

Fundamental Market Analysis for April 30, 2025 GBPUSDThe GBP/USD pair continues to fall for the second consecutive session, hovering near 1.3390 during Asian trading on Wednesday. The pair has been under pressure as the US dollar has strengthened amid renewed optimism over trade developments between the US and China. Traders are now turning their attention to the upcoming release of the March Personal Consumption Expenditure (PCE) price index, which is a key inflation gauge for the Federal Reserve.
The U.S. Dollar Index (DXY), which measures the dollar's exchange rate against six major currencies, remains above 99.00, suggesting U.S. Treasury yields are rising. The 2-year and 10-year US bond yields broke a four-day losing streak and were trading around 3.66 per cent and 4.17 per cent respectively at the time of writing.
On the data front, the JOLTS US job openings report released on Tuesday showed a decline in the number of open positions to 7.19 million in March - the lowest level since September 2024 - indicating a cooling in labour demand. The figure fell short of expectations and emphasised growing economic uncertainty.
Adding to GBP/USD's decline are rising expectations that the Bank of England (BoE) will cut rates at its May meeting. Lower inflation expectations in the United Kingdom (UK) and increasing global economic factors favour a rate hike.
Bank of England Governor Megan Green recently stated that tariffs proposed by US President Donald Trump could lead to lower inflation in the UK, although significant uncertainties remain over the broader economic impact and recent tax hikes for employers.
Trading recommendation: SELL 1.3390, SL 1.3420, TP 1.3300

XAUUSD is UncertainA few of high impact news tomorrow and it will determine if XAUUSD will continue its trend or break further correct itself tomorrow. If it breaks 3300, the probability it will drop further for correction is highly probable. If not then it will continue its trend to the upside.

Fundamental Market Analysis for April 29, 2025 EURUSDEUR/USD is down to 1.14150 in the early Asian session on Tuesday. The euro (EUR) is weakening against the US dollar (USD) amid rising bets for further rate cuts by the European Central Bank (ECB) in June. Investors expect further US trade policy developments ahead of the release of the much-anticipated US Non-Farm Payrolls (NFP) data on Friday.
US President Donald Trump said progress is being made and he has spoken to Chinese President Xi Jinping, although Beijing denies that trade talks are underway. U.S. Treasury Secretary Scott Bessent said he spoke with Chinese authorities last week but did not mention tariffs.
On Monday, Bessent said the U.S. government is in contact with China, but it is up to Beijing to take the first step to de-escalate the tariff fight with the U.S. over the trade imbalance between the two countries. Investors will be keeping a close eye on the US-China relationship. Trump's chaotic trade policies have undermined faith in US assets and the common currency has become an alternative destination for investors' cash. Any signs of an escalating trade war between the US and China could have a negative impact on the US dollar and serve as a tailwind for EUR/USD.
On Saturday, Reuters reported that ECB policymakers are increasingly confident of cutting interest rates in June as inflation continues to fall. On Monday, ECB chief Olli Rehn said the central bank may cut interest rates below the neutral level that keeps the economy in balance.
Trading recommendation: SELL 1.13800, SL 1.14000 , TP 1.13000

Fundamental Market Analysis for April 28, 2025 USDJPYUSDJPY:
The Japanese yen (JPY) fluctuated in a narrow range in Monday's Asian session and paused its recent pullback from a multi-month high reached last week against its U.S. counterpart. U.S. Treasury Secretary Scott Bessent did not support President Donald Trump's statement that tariff talks with China are underway. That tempered optimism about a quick resolution to trade tensions between the world's two largest economies and provided some support for the safe-haven yen.
Meanwhile, traders pushed back expectations of an immediate interest rate hike by the Bank of Japan (BoJ) due to rising economic risks from US tariffs. However, signs of rising inflation in Japan leave the door open for further BoJ rate hikes this year, which is a big divergence from bets on more aggressive Federal Reserve (Fed) policy easing. This keeps USD bulls on the defensive and also serves as a tailwind for the low-yielding Yen.
Trading recommendation: SELL 143.20, SL 143.60, TP 142.50

The Central Bank of Egypt's Decision Impact on EGX30EGX30 stock shifted to a new zone, between the 31,865 resistance line and 29,991 support line, reflecting the buyers' dominance over the sellers'. It is expected to reach the resistance line 31,949 then 32,025, and in case of falling, it's expected to reach the support line 31,831 then 31,798. In addition, this zone is a result of the decision of The Central Bank of Egypt concerning the interest rate cut that was expected by most investors which didn't recognizably impact the stock market.

9 Simple Ratios Every Great Investor Uses - Buffett Included!Forget the hype, headlines, or hope. These 9 financial ratios are what real investors actually use to pick winners, but...
P/E? ROE? EPS? 🧐
- What are they, or better yet, WHO are they? 🤯
- How high is “too high”?
- Is a low number always good, or just a trap?
- Do all industries follow the same rules… or is that another myth?
Buffett. Greenblatt. Graham. Lynch.
They didn’t rely on vibes — they trusted fundamentals
After years of relying on charts, I built a 9-point fundamentals checklist to filter stocks faster and smarter. Now I’m sharing it with real-life examples and key insights to help you spot what really makes a stock worth owning:
Easy enough for new investors diving into fundamentals
Sharp enough to level up seasoned pros
Real enough to avoid hype
…but the truth is: these numbers did flag companies like Amazon, Apple, and Nvidia before the market gave them credit.
-----------------------------------------------------
✅ Quick Reference Table
Scan the table, then dive into the stories…
First Pro Tip: Bookmark this. You’ll check these before every stock pick.
-----------------------------------------------------
📊 1. P/E Ratio | Price-to-Earnings
What it tells you: How much you pay for each dollar of a company’s profit.
Short Example: A P/E of 20 means you pay $20 for $1 of profit. High P/E? Expect big growth or risk overpaying.
Strong: Between 15 and 25
Caution: Above 30 (unless fast growth)
Industry Averages:
- Tech: 25–40
- Utilities: 10–15
- Consumer Staples: 15–20
- Energy: 10–20
- Healthcare: 20–30
Story: In early 2023, NVIDIA’s P/E ratio hovered around 25, near the low end for tech stocks. Investors who saw this as a steal amid the AI boom were rewarded—NVIDIA’s stock made 4x by the end of 2024 as AI chip demand soared.
Contrast that with Tesla in Q1 2025, when its P/E spiked above 40 with slowing sales and Tesla’s stock dropped 50% in weeks.
Pro tip: A low P/E is not always good. If growth is weak or falling, it's often a trap.
Example: A utility company with a P/E of 30 is probably overpriced. A tech stock with 35 might still be fair — if growth justifies it.
-----------------------------------------------------
🧠 2. PEG Ratio | Price-to-Earnings-to-Growth
What it tells you: If a high P/E is worth it based on future profit growth. Whether the earnings growth justifies the price.
Short Example: A PEG below 1 means you’re getting growth at a fair price. High PEG? You’re overpaying.
Strong: Below 1
Caution: Above 2
Industry Averages:
- Software: below 1.5 is solid
- Consumer Goods: Below 2 is more realistic
- Tech: Below 1
- Consumer Staples: Below 1.5
- Healthcare: Below 1.2
- Financials: Below 1.5
- Energy: Below 1.3
Story: In mid-2022, Salesforce’s PEG was 0.8 (P/E 35, forward EPS growth 45%) as cloud demand surged. Investors who spotted this steal saw the stock climb 130% by the end of 2024. Meanwhile, Peloton in 2023 had a P/E of 20 but near-zero growth (PEG above 3). Its stock cratered -50% as fitness trends faded.
Story: NVIDIA’s PEG hit 0.9 in Q3 2023 (P/E 30, growth 35%) during AI hype, a steal for tech (average PEG below 1.2).
PEG filters hype. A stock can look expensive until you factor in growth.
-----------------------------------------------------
🧱 3. P/B Ratio | Price-to-Book
What it tells you: How much you pay compared to what the company owns (like buildings or cash).
Short Example: A P/B below 1.5 means you’re paying close to the company’s asset value. High P/B? Expect strong profits or risk.
Strong: Below 1.5
Caution: Below 1 + poor earnings = value trap
Industry Averages:
- Banks: Below 1.5
- Insurance: Below 1.3
- REITs: Use NAV (aim below 1.2)
- Tech: Often ignored
- Energy: Below 2
Story: In 2024, JPMorgan Chase’s P/B was 1.4, solid for banks (average below 1.5). Investors who bought enjoyed 100% gains.
n 2023, Bed Bath & Beyond’s P/B fell below 1 with collapsing earnings. It looked cheap but filed for bankruptcy that year.
Tip: Only use this in asset-heavy sectors like banking or real estate.
-----------------------------------------------------
⚙️ 4. ROE | Return on Equity
What it tells you: How well a company turns investor money into profits.
Short Example: An ROE above 15% means the company makes good money from your investment. Low ROE? Weak returns.
Strong: Above 15%
Caution: Below 10% unless in slow-growth industries
Industry Averages:
- Tech: 20–30%
- Consumer Staples: 15–25%
- Utilities: 8–12%
- Financials: 10–15%
- Healthcare: 15–20%
Story: Coca-Cola (KO) has kept ROE above 35% for years, a sign of brand power and pricing strength.
Eli Lilly’s (LLY) ROE stayed above 25% from 2022–2024, a healthcare leader (average 15–20%). Its weight-loss drug Mounjaro drove consistent profits, lifting the stock 150%+ in two years. Checking ROE trends helped investors spot this winner.
Tip: If ROE is high but D/E is also high, be careful, it might just be leverage.
-----------------------------------------------------
💰 5. Net Margin | Profitability
What it tells you: How much profit a company keeps from its sales or what % of revenue ends up as pure profit.
Short Example: A 10% margin means $10 profit per $100 in sales. Low margin? Tough business or high costs.
Strong: Above 10-15%+
Caution: Below 5%
Industry Averages:
- Software: 20–30%
- Retail: 2–5%
- Manufacturing: 8–12%
- Consumer Staples: 10–15%
- Energy: 5–10%
- Healthcare: 8–15%
Story: Walmart’s (WMT) 2% net margin looks tiny — but it’s expected in retail.
A software firm with 5%? That’s a warning — high costs or weak pricing.
In 2023, Zoom’s (ZM) net margin fell to 5% (down from 25% in 2021), well below software’s 20–30% average. Pricing pressure and competition crushed its stock quite a lot. Meanwhile, Apple’s 25% margin in 2024 (tech average 20%) remained a cash cow.
Tip: Margins show whether the company owns its pricing or competes on price.
-----------------------------------------------------
💣 6. D/E Ratio | Debt-to-Equity
What it tells you: How much debt a company uses compared to investor money.
Short Example: A D/E below 1 means more investor cash than debt. High D/E? Risky if profits dip.
Strong: Below 1
Caution: Above 2 (except REITs or utilities)
Industry Averages:
- Tech: 0–0.5
- Industrials: 0.5–1.5
- REITs: 1.5–2.5 (manageable due to structure)
- Utilities: 1–2
- Energy: 0.5–1.5
Story: In 2024, Tesla’s D/E dropped below 0.3 (tech average 0–0.5) as it paid down debt, signaling strength despite sales dips - a massive rally afterward.
Tip: Rising debt + falling profits = a storm coming. Always check both.
-----------------------------------------------------
💵 7. Free Cash Flow (FCF)
What it tells you: Cash left after paying for operations and growth investments.
Short Example: Apple’s $100 billion cash pile in 2024 funded stock buybacks, boosting shares. Low cash? Trouble looms.
Strong: Positive and growing
Caution: Negative for multiple years
Sector notes:
- Tech: Lots of cash (think billions)
- Industrials: Up and down, check trends
- REITs: Look at FFO (cash from properties), aim high
- Energy: Has cash, but swings with oil prices
- Healthcare: Steady cash, not too high
Story: Netflix had negative FCF while scaling content. Once costs stabilized, FCF turned positive and stock re-rated sharply.
Pro tip: Profits don’t mean much without real cash. FCF is often more honest.
Cash is king: Companies need cash to pay bills, reduce debt, or fund growth. If FCF is falling, they might be burning through cash reserves or borrowing, which isn’t sustainable.
Potential issues : This mismatch could signal problems like poor cash collection, heavy spending, or even accounting tricks to inflate profits.
-----------------------------------------------------
🚀 8. EPS Growth | Earnings Power
What it tells you: How fast a company’s profits per share are growing.
Short Example: EPS up 10% yearly means more profit per share, lifting stock prices. Flat EPS? No growth, no gains.
Strong: Above 10%
Caution: Below 5%, flat/negative for 3+ years
Industry Averages:
- Tech: 15–30%
- Staples: 5–10%
- REITs: 3–6% (via FFO growth)
- Healthcare: 10–15%
- Financials: 5–10%
- Energy: 5–15% (cyclical)
Story: In Q1 2024, NVIDIA’s forward EPS growth of 30% (tech average 20%+) fueled a rally as AI chips dominated. Checking forward estimates helped investors avoid traps like Intel, with flat EPS and a drop.
Pro tip: A stock with flat EPS and no dividend? There’s no reason to own it.
-----------------------------------------------------
💵 9. Dividend Yield | Passive Income
What it tells you: How much cash you get yearly from dividends per dollar invested.
Short Example: A 3% yield means $3 per $100 invested. High yield? Check if it’s sustainable.
Good: ~3–4%
Red Flag: Above 6% with a payout ratio above 80-90%
Industry Averages:
- Utilities: 3–5%
- REITs: 3–6%
- Consumer Staples: 2–4%
- Tech: 0–2%
- Energy: 2–5%
-----------------------------------------------------
💡 Final Thought: How to Use All of This
Top investors don’t use just one metric. They look at the whole picture:
Good growth? Check PEG.
Good profits? Confirm with ROE and margin.
Safe balance sheet? Look at D/E and cash flow.
Fair valuation? P/E + FCF Yield + P/B.
Real power = Combining metrics.
A company with P/E 15, PEG 0.8, ROE 20%, low debt, and positive FCF? That’s your winner.
A stock with P/E 8, but no growth, high debt, and negative cash flow? That’s a trap.
-----------------------------------------------------
Real-World Combos
🎯Winners:
Tech Gem: P/E 20, PEG 0.8, ROE 25%, D/E 0.4, growing FCF, EPS 20%+ (e.g., NVIDIA 2023: AI-driven growth, stock soared).
Energy Steal: P/E 15, P/B 1.5, FCF positive, Dividend Yield 3.5% (e.g., Chevron 2023: Cash flow king).
⚠️Traps:
Value Trap: P/E 8, flat EPS, D/E 2.5, negative FCF (e.g., Peloton 2023).
Overhyped Tech: P/E 50, PEG 3, Net Margin 5%, D/E 1.5 (e.g., Rivian 2024).
-----------------------------------------------------
🚀 Share your own combos!
What do you personally look for when picking a stock?
If you spotted something off in the numbers, or have a valuable insight to add — please, drop it in the comments.👇
💡 Let’s turn this into a thread that’s not just good but superb and genuinely helpful for everyone.
-----------------------------------------------------
Final Thought
“Buy great companies at fair prices, not fair companies at great prices.” – Warren Buffett
This guide gives you the map.
Charts, tell you when.
These numbers tell you what, and why.
And this post?
It’s just the beginning!
These 9 metrics are part one of a bigger series I’m building — where we’ll go even deeper, with more advanced ratios, smarter combos, and real case studies.
If this guide helped you see financial numbers a little clearer, there’s a good chance it’ll help your investor friend too, especially if they’re just starting their journey...🤝Share it with them!
I built this as much for myself as for anyone else who wants to get better.👊
If you made it this far — thank you! 🙏
...and super thankful if you hit "The Boost" on this post 🚀
Cheers,
Vaido

Fundamental Market Analysis for April 24, 2025 EURUSDEvent to watch out for today:
15:30 EET. USD - Number of Initial Jobless Claims in the U.S.
EURUSD:
EUR/USD rises towards the 1.1335 level during the early Asian session on Thursday. Easing concerns over potential tariff threats from US President Donald Trump are putting some pressure on the US Dollar (USD).
According to the Federal Reserve's (Fed) Beige Book report released on Wednesday, businesses facing the early stages of Trump's tariffs are looking for ways to pass on rising costs to consumers. Companies have reported receiving warnings from suppliers about price increases and are looking for ways not to absorb those increases, noting uncertainty about whether they can pass them on to customers.
Earlier this month, Trump imposed a basic import tax of 10 per cent or more on dozens of countries, but then unexpectedly suspended the taxes for 90 days to give countries a chance to negotiate lower rates. Nevertheless, trade policy uncertainty and concerns over slowing economic growth in the US could drive the dollar lower and create a tailwind for EUR/USD.
Last week, the European Central Bank (ECB) cut its main interest rate by a quarter of a percentage point to 2.25% at its April meeting. During a press conference, ECB President Christine Lagarde said that the US tariffs on EU goods, which have increased from an average of 3% to 13%, are already hurting the prospects of the European economy.
Trading recommendation: BUY 1.1350, SL 1.1320, TP 1.1430

Bitcoin Rallies on Stablecoin Optimism and Liquidity BoostMacro:
- The crypto market rebounded as sentiment improved following the US Treasury Secretary's proposal to ease stablecoin regulations, boosting trading volumes and risk appetite.
- On-chain data reflects growing activity. The average bitcoin trade size rose 15% MoM, overall volume jumped, and 78% of supply is now in profit.
- Liquidity support from the increasing M2 money supply in China and the US has further enhanced bitcoin's appeal.
Technical:
- BTCUSD surged to resistance near 94300, aligning with the 100% Fibo Extension, before forming a Doji candle that signals possible correction. The price remains above both EMAs, indicating a bullish shift.
- If the price breaks below 92000, it may leads to a pullback toward the 87000–90000 support zone, near the 23.6%-38.2% Fibo Retracement levels.
- A breakout above 94300 may open the door for a move toward the next resistance around 101400.
Analysis by: Dat Tong, Senior Financial Markets Strategist at Exness

Fundamental Market Analysis for April 23, 2025 USDJPYThe Japanese yen (JPY) declined against its US counterpart for a second straight day on Wednesday and retreated further from the multi-month peak reached the previous day. The Trump administration officials' comforting comments on US-China trade talks triggered a sharp rebound in global risk sentiment, which in turn had a strong impact on traditional safe-haven assets, including the yen. Moreover, a slight recovery in the US dollar (USD) from multi-year lows, supported by easing concerns over Federal Reserve (Fed) independence, pushed the USD/JPY pair to a one-week high, a level above 143.000 during the Asian session.
Growing optimism that the US and Japan are moving closer to a temporary trade agreement is helping the yen, which reacted weakly to unimpressive domestic PMIs, to pause its intraday decline. In addition, strengthening expectations that the Bank of Japan (BoJ) will continue to raise interest rates in 2025 is keeping JPY bears from betting aggressively. Meanwhile, investors are losing confidence in the US economy amid Trump's rapidly shifting stance on trade policy. This, as well as bets that the Fed will soon resume its rate-cutting cycle, is holding back the dollar and taking the USD/JPY pair below 142.000 in the last hour.
Trading recommendation: SELL 141.700, SL 142.100, TP 140.500
Fundamental Market Analysis for April 22, 2025 GBPUSDGBPUSD:
The GBP/USD pair is trading in positive territory around 1.3370 during the early Asian session on Tuesday. Concerns over slowing growth in the United States (US) and worries over the independence of the Federal Reserve (Fed) are driving the US Dollar (USD) lower and creating a tailwind for the major pair.
US President Donald Trump condemned Powell for continuing to maintain a “wait-and-see” monetary policy until there is clarity on how the new tariff policy will affect the economic outlook. In a Truth social media post, Trump warned that the US economy will slow down if Powell doesn't cut interest rates immediately.
Heightened uncertainty surrounding Trump's tariffs and rising trade tensions between the U.S. and China are undermining the U.S. dollar across the board.
On the other hand, softer UK consumer price index (CPI) inflation data for March and global uncertainty paved the way for an interest rate cut by the Bank of England (BoE) at its May meeting. Financial markets are now betting on an interest rate cut at the Bank of England's May meeting, estimating an 86% probability of this happening, according to LSEG data. This, in turn, could affect the Pound Sterling (GBP) exchange rate against the US Dollar.
Trading recommendation: BUY 1.3425, SL 1.3395, TP 1.3510

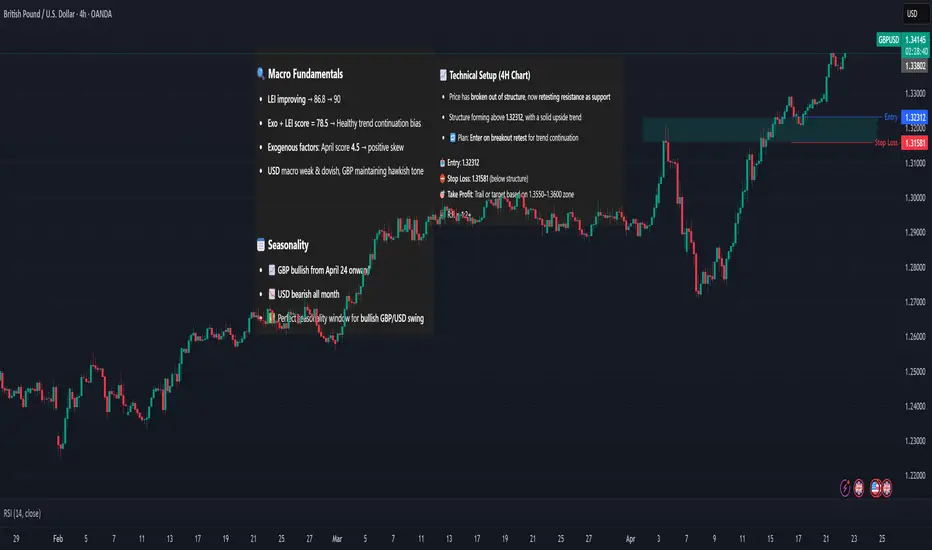
GBP/USD – Breakout Retest Setup🔍 Macro Fundamentals
LEI improving → 86.8 → 90
Exo + LEI score = 78.5 → Healthy trend continuation bias
Exogenous factors: April score 4.5 → positive skew
USD macro weak & dovish, GBP maintaining hawkish tone
📅 Seasonality
📈 GBP bullish from April 24 onward
📉 USD bearish all month
✅ Perfect seasonality window for bullish GBP/USD swing
📊 COT Sentiment
Both GBP and USD = ⚖️ Neutral
→ No positioning pressure, clean technical entry expected
📈 Technical Setup (4H Chart)
Price has broken out of structure, now retesting resistance as support
Structure forming above 1.32312, with a solid upside trend
🔁 Plan: Enter on breakout retest for trend continuation
📥 Entry: 1.32312
⛔ Stop Loss: 1.31581 (below structure)
🎯 Take Profit: Trail or target based on 1.3550–1.3600 zone
🧮 R:R ≈ 1:2+
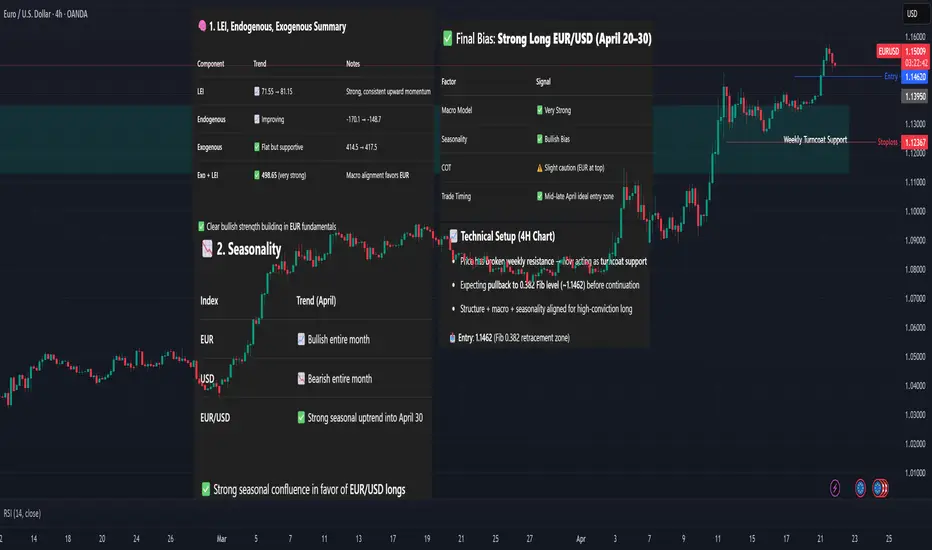
EUR/USD – Pullback Entry After Weekly Breakout🧠 Macro View
LEI rising steadily: 71.5 → 81.15
Endogenous strength improving each month
Exo+LEI composite score: 498.65 → one of the strongest major FX models
USD: Fundamentally weak with dovish Fed, neutral COT
📅 Seasonality
📈 EUR Index bullish throughout April
📉 USD Index bearish all month
🔥 EUR/USD seasonality = strong long bias into April 30
📈 Technical Setup (4H Chart)
Price has broken weekly resistance → now acting as turncoat support
Expecting pullback to 0.382 Fib level (~1.1462) before continuation
Structure + macro + seasonality aligned for high-conviction long
📥 Entry: 1.1462 (Fib 0.382 retracement zone)
⛔ Stop Loss: Below (1.12424)
🎯 Take Profit: Retest high or 1.1583 and beyond (extension optional)
🧮 R:R ≈ 1:2.2+
Fundamental Market Analysis for April 21, 2025 EURUSDEUR/USD broke out of a multi-day trading range and hit a new high since February 2022 around 1.1485 during the Asian session on Monday.
Despite “aggressive” comments from Federal Reserve (Fed) Chairman Jerome Powell, uncertainty over US President Donald Trump's trade policy continues to undermine the dollar. Last Wednesday, Powell said the Fed would likely keep the benchmark interest rate unchanged and wait for more clarity before considering any policy adjustments. Meanwhile, Trump's retaliatory tariff announcements undermined investor confidence in U.S. economic growth and drove the dollar to a two-year low early in the new week.
The aforementioned factors largely offset the European Central Bank's (ECB) soft decision last week and served as a tailwind for EUR/USD. On Thursday, the ECB cut interest rates for the seventh time in a year and warned that economic growth would be hit hard by US tariffs, bolstering the case for further policy easing in the coming months.
Moving forward, traders this week will be focused on scheduled speeches by ECB President Christine Lagarde on Tuesday and a number of influential FOMC members this week. In addition, the market's focus will be on the release of flash PMI indices, which could provide new insights into the state of the global economy. This, in turn, may give some impetus to the US dollar and EUR/USD.
Trade recommendation: BUY 1.1520, SL 1.1465 , TP 1.1565.

HEG Limited Stock Analysis [Fundamental+Technical]Company Overview:
Industry: Graphite Electrodes (used in Electric Arc Furnaces for steel production)
Parent Group: LNJ Bhilwara Group
Location: Largest graphite plant at a single location near Bhopal, MP
Global Reach: 67% export-based; presence in 35+ countries
Business Highlights
Products: UHP & HP Graphite Electrodes
Customers: Top 25 global steel companies
Capacity: Increased to 100,000 TPA in Nov 2023
Utilization: 81% (despite global slowdown)
Revenue from Operations: ₹2,394.90 Cr
Net Profit: ₹231.54 Cr (down 49% YoY)
EBITDA: ₹525.63 Cr (down 28% YoY)
EPS: ₹59.99
Net Cash Flow from Operations: ₹615 Cr (up from ₹114 Cr)
ROCE: ~7.2%
Return on Net Worth (RoNW): 5.63%
📈 Technical Insights:
Current Price: ₹474.60
50 EMA: ₹431.44 (support zone)
200 EMA: ₹429.40 (support zone)
Price is trading above both EMAs, indicating a bullish trend reversal.
Golden Cross formation (50 EMA crossing 200 EMA) recently occurred — a classic long-term bullish signal.
The stock bounced from ₹400 zone and now forming higher highs.
Key Strengths
One of the lowest-cost graphite electrode producers globally
Among top 5 global players (ex-China)
Strong relationships with major steelmakers
Backward integrated captive power: 76.5 MW
State-of-the-art technology and high R&D focus
Key Risks
Highly dependent on steel sector demand
Pricing pressure due to global oversupply and China's export surplus
Needle coke (key raw material) cost volatility
Current underutilization of capacity
Growth Triggers
Green Steel Push: EAF-based steel production expected to grow globally
Anode Powder Plant: ₹1,800 Cr investment in 20,000 TPA facility for EV battery anode materials; revenue expected from FY27
India’s EV & Steel Boom: Growing steel consumption (8.2% CAGR) and EV transition are long-term positives
SWOT Summary
Strengths:
Global presence, high export revenue, low-cost structure
Technological leadership
Weaknesses:
Profitability linked closely to global steel demand
Volatility in raw material prices
Opportunities:
EV market and EAF steel expansion
Threats
Competition from China, diversion of raw material to battery sector
Future Outlook
Near-term challenges due to soft steel demand
Medium to long-term outlook is strong, driven by:
Increasing EAF penetration
Global decarbonization policies
Strategic expansion into EV-grade graphite anodes
Analysis Based on Valuation + Chart
CMP:₹474.60
Fair Price Range: ₹600 – ₹1200(Using a conservative P/E range of 10 to 20)
Fair Value (DCF):₹1100+ (Based on 10% projected EPS growth over 5 years and a 12% discount rate.)
Support Levels:₹430 (EMA), ₹400 (price action)
Resistance Zones:₹490-500 (near-term), ₹600 (supply zone)
Disclaimer
The information provided in this report is for educational and informational purposes only and should not be construed as financial or investment advice. While every effort has been made to ensure the accuracy of data and analysis, no guarantees are made regarding future performance. Stock market investments are subject to market risks, including potential loss of capital. Please consult your financial advisor or conduct your own due diligence before making any investment decisions.

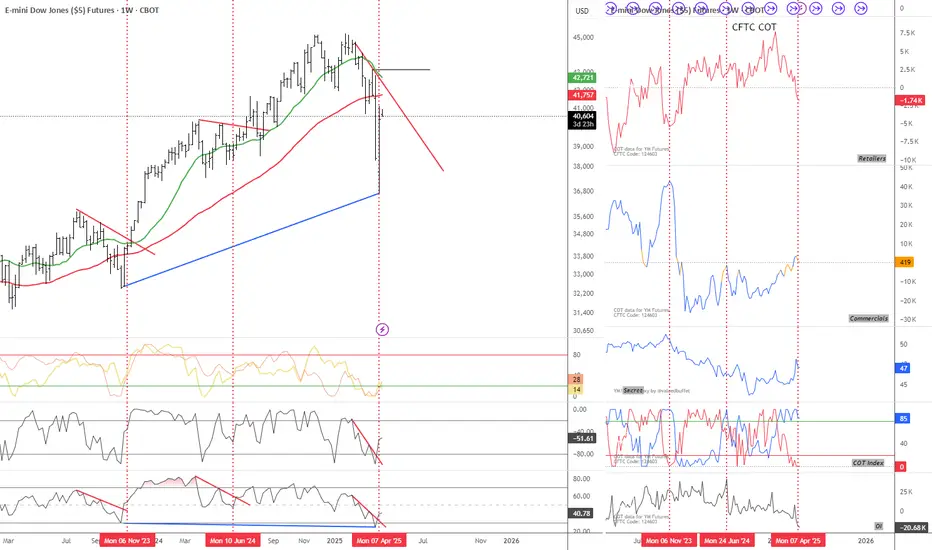
Is it going to happen again? My view to the markets right now...CBOT_MINI:YM1!
Is the Dow Jones breaking the downtrend again?
I believe there's a strong chance the markets are setting up for another move higher. From a fundamental standpoint, the recent pause in tariffs is a big deal. It removes an immediate layer of uncertainty that’s been hanging over the global economy, especially for exporters and multinational companies. On top of that, the fact that key tech products have been left out of the latest tariff actions is boosting confidence in the sector that has been leading market strength for years.
Economically, we’re still seeing resilience in key indicators. Unemployment remains low, consumer spending is steady, and central banks are staying cautious with tightening. The environment still leans more towards slow growth than recession, which supports equities over the medium term.
More importantly, my own criteria for a favorable market setup are lining up. Whether it’s sentiment, intermarket signals, or trend conditions—this looks like a solid spot for a bullish stance.
You can see my chart to check out my current viewpoint on the Dow Jones and how I’m positioning based on all this.
Not Financial Advice
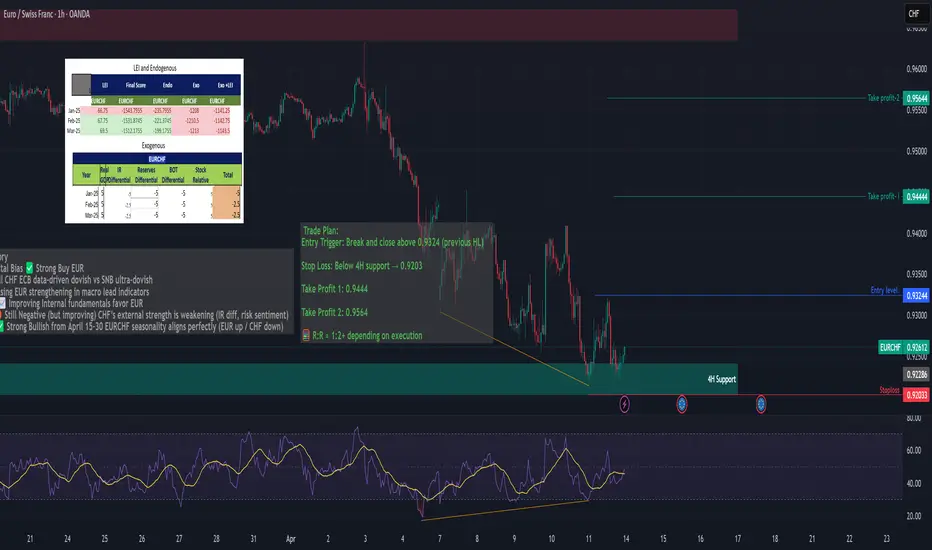
EURCHF – Bullish Reversal Setup + Fundamentals Trade Idea Summary: EUR/CHF showing strong bullish confluence:
✅ Bullish RSI Divergence on both 1H & 4H
📉 Price testing a key 4H support zone
📊 Seasonality favors EURCHF upside (bullish from April 15–30)
🧠 Fundamentals, COT, LEI + Endogenous indicators support long EUR / short CHF
ECB: Dovish but stable, EUR fundamentals improving (LEI ↑, Endo ↑)
SNB: Aggressively dovish, low inflation, weak CHF outlook
EURUSD. Weekly trading levels 14 - 18.04.2025During the week you can trade from these price levels. Finding the entry point into a transaction and its support is up to you, depending on your trading style and the development of the situation. Zones show preferred price ranges WHERE to look for an entry point into a trade.
If you expect any medium-term price movements, then most likely they will start from one of the zones.
Levels are valid for a week, the date is in the title. Next week I will adjust the levels based on new data and publish a new post.
! Please note that brokers have a difference in quotes, take this into account when trading.
The history of level development can be seen in my previous posts. They cannot be edited or deleted. Everything is fair. :)
----------------------------------------------
I don’t play guess the direction (that’s why there are no directional arrows), but zones (levels) are used for trading. We wait for the zone to approach, watch the reaction, and enter the trade.
Levels are drawn based on volumes and data from the CME. They are used as areas of interest for trading. Traded as classic support/resistance levels. We see the reaction to the rebound, we trade the rebound. We see a breakout and continue to trade on a rollback to the level. The worst option is if we revolve around the zone in a flat.
Do not reverse the market at every level; if there is a trend movement, consider it as an opportunity to continue the movement. Until the price has drawn a reversal pattern.
More information in my RU profile.
Don't forget to like Rocket and Subscribe!!! Feedback is very important to me!

WLD — Heavy Discount. Long-Term Opportunity on the TableWLD has pulled back over 80% from its previous high — a massive correction that now opens the door for long-term accumulation. The current range looks like a gift for patient players. Don’t sleep on setups like this — they don’t come often.
Follow for more high-conviction plays like this one.
Entry: 0,7-0,71
TP: 1,37-3,35
