long position is more logical than shortConsidering the overlap of support and trend line, it is expected that MACD divergence will work and usdchf currency pair will get a good buying position in these areas towards the high targets.
Fundamentalstrategy

AUDUSDAUDUSD creating an expanding flag, might be going to the upside, lets see how everything unfolds, please do comment, i'd love to know your views

3K T/P Nasdaq Short IdeaNasdaq Index
- Price been trending downward since the end of December 2021 and forming a channel chart pattern.
- Obviously more downside rather than upside potential ranging from 3K-3.9K in points. Downtrend is starting to weaken according to moving averages and and vortex sub chart indicator.
- Colored arrows represents 3 scenarios that could play out if price continue to trade within and/or breakout.

Will FLOW continue to grow?Hello everyone, let's take a look at the 1D FLOW to USDT chart as you can see the price has broken out of the downtrend channel.
Let's start by designating support sites that we can consider:
1. $ 2.69
$ 2.38
3. $ 2.16
and
4. $ 1.59
Now let's move on to the resistance that the price has on its way:
1 - $ 3.26
2 - $ 3.82
3 - $ 4.63
4 - $ 5.48
5 - $ 6.68
and
$ 6-8.20
Looking at the CHOP indicator, we can see that in the 1D range the energy was mostly used, and the MACD indicator shows a local upward trend.

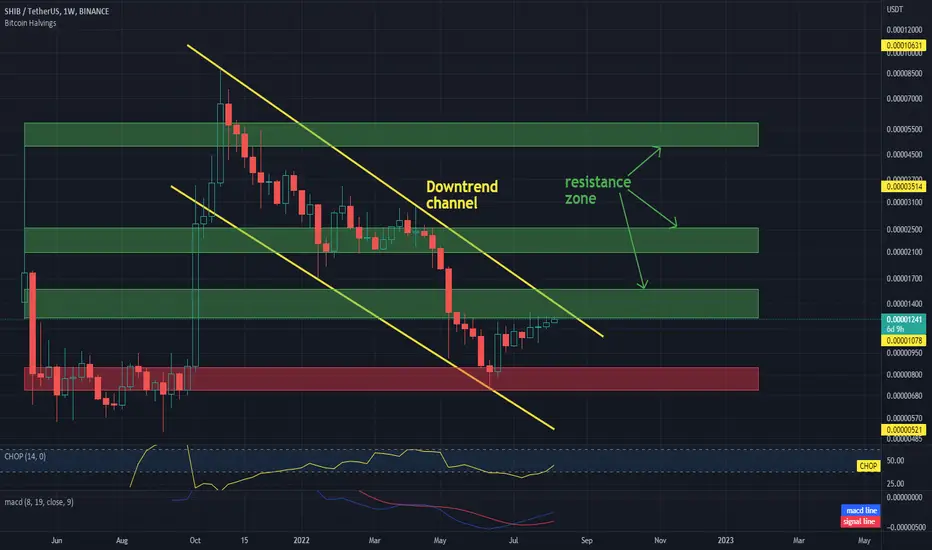
SHIB / USDT on 1Day IntervalHi everyone,
Let's take a look at the SHIBUSDT chart on the 1 day time frame.
As you can see, we are moving in the downtrend channel marked with yellow lines.
It is worth setting a support zone from which the SHIB price has rebounded, and 3 important resistance zones that the price has in front of it. We are currently fighting the first one from $ 0.00001245 to $ 0.00001567. However, it should be taken into account that in order to break the first resistance zone, we have to leave the downward channel upwards and change the trend in the long term.
The CHOP indicator shows that we are starting to gain more and more energy and the MACD indicator shows a local upward trend.
Will BNB reverse its long downtrend?Hello everyone, let's take a look at the BNB to USDT chart on a 1 day time frame. As we can see, we have been moving in the downtrend channel for a long time, while locally we are in the upward trend and in a place where we can try to break out of the long-lasting downward trend.
Let's start with the designation of the support line and as you can see the first support in the near future is $ 293, if the support breaks down, the next support is $ 271 and $ 254.
Now let's move from the resistance line, as you can see, the first resistance we are currently struggling with is $ 322 breaking the first resistance will give us a potential exit from the long downturn channel, if we can break it, the next resistance will be $ 354 and $ 400.
Looking at the CHOP indicator, we can see that in the 1-day interval most of the energy has been used, and the MACD indicator indicates that we are locally in an upward trend.

Oil soon to be longExpecting a support to be respected around the low 80$ region before proceeding for next leg upwards, biased towards inflation & supply to demand constraints.

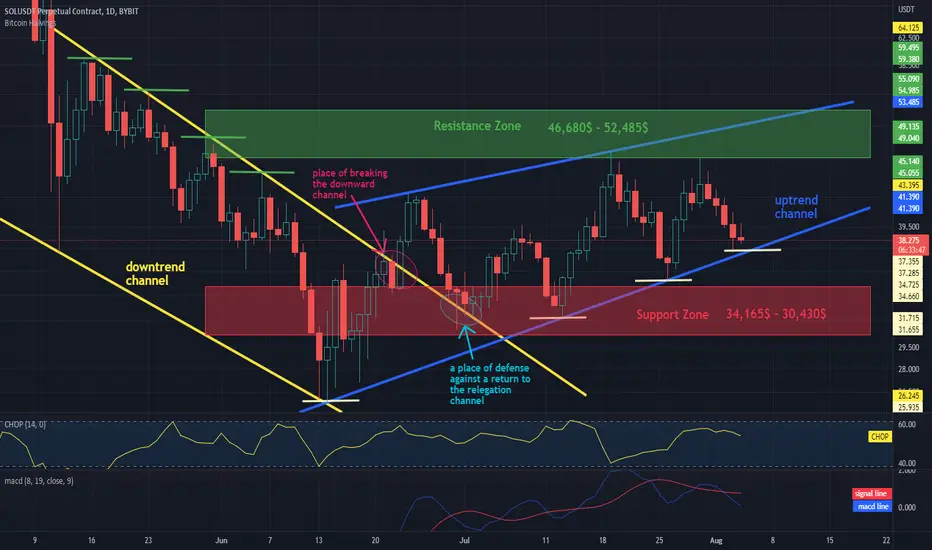
Review of the SOL situation on a 1-day intervalHi everyone,
Let's take a look at the SOLUSDT chart on the 1 day time frame.
What is striking in the foreground are two channels:
- the downtrend channel marked with yellow lines
and
- the uptrend channel marked with blue lines
Then, expressively, we can notice the place where the downward trend breaks and the point of defense of the upward trend change in which we are currently.
It is also worth designating support and resistance zones, and so we can see that the support zone is from $ 34,165 to $ 30,430, and the resistance zone is from $ 46.680 to $ 52,485.
Going further, we should pay attention to the behavior of the price, which moves nicely from the upper to the lower limit of the channel, which can potentially be used in short-term games with appropriately selected stoplots.
Remember these are my thoughts and this is not an investment advice :)
BTC ANALYSIS FROM 2011 - 2024Update 3.08.2022
Hello everyone, I would like to present what repeatability can be determined in more detail by analyzing the BTC chart, taking into account the 3 halvings we experienced and the fourth which lies ahead.
We have a log BTC chart from 2011 to today in front of us.
We will start by designating the places where BTC has done its halving, as you can see, the first halving took place in November 2012, the second halving in June 2016, the third halving in May 2020, and we also mark the halving which should be in June 2024 .
On the other hand, we mark the middle between the halves with white lines.
We will use a green box to mark the gaps between the edible and the other half so that we can see this space and repetition more clearly.
For the analysis, we will use the blue lines which represent the way btc moves, one line indicates the lowest price points, and we can see that btc touches the line repeatedly, and in the same way we can mark the places where price has reached its ATH.
It is worth noting that with the first halving, btc fell by about 86% from its ATH
on the second halving he was down about 84% from his ATH
with a 3 fold reduction, the decrease from ATH so far is about 74%.
The current low is 74% where the blue line is, but BTC sometimes has a quick dip in the candlestick which could be around 82% from the ATH.
Given the repeatability between halves, the current maximum opening should be around $ 10,500
Now we use the mean measure tool marked with the purple line and we can see that every time we cut it in half, as the average goes through half the period to half, the cane consolidates and then the price drops below our purple line.
Moving on, we also see that after each drop below average around the half of the halving, the price started to rebound and break the first trend denoted by the white line as well as exiting the yellow area, then breaking the second trend and exiting the second yellow area.
Thus, breaking the first trend is a pro-growth period, and breaking the second trend is a pro-growth period followed by price increases.
Currently, we have not yet broken the first trend, given the cyclical nature of btc and the fact that large capital is distributed similarly and often all negative news is already included in the price, we can assume that the situation will repeat itself. After breaking the second trend and breaking above the average, the price will start rising again.
Finally, we present a visualization of how the btc price may possibly move to the next halving in the coming time, we mark the path that the price may follow with a white line.
Please remember that these are not investment recommendations, everyone is responsible for their financial games, these are just our observations about the market and how the price moves.

Sell position on DXYAccording to the recent increases of the dollar and overbuying, technically, the bottom of the channel and the trend line have a good overlapping support and attracts like a magnet.
You can enter into sales with a suitable risk-to-reward ratio

BTC relies on support at $ 23,021Hi everyone.
Today we have marked the channel in which the BTC price is currently moving with blue lines.
As you can see, we have two important zones:
-the first one is the support line on which the price is currently based on $ 23,021, then we have a support zone ahead of the price, which ranges from $ 20,957 to $ 17,669, if the price drops below the designated zone, we can expect further drops to around $ 12,000.
- the second is a resistance zone, we have from $ 24,696 to $ 26,196. A breakout from this zone may result in further increases towards the resistance at the level of $ 28,754.
Currently, the price on our channel is moving nicely to the side, which could potentially be used for short-term licks.
Also worth noting is the CHOP indicator, which indicates that energy is slowly depleting, and the MACD indicator, which indicates that we have entered a local downward trend.
Remember, however, that this is not investment advice.

EURCHF - Where are the sore spots of the SNB?The SNB delievered a real game changer in the last week and hiked its rate by 0,50%. The whole market got catched on the wrong foot and the EURCHF dropped immediatly by more than 200 Pips.
So whats next for the franc?
The SNB explained that they could intervene now from both sides.
So they could either slow a appreciating CHF (as they did many times) or they could also slow a depreciating CHF by selling their huge FX reserves (that was new and unexpected by the market)
My guess is that their 1st level on the downside would be the 1.0000 level (-> round number and psychological level)
Their level on the upside could be 1.05 as the EURCHF dropped strongly 2 times in the last weeks from this level without any news or data to support this rapid weakening.
Maybe it was the SNB already with their feet on the brakes? Again I'm just guessing here and I will have a close look on the SNB data in the next weeks to verify this thesis.
So a range in the EURCHF between 1.00 and 1.05 could be plausible.
What could be the points to break this range?
1. Inflation in Switzerland would need to drop significantly to give the SNB more room to breathe (upside pressure for the EURCHF)
2. ECB would need to become more dovish (downside pressure for the EURCHF)
3. sudden positive news from the Ukraine conflict (huge upside for EURCHF possible)
(4. Of course a further slowing in the world or european economy would also lead to downside pressure for the EURCHF)

Will BTC come out of the current channel?Hi everyone.
Today we take a look at the BTC to USDT chart on a 1 hour time frame. We see an upward channel in which the price moves, and as you can see, we are currently at the upper end of our channel.
There is a resistance zone from $ 24,696 to $ 26,196 ahead of us to break, a break in this zone would result in an upward exit from the growth channel.
However, if the price starts to turn back, the first stronger support is at $ 23,021, and if it does not keep the price, we still have a support zone from $ 20,957 to $ 17,669.
It is worth paying attention to the CHOP indicator which shows that in a small interval the energy has been consumed, while the MACD indicator indicates a local upward trend.

USDCHF Headed Upward Pending FOMC NewsWelcome back! Let me know your thoughts in the comments!
**USDCHF - Listen to video!
We recommend that you keep this pair on your watchlist and enter when the entry criteria of your strategy is met.
Please support this idea with a LIKE and COMMENT if you find it useful and Click "Follow" on our profile if you'd like these trade ideas delivered straight to your email in the future.
Thanks for your continued support!
Brian & Kenya Horton, BK Forex Academy

BTC LONG 1W INTERVALHello everyone, let's take a look at the BTC to USDT chart over the weekend 1 timeframe. As you can see, the price stays below the downtrend line.
Let's start with the designation of the support line and as you can see the first support in the near future is $ 20,508, if the support breaks down, the next support is $ 19,085 and $ 17,625.
Now let's move from the resistance line as you can see the first resistance is $ 21,221, if you can break it the next resistance will be $ 23,362 and $ 24,964.
Looking at the CHOP indicator, we can see that on the weekend interval 1 the energy slowly starts to rise, and the MACD indicator indicates a possible change of the trend into an upward trend.

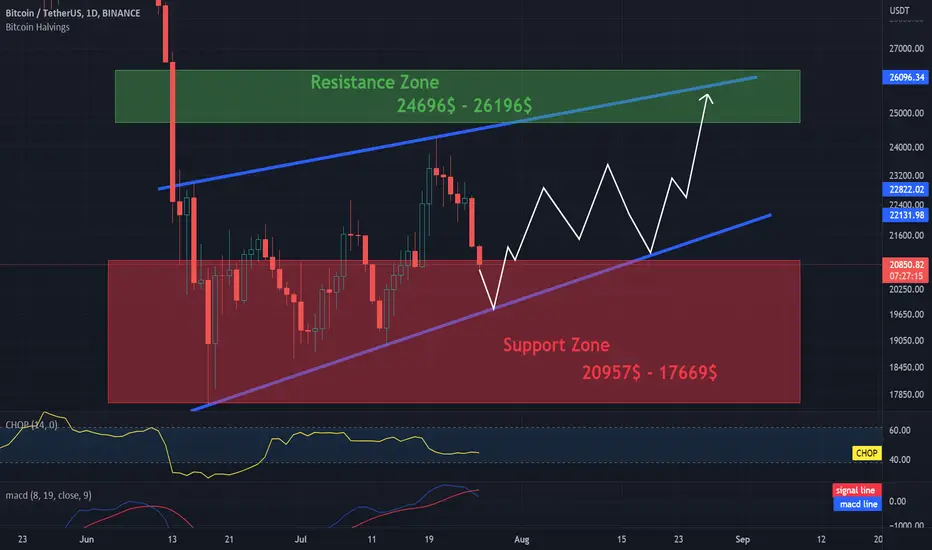
BTC is moving in the channel. Two important zones!Hi everyone.
Today we have marked the channel with blue lines in which the BTC price is currently moving.
Then, with the help of the white arrow, I tried to set the course route for the next few days on which the BTC price may move.
As you can see, we have two important zones:
-the first of them is the support zone which is from $ 20,957 to $ 17,669, if the price drops below the designated zone, we can expect further drops to around $ 12,000.
- the second is the resistance zone, which we have from $ 24,696 to $ 26,196 breaking out of this zone may result in further increases above $ 30,000
Currently, the price is moving nicely sideways on our channel, going down to the top of the channel, which can be potentially used for short-term licks.
It is also worth paying attention to the CHOP indicator, which indicates that energy is slowly running out, and the MACD indicator, which indicates that we have entered a local downward trend.
However, please remember that this is not an investment advice.
ANALYSIS OF EVERY BTC HALVINGHello everyone, I would like to present what repeatability can be determined by analyzing the BTC chart in more detail, taking into account the 3 halvings that we experienced and the 4 that are ahead.
We have a log BTC chart from 2011 to today in front of us.
We will start by designating the places where BTC performed its halving, as you can see, the first halving took place in November 2012, the second halving in June 2016, the third halving in May 2020, and we also mark the halving which should be in June 2024.
On the other hand, with white lines we will mark the middle between the halvings.
We will use the green field to mark the intervals between the edible and the second halving so that we can see this space and repeatability more clearly.
For the analysis, we will use the blue lines that represent the way btc moves, one line indicates the lowest price points and we see that btc touches the line many times, and in the same way we can mark the places where the price reached its ATH.
It is worth noting that with the first halving, btc fell by about 86% from his ATH
on the second halving he was down about 84% from his ATH
at 3 halving so far the decrease from ATH is about 74%.
The current low is at 74% where the blue line is, but BTC sometimes has a quick candlestick down which may be around 82% from ATH.
Given the repeatability between halvings, the current maximum hole should be around $ 10,500
Now we use the mean tool marked with the purple line and we can see that on each halving as the mean passes through the half of the halving period, the cane consolidates and then the price drops below our purple line.
Moving on, we can also see that after each drop below the average around the half of the halving, the price started to rebound and break the first trend marked with white line, as well as exit from the yellow area, then break the second trend and exit from the second yellow area.
So the breaking of the first trend is a period of pro-growth and the break of the second trend is a period of pro-growth followed by price increases.
Currently, we have not yet broken the first trend, taking into account the cyclical nature of btc and the fact that large capital is distributed similarly and all negative news is often already included in the price, we can assume that the situation will repeat itself. After breaking the second trend and breaking above the average, the price will start to increase again.
At the end, we present a visualization of how the btc price may possibly move in the coming time to the next halving, we mark the path on which the price can follow with the white line.
Please remember that these are not investment recommendations, everyone is responsible for their financial games, these are only our observations about the market and how the price moves.

BTC drops below the ATH from the previous bull marketHello everyone, let's take a look at the BTC to USDT chart on a 1 day time frame as you can see the price is moving under the downtrend line.
Let's start with the designation of the support line and as you can see the first support in the near future is $ 17,506, if the support breaks down, the next one is $ 11,781 and $ 8,177.
Now let's move from the resistance line as you can see the first resistance is $ 22,064, if you can break it the next resistance will be $ 23,972, $ 25,668 and $ 27,258.
Looking at the CHOP indicator, we can see that on the 1-day interval, each energy recovery gives another price drop, and the MACD indicator shows a downward trend.

The BTC price remains above the ATH from the previous bull markeHello everyone, let's take a look at the BTC to USDT 1 day chart as you can see the price is moving below the downtrend line.
Let's start with the designation of the support line and as you can see the first support is $ 19,928 equals ATH from the previous bullish, if the support breaks down, the next one is $ 17,423.
Now let's move from the resistance line as you can see the first resistance is $ 22,999, if you can break it the next resistance will be $ 24,763, $ 26,243, $ 27,722 and $ 29,827.
Looking at the CHOP indicator, we can see that we have very little energy in the 1-day interval, and the MACD indicator shows that we are still in a downward trend.

EURCHF Plan After Swiss Rate Hike Welcome back! Here's an analysis of this pair!
**EURCHF - Listen to video!
We recommend that you keep this pair on your watchlist and enter when the entry criteria of your strategy is met.
Please support this idea with a LIKE and COMMENT if you find it useful and Click "Follow" on our profile if you'd like these trade ideas delivered straight to your email in the future.
Thanks for your continued support!
Brian & Kenya Horton, BK Forex Academy

GMT is based on 1 stop lossHello everyone, let's take a look at the GMT to USDT chart over the 1 day timeframe. As you can see, the price is moving below the local downtrend line.
Let's start with determining the stop loss that we should take into account in the coming days. As you can see, we have a fixed 3 stoploss:
SL1 - $ 0.997 where the price is currently located.
SL2 - $ 0.907
and
SL3 - $ 0.798
Now let's move on to the targets that we can take into account, as you can see the targets are at the price:
T1 - $ 1,027,
T2 - $ 1,165,
and
T3 - $ 1,279
Looking at the CHOP indicator, we can see that in the 1-day interval we still have some energy for further moves, and the MACD indicator shows that we are following the local upward trend.

GBP - a detailed analysisA detailed GBP analysis:
Negative factors:
➡️Last week's PMIs were disastrous. GDP often follows the PMIs, which paints a very bleak picture for the future of the UK economy.
➡️Inflation is at a dizzying 9%.
➡️The consumer is suffering the consequences of inflation and sentiment is thus in the basement.
➡️Sometimes retail sales also follow consumer sentiment (strong correlation).
➡️If retail sales actually collapse to such an extent, this would further weaken the UK's growth and a recession would be a real risk
(Next retail sales release on 17.06.22)
➡️With the threat of a recession, the central bank of England (BoE) would row back sharply on the interest rate hikes already priced in as not to put further strain on the population and the economy
-> this would result in GBP weakness. (Next BOE meeting on 16.06.22)
➡️Brexit disputes with the EU could boil up again and put additional pressure on the GBP.
However, much of this is already more or less priced into the GBP and the reason why the GBP is one of the weakest G10 currencies since the beginning of the year.
Now to the positive sides:
As mentioned, the labour market in the UK is booming and the unemployment rate is at an all-time low.
-> As long as the labour market can remain stable, there is hope for the UK economy.
-> but at the same time this means that if we get much weaker labour data in the future this would weigh massively on the GBP (next labour data will be published on 14.06.22, even before the BOE meeting)
➡️On Thursday the UK Chancellor of the Exchequer announced a new £15 billion fiscal package where those on the lowest incomes are to receive a one-off payment of up to £600 from the government. This is a big boost and can add up to 0.7% to the UK's GDP
-> this is very positive for the GBP
As mentioned, much of the negative is already priced into the GBP, so many speculators (hedge funds, trend-following algos) are already heavily short GBP.
When so many speculators are already short, the danger of short squeezes is high.
-> Short squeezes can be particularly violent and result in a rapid rise in the GBP price.
Conclusion:
In the long term, the negative factors weighing on the GBP outweigh the positive factors for me, but in the short term much of this is already priced in and it would take a short squeeze to force the speculators out of the market. Only then would the GBP be an attractive short candidate for me for a long-term swing trade.
-> The factor that would make the GBP a long-term short candidate earlier would be a sharp weakening of the labour market.
ℹ️This analysis was from the point of view of a long-term swing trade.
Of course, shorter-term day trades in GBP (in either direction) are equally possible at any time.
Tip: Look out for the GBPUSD at 14:00 GMT time today. It will highly likely trade at 1.25500 and after that a bigger move could follow.

Will we see a triple top on BTC?Hello everyone, let's take a look at the BTC to USDT chart over the weekend 1 timeframe. As you can see, the price is moving in the uptrend channel.
Let's start with marking the support line and as you can see we are currently in the designated support zone from $ 31,251 to $ 26,665, if the support zone is broken, we are still around the previous ATH.
Now let's move from the resistance line as you can see the first resistance is $ 36,758, if you can break it the next resistance will be $ 43,001 and $ 47,937 and $ 53,018.
Looking at the CHOP indicator, we can see that during the weekend interval, some energy has been used, but we still have some further move, while the MACD indicator shows that we are on a decline and we are waiting for the blue line to go up, crossing the red line from the bottom.
