GBPJPY 4HOUR TIME FRAME BUY ANALYSISOn the 4-hour chart, GBP/JPY is showing clear signs of a renewed bullish trend:
Higher-highs & higher-lows
Since mid-July, price has been carving out a staircase of successive peaks and troughs. The latest swing low around 197.30 held firm, and the subsequent rally cleared the June–July consolidation high near 198.40.
Breakout and retest
Price broke above a shallow descending trendline at ~197.65 late yesterday, then pulled back to retest that line as new support. Your entry at 197.902 sits just above that retest, giving a tight buffer to the stop.
Stop-loss placement
The SL at 197.275 undercuts the recent 4H swing low (197.30), so if that level fails it argues the bullish thesis is invalidated.
Future

BTCUSD 4HOUR TIME FRAME ANALYSISOverall Structure & Trend
Over the past several 4-hour candles, BTCUSD has carved out a series of higher lows around 116,500–117,000 and higher highs around 120,000–120,500, defining a gentle up-sloping channel.
The current price (118,758) sits just above the middle of that channel, suggesting there’s still room toward the upper trendline before meeting heavy supply.
Key Support & Entry Zone
Primary support lies at 117,200–117,500 (the former swing high from three bars ago), which also aligns with the 50% retracement of the move up from 114,500 to 120,500. That zone offers confluence for the 118,758 entry.
A secondary buffer sits at 116,849 (your stop-loss), just below the channel’s lower boundary—if price breaches here, the bullish structure would be invalidated.

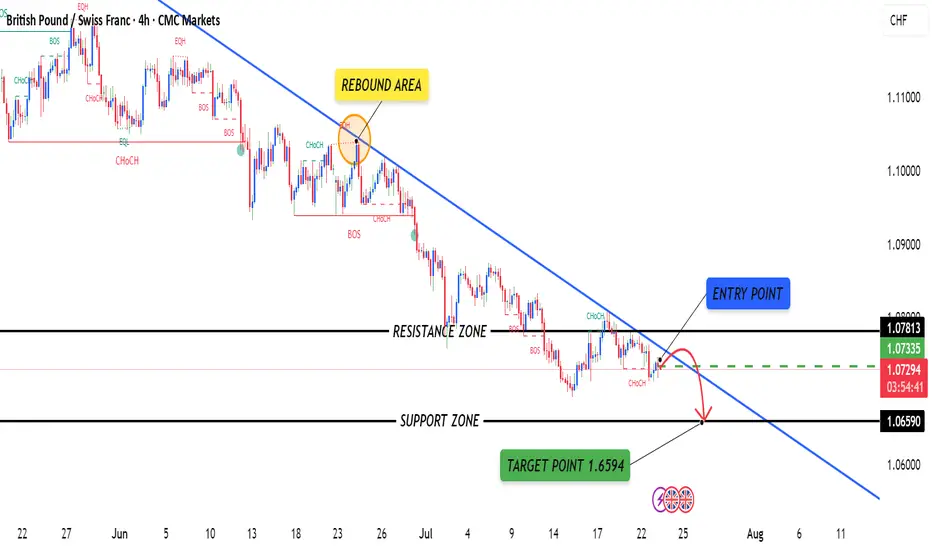
GBPCHFGBPCHF is currently in a downtrend, confirmed by a series of lower highs and lower lows.
The pair has recently formed a bearish engulfing candle below the minor resistance zone near 1.07400, signaling renewed bearish pressure.
Price rejection from the 50 EMA suggests sellers are still in control.
RSI is trending downward, staying below 50, indicating bearish momentum without being oversold.
GBPJPY 4HOUR TIME FRAME ANALYISOn the 4-hour chart, GBP/JPY has been tracing out a clear up-trend over the past several weeks, marked by a sequence of higher highs and higher lows. Your proposed long entry at 198.632 neatly coincides with two layers of support:
Trendline support: A rising trendline drawn off the last two significant swing lows intercepts right around 198.6, suggesting the pair is catching a bid as it back-tests that line.

Ethereum - ETH - Heading towards the CME Gap - 3200 Target+ After a significant crash, Ethereum has shown a strong recovery.
+ A large CME gap exists between $2,880 and $3,270.
+ Historically, 90% of CME gaps tend to get filled sooner or later.
+ Current price action suggests Ethereum is heading directly toward this gap.
+ High probability that the CME gap will be filled during this move.
+ Next target for ETH: $3,200.
Stay tuned for more updates.
Cheers,
GreenCrypto

GOLD fluctuates, but remains generally stable sidewaysOANDA:XAUUSD has been volatile and volatile but has remained broadly stable as investors assess the conflict between Israel and Iran while keeping an eye on this week's Federal Reserve policy meeting.
Spot gold was steady at $3.38/oz at press time, down from a high of $3,403/oz yesterday (Tuesday).
Israel and Iran traded fire for a fifth day on Tuesday as US President Donald Trump called for the evacuation of the Iranian capital Tehran and cut short his trip to the G7 summit in Canada, amid reports he had asked his administration's National Security Council to prepare in the Situation Room.
According to Reuters, Tehran has asked Oman, Qatar and Saudi Arabia to urge Trump to push Israel for a regional ceasefire in exchange for Iran's willingness to be flexible in nuclear talks.
Trump's latest Truth Social post stated: "I have not communicated with Iran in any way, shape or form about (peace talks). This is all fake news! If they want to negotiate, they know how to communicate with me. They should make a deal at the negotiating table, it will save lives!!!"
Forexlive commented that those who know Trump know that he will definitely wait for Iran to come to him. According to reports, Iran is trying to negotiate a ceasefire, but has not received any substantive news so far.
Non-yielding gold is seen as a hedge against geopolitical and economic uncertainty and has generally performed well in low interest rate environments. So, fundamentally speaking, gold should be positive in the current market environment, although the sharp declines often make new traders lose their confidence in the trend. I myself have been the same way, there have been many times this year when I did not believe in myself, did not believe in the uptrend and ended up with bad results…
The Fed's interest rate decision and Chairman Jerome Powell's speech will be released today (Wednesday). Traders are now expecting the Fed to cut interest rates twice by the end of the year.
According to CME's "Federal Reserve Watch" on June 18:
• The probability of the Federal Reserve keeping interest rates unchanged in June is 97.3% and the probability of a 25 basis point rate cut is 2.7%;
• The probability of a rate stay unchanged in July is 85.3%, the probability of a cumulative 25 basis point rate cut is 14.4% and the probability of a cumulative 50 basis point rate cut is 0.3%.
Technical Outlook Analysis OANDA:XAUUSD
On the daily chart, gold has been trading back and forth between the 0.236% Fibonacci retracement level and the 3,400USD whole price point, which was noted as the nearest support and resistance sent to readers in the previous issue.
However, the overall technical structure remains unchanged with the uptrend still dominating the chart, with the EMA21 support as the important support and the trend as the main trend. Meanwhile, the 0.236% Fibonacci retracement level is the nearest support and the price channel is the short-term trend.
In terms of momentum, the Relative Strength Index (RSI) remains above 50 and 50 is considered support in this case for the RSI, with the distance far from the overbought zone suggesting that there is still room for upside ahead.
During the day, if gold breaks above the raw price point of $3,400, it will give a positive signal for the bullish outlook and the target is then around $3,435 in the short term.
Finally, the notable positions will be listed as follows.
Support: $3,371 – $3,350
Resistance: $3,400 – $3,435
SELL XAUUSD PRICE 3423 - 3421⚡️
↠↠ Stop Loss 3427
→Take Profit 1 3415
↨
→Take Profit 2 3409
BUY XAUUSD PRICE 3351 - 3353⚡️
↠↠ Stop Loss 3347
→Take Profit 1 3359
↨
→Take Profit 2 3365

GOLD hits $3,435 target, Middle East tensions rise againOANDA:XAUUSD rose to a one-week high as weak U.S. inflation data reinforced market expectations that the Federal Reserve will cut interest rates this year, while conflict in the Middle East boosted safe-haven demand.
OANDA:XAUUSD recently hit a fresh one-week high, extending its rally. Spot gold had risen to $3,435 as of press time, after hitting its highest level since June 5.
Israeli Prime Minister Benjamin Netanyahu said the operation “will continue until this threat is eliminated.” Iranian state TV reported that the commander of the Islamic Revolutionary Guard Corps, Hussein Salami, had been killed. Iran vowed a “harsh counterattack” against Israel and the United States, while other countries said they were not involved in the operation. Gold is trading near an all-time high of $3,500.10, just shy of $60.
Netanyahu said the operation “will last for days to eliminate this threat.” Israel believes the strike killed at least several Iranian nuclear scientists and senior generals, according to a military official. Iranian state TV said Islamic Revolutionary Guard Corps commander Hussein Salami may have been among the dead.
Israel's attack on Iran comes after Netanyahu repeatedly warned of attacking the OPEC oil producer to cripple its nuclear program. US and Iranian negotiators are scheduled to hold a new round of talks on Tehran's nuclear program in Oman on Sunday, but Trump said this week he was less confident a deal could be reached.
OANDA:XAUUSD extended its recent two-day gains as weak U.S. inflation and jobs data fueled expectations that the Federal Reserve will cut interest rates later this year. A report on Thursday showed U.S. producer price inflation remained subdued in May, while another showed jobless claims continued to rise, hitting their highest level since late 2021.
OANDA:XAUUSD has gained 30% this year as investors increasingly turn to gold as a safe-haven asset amid President Trump’s aggressive trade policies and geopolitical tensions, including in Ukraine. Strong demand from central banks and sovereigns has also supported gold prices.
Technical Outlook Analysis OANDA:XAUUSD
Gold continues to reach the target of $3,435 after reaching the previous upside target at the base of $3,400.
Currently, the base of $3,400 becomes the nearest support, while other than the resistance of $3,435, there is no resistance ahead to prevent gold from heading towards the all-time high of $3,500.
In terms of momentum, the Relative Strength Index (RSI) is sloping upward, still far from the overbought zone, indicating that there is still plenty of room for further upside ahead.
There are no factors that could cause gold to decline during the day, and the notable positions will also be listed as follows.
Support: 3,400 – 3,371 USD
Resistance: 3,435 – 3,500 USD
SELL XAUUSD PRICE 3480 - 3478⚡️
↠↠ Stop Loss 3384
→Take Profit 1 3472
↨
→Take Profit 2 3466
BUY XAUUSD PRICE 3373 - 3375⚡️
↠↠ Stop Loss 3369
→Take Profit 1 3381
↨
→Take Profit 2 3387

GOLD surges to hit $3,371 target, continues to aim for $3,400OANDA:XAUUSD rose nearly 3% as US President Trump's tariff threats ratcheted up trade tensions, spurring investor demand for safe-haven assets and sending the dollar sharply lower.
US President Trump said on Friday he would raise tariffs on steel and aluminium imports from the US to 50% from the current 25% starting June 4. This has once again disrupted international trade, Reuters reported.
A European Commission spokesperson expressed deep regret over the US announcement that it would raise tariffs and said the EU was ready to take countermeasures.
Gold prices surged on Monday to a more than four-week high and continued to rise early this morning (Tuesday, June 3) as geopolitical risks from the conflict between Russia and Ukraine escalated as US President Donald Trump continued to threaten tariffs. Trump doubled tariffs on steel and aluminum imports to 50%, effective June 4, adding to jitters in global markets.
Ukraine launched its biggest drone attack since the war against Ukraine on Sunday, targeting a wide swath of Russian air bases on the eve of a second round of direct talks between the two countries. The drones, hidden in trucks, penetrated deep into Russia and hit strategic airfields as far away as eastern Siberia. At the same time, Moscow launched one of its longest drone and missile strikes on Kiev.
In key US data on Monday, the ISM Manufacturing Purchasing Managers’ Index (PMI) for May showed a contraction in business activity. The ISM Manufacturing Purchasing Managers’ Index for May came in at 48.5, down from 48.7 in April, the lowest reading since November.
Investors will also be closely watching comments from Federal Reserve policymakers this week for clues on the path of U.S. interest rates. Gold tends to benefit in low-interest-rate environments and times of geopolitical tension.
Technical Outlook Analysis OANDA:XAUUSD
After reaching the target increase at 3,371 USD, gold temporarily decreased slightly but overall it has enough conditions to continue to increase in price towards the next target at 3,400 USD in the coming time.
In the short term, gold also formed an upward price channel, which is noted by the price channel, describing the short-term technical trend. Meanwhile, in terms of momentum, RSI is operating above 50, still quite far from the overbought area, showing that there is still a lot of room for growth ahead.
For the day, the main outlook for gold is bullish, any pullbacks that fail to break below the confluence of the EMA21 with the 0.382% Fibonacci retracement should be considered only as a short-term correction, or a fresh buying opportunity.
Finally, the short-term bullish trend for gold will be focused again on the following positions.
Support: 3,326 – 3,300 – 3,292 USD
Resistance: 3,371 – 3,400 – 3,435 USD
SELL XAUUSD PRICE 3412 - 3410⚡️
↠↠ Stop Loss 3416
→Take Profit 1 3404
↨
→Take Profit 2 3398
BUY XAUUSD PRICE 3324 - 3326⚡️
↠↠ Stop Loss 3320
→Take Profit 1 3332
↨
→Take Profit 2 3338
GOLD MARKET ANALYSIS AND COMMENTARY - [Jun 02 - Jun 06]During the week, OANDA:XAUUSD fluctuated in the range of 3,245 - 3,331 USD/oz and closed the week at 3,289 USD/oz. The reason for the sideways gold price was due to the lack of strong information. The US Court of International Trade's ruling on blocking the Trump administration's tariff policy was postponed, while the US PCE index in April increased by only 2.5%, down from the previous month, not enough to influence the FED's policy in the context of prolonged trade instability.
If the Court continues to block the tariffs, President Trump can still use several laws to maintain the tariffs:
🔹Section 122 - Trade Act of 1974: Allows for a 15% across-the-board tariff for 150 days; then requires congressional approval to extend.
🔹Section 338 - Trade Act of 1930: Allows for tariffs of up to 50% on goods from countries deemed to discriminate against the United States.
🔹Section 232 - Trade Expansion Act of 1962: Allows for the expansion of tariffs from items such as aluminum, steel, and automobiles to other industries on national security grounds.
US Treasury Secretary Scott Bessent said that US-China trade negotiations are still at a standstill due to many complicated issues, requiring direct intervention from the leaders of the two countries. Although the tariff war is still complicated, the most tense phase has passed. Therefore, in the short term, gold prices are unlikely to exceed the $3,500/oz mark and will likely continue to adjust and accumulate in the $3,100-$3,400/oz range.
Although gold prices are currently stuck in a range, the US economic data released next week, especially the May non-farm payrolls (NFP) report on Friday, could cause a sharp move. The NFP is forecast to come in at 130,000 jobs, down from 177,000 in April. If true, this could reinforce expectations that the Fed will cut interest rates to support the labor market, thereby supporting gold prices. Conversely, if the NFP is stronger than expected, especially higher than last month, the Fed could keep interest rates unchanged, putting downward pressure on gold prices.
📌Technically, on the H4 chart, gold prices are almost moving sideways in a narrowing range, the resistance level is established around 3325 while the support level is around 3245. Next week, gold prices are likely to increase slightly if economic and geopolitical factors continue to support, corresponding to the H1 technical chart, gold prices will increase to 3365-3415 if the price breaks through the Downtrend line and breaks the resistance zone of 3325. In case the gold price falls below the support zone of 3245, the gold price will reverse and decrease.
Notable technical levels are listed below.
Support: 3,250 – 3,228USD
Resistance: 3,300 – 3,371USD
SELL XAUUSD PRICE 3327 - 3325⚡️
↠↠ Stop Loss 3431
BUY XAUUSD PRICE 3203 - 3205⚡️
↠↠ Stop Loss 3199

ALERT: ALT SEASON INCOMING? 🚨 ALERT: ALT SEASON INCOMING? 🚨
Take a close look at the BTC/ETH chart — we’re seeing early signs of a major rotation out of Bitcoin and into Ethereum and altcoins. Historically, when the BTC/ETH ratio starts to fall, it's a clear signal that capital is flowing into altcoins, marking the beginning of alt season.
🔍 The ratio is showing bearish divergence and approaching a key support zone. If this level breaks, ETH is likely to outperform BTC significantly — and we all know what follows: altcoins explode.
📉 BTC dominance is stalling, ETH gaining strength, and altcoins are waking up. The market is shifting. Don't get caught late.
🚀 Get ready. The alt season might just be starting now.
#AltSeason #Crypto #BTC #ETH #TradingView #CryptoTrends

Bitcoin - CME Gap fill before going up ?Bitcoin CME Futures have formed a clear CME Gap in the $91,600 – $93,400 zone (highlighted in blue). Historically, these gaps tend to get filled before the price resumes its trend.
Price may dip into the gap zone (91,800–93,400) to fill the imbalance.
We have a entry around the lower part of the gap ($91,800–$92,200).
Stop loss: Below $91,500 to invalidate the setup.
After the gap fill, we can expected strong bullish continuation
Entry: 91600
TP1: 92800
TP2: 93500
TP3: 94500
SL Below 90500
Like and support for more ideas.
Cheers
GreenCrypto

Markets revolve around US-China, GOLD seeks new peaksAs Powell's warnings about the impact of the trade war increased market volatility, US stocks and the US dollar fell sharply and gold prices hit new highs.
Powell warned that the central bank may have less flexibility to quickly mitigate the economic impact of President Donald Trump's trade war, comments that sent stocks lower on Wednesday. Powell reiterated that the Fed is in no rush to cut interest rates and that it would be "better to wait until the situation becomes clearer before considering any adjustments to the policy stance." He also acknowledged that the Fed could face a difficult situation where its two policy goals of price stability and maximum employment conflict, as Trump's tariffs could push up U.S. inflation and slow economic growth.
OANDA:XAUUSD have risen nearly $700/ounce, or nearly 28%, this year, driven by tariff disputes, expectations of interest rate cuts and strong central bank buying, outpacing the 27% gain in 2024.
Gold prices have continued to rise as the escalating trade war raises concerns of a global recession. At the same time, the Trump administration is preparing to pressure other countries to limit trade with China in response to US tariffs in US-China trade talks.
U.S. President Donald Trump on Tuesday ordered an investigation into possible tariffs on all critical minerals imported into the United States, marking a new escalation in his dispute with global trading partners and an effort to pressure China. The latest escalation in tensions between the world’s two largest economies has hurt sentiment in financial markets overall, sending investors fleeing to safe-haven assets like gold.
However, a profit-taking or positive developments in US-China trade relations could trigger a sell-off. Therefore, readers/traders need to closely monitor developments surrounding the trade war to make timely changes in their trading plans to suit the market context.
Technical Outlook Analysis OANDA:XAUUSD
On the daily chart, gold continues to find and renew all-time highs with an absolutely supported uptrend in both the short, medium and long term. In the long term, the price channel will be set as the main trend with the main support from EMA21, while in the short term, gold is still in an uptrend with support from the 0.382% Fibonacci extension levels and the raw price point of 3,300USD right after.
In terms of momentum, the Relative Strength Index (RSI) is entering the overbought zone, a downward RSI below 80 would be considered a signal for a possible correction. Going forward, the trend and outlook for gold prices remain bullish, and declines should only be considered short-term corrections.
But this note will be important, in a market where assets (Gold) are overbought, making them a bubble, any correction will cause serious selling sentiment. As in the current context, we cannot know when the US-China war will cool down, and any positive move around this war will cause selling sentiment in the gold market, which is considered a traditional safe haven asset.
During the day, the bullish outlook for gold prices will be listed again by the following positions.
Support: 3,303 – 3,300 USD
Resistance: 3,337 – 3,371 USD
SELL XAUUSD PRICE 3396 - 3394⚡️
↠↠ Stop Loss 3400
→Take Profit 1 3388
↨
→Take Profit 2 3382
BUY XAUUSD PRICE 3309 - 3311⚡️
↠↠ Stop Loss 3305
→Take Profit 1 3317
↨
→Take Profit 2 3323

11 April Nifty50 trading zone #Nifty50
99% working trading plan
👉Gap up open 22660 above & 15m hold after positive trade target 22818, 23118
👉Gap up open 22660 below 15 m not break upside after nigetive trade target 22492
👉Gap down open 22492 above 15m hold after positive trade target 22658, 22810 , 23118
👉Gap down open 22492 below 15 m not break upside after nigetive trade target 22372
💫big gapdown open 22372 above hold 1st positive trade view
💫big Gapup opening 22818 below nigetive trade view
📌For education purpose I'm not responsible your trade
More education following me

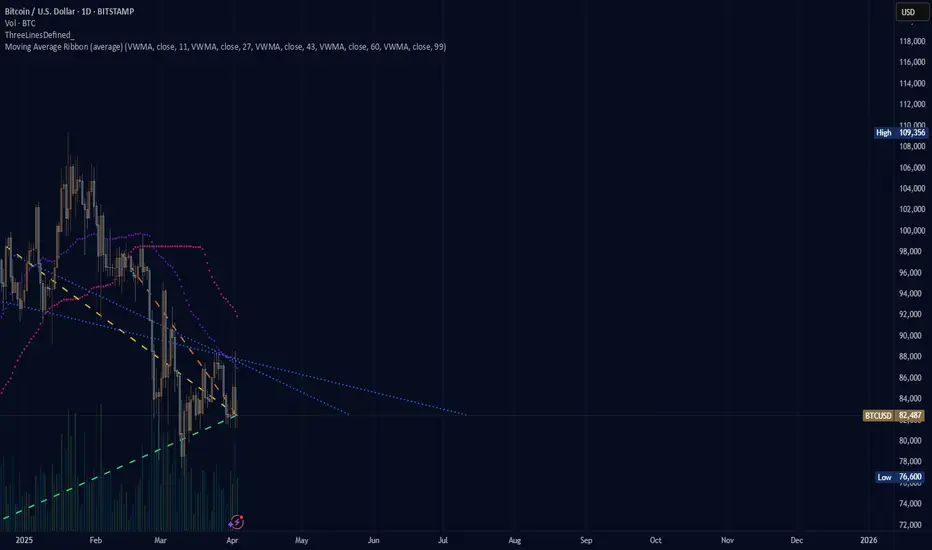
(BTC) bitcoin "the case for bitcoin"Where is bitcoin going to be during this 2025 year. The image shows a blank canvas. The drawing untold, unknown for now? Where will the price move and how long will it take to move through the pattern, bearish? bullish? neutral? fire? ice? greener pastures? The graph showing what is being seen tends to see a rise in price once the price moves past the crossing of the blue lines but the purple and pink dotted lines are facing down with no indication that the price is moving neutrally in a recovery effort.
Bearish Structure & Gap Fill Target📊 Crude Oil Market Analysis – Bearish Structure & Gap Fill Target 🚨
📉 Crude oil is showing a bearish candle structure, indicating potential downside.
🔄 Bearish Outlook:
✅ Key Target: Price could drop to $67.31 to fill the gap.
✅ Bearish Confirmation: As long as price remains below the bearish candle formations, the trend stays bearish.
✅ Reversal Trigger: A breakout above the bearish candle structure would invalidate the bearish setup.
📌 Until a breakout occurs, the trend remains bearish! Watch price action closely.

Future Nearing.Been peeped Silver since 2023, watch as price rally above $42 soon. Especially with Gold topping out above $3K. The future, full of robotics and humanoids, is nearing. Who’s ready? Who’s scared? Who’s taking advantage of this opportunity?
Whatever happens, do not fomo, stay calculated.

(JASMY) JASMY "that sux"Jasmy losing like there is no tomorrow. The Elliott Wave prospects of Jasmy seem to have fallen through. The December price was what I wanted to believe was a peak of Elliott Wave patterns with two more to follow only slightly lower but this prolonged down angle on the chart is a bummer.

ETH has two pending CME Gaps#ETH #Analysis
Description
---------------------------------------------------------------
+ ETH has two pending CME future gaps to filled.
+ First gap is around 2900-3400 range and second gap is around 2500-2600 range.
+ Sooner or later these CME gaps will get filled. I'm expecting Gap2 get filled in this or next month and Gap 1 in the second or third quarter.
---------------------------------------------------------------
Enhance, Trade, Grow
---------------------------------------------------------------
Feel free to share your thoughts and insights. Don't forget to like and follow us for more trading ideas and discussions.
Best Regards,
VectorAlgo

bluzelle (BLZ)bluzelle not doing so hot as of right now. In the past bluzelle was focused on gaming. Now the company is focused on DeSci, decentralized science and in particular a focus on aging or rather de-aging. There used to be a picture of Tesla on their page, now there are pictures of other people, less recognizable people to the naked eye, or unfamiliar to those within the inner circle of important people in history. Bluzelle is now involved in crowdfunding, and as we all know, funding is a tough business that usually fails to persist along with other more equitable projects. Academics and making money do not usually mix. Academics spends more money than they make.

HBAR/USDT: A Potential Super Long-Term Impulse Wave Take a look at this super long-term potential impulse wave for HBAR. This chart captures a massive Elliott Wave structure that could define the next big move in the crypto market.
We’re seeing the foundation of Wave 3, with the potential for a trend-defining breakout as HBAR progresses through its impulsive phases. The critical zone? A breach of the upper trend line would validate this structure and could signal higher highs on the horizon.
This isn’t just a week-to-week setup—it’s a multi-year roadmap. If the Hurst cycles align, we’re looking at one of the most promising long-term plays.
What’s your take? Do we see confirmation, or does this remain a dream scenario? Share your thoughts and follow for more long-term crypto insights! 🚀

Natural Gas Futures (4H) - ABCD Pattern Analysis and PRZ Levels"In this analysis of Natural Gas Futures (4H timeframe), we identify a bullish ABCD pattern that projects a Potential Reversal Zone (PRZ) around 394.5-395. Key highlights include:
ABCD Pattern: The 1.618 Fibonacci extension from the BC leg aligns with the PRZ.
Current Price Action: Natural Gas is trading around 368.6, indicating a strong upward momentum.
Key Levels:
Resistance at 394.5 (PRZ zone).
Support levels marked at 365.2, 364.3, and 361.5.
Strategy Insight:
Traders may look for potential shorting opportunities at the PRZ (394.5) with confirmations.
Alternatively, breakouts above 394.5 could indicate further bullish movement toward 400+ levels.
This setup is ideal for monitoring reversal or continuation scenarios. Keep an eye on volume and momentum indicators for better confirmation."

XRP: Poised at the Edge of Momentum – What's Next?The cryptocurrency market never sleeps, and XRP is the perfect reflection of this restless spirit. Currently trading at $2.8295, XRP finds itself teetering on the brink of a crucial breakout, with just a 2.9% gap from its all-time high of $2.9138, achieved 43 days ago. The question on every trader's mind: is this the moment of ignition, or will the asset take a breather?
Recent patterns highlight a tug-of-war between buyers and sellers. Volume Spread Analysis (VSA) patterns reveal the persistence of increased buy volumes, though intermittent sell-offs indicate a battle for control. From a technical perspective, the Relative Strength Index (RSI) stands at 74.95, signaling that XRP is flirting with overbought territory. Yet, this could either confirm a surge or warn of an impending pullback.
Fundamentally, Ripple’s ongoing legal clarity and the adoption of RLUSD stablecoin are boosting market confidence. Combined with the upward trend supported by key moving averages—MA50 at $2.5597 and MA100 at $2.5201—XRP could be primed for its next big leap.
Your Move: XRP's future is a coin flip between testing its psychological barriers at $3.00 and retracing to stronger support at $2.66. Are you ready to seize the opportunity as XRP prepares to define its next chapter? Stay tuned, as the market reveals its hand.
XRP Tradingmap: Patterns in Motion
Step 1: The Build-Up Begins - Buy Volumes Max (01:00 UTC)
The sequence kicks off with the "Buy Volumes Max" pattern. At this point, the price opened at $2.6765 and closed higher at $2.7918, signaling strong buying momentum. The main_direction was bullish, validated by the immediate follow-up pattern. This set the stage for the next price action.
Step 2: Rally Confirmed - Increased Buy Volumes (02:00 UTC)
True to the bullish call of the previous pattern, the price climbed further, opening at $2.7918 and closing higher at $2.8474. This confirms the integrity of the earlier pattern and keeps the bullish sentiment alive. Trigger points were respected as prices didn’t dip below the lows of the previous three bars ($2.6383). Confidence grows as buyers continue to dominate.
Step 3: Profit-Taking Warning - VSA Manipulation Sell Pattern (03:00 UTC)
Here comes a shift. The market signals caution with a "VSA Manipulation Sell Pattern." Despite opening high at $2.8474, the price closed lower at $2.8304. The main_direction flipped bearish, and this was confirmed as the subsequent pattern saw a slight price drop. Traders who spotted this sell signal had a chance to lock in gains before the retracement deepened.
Step 4: Brief Reprieve - Increased Buy Volumes (17:00 UTC)
Bulls briefly regained control, as prices opened at $2.6146 and closed higher at $2.6553. However, the movement lacked the strength seen in earlier buy patterns. While the main_direction of this pattern was bullish, subsequent price action indicates that this bounce was fleeting—a classic bull trap for unprepared traders.
Step 5: The Market Takes a Turn - VSA Manipulation Sell Pattern (19:00 UTC)
The sell-off resumes with another VSA sell pattern. The price slid lower, respecting the bearish direction outlined earlier. Opening at $2.682 and closing at $2.6626, this pattern further solidified bearish control. Trigger points were cleanly activated as prices failed to regain previous highs, providing traders with an opportunity to ride the downtrend.
Step 6: Strategy Reset - The Bigger Picture Emerges
The sequence highlighted above demonstrates the power of reading patterns within a cohesive framework. Early buy signals paved the way for strong upward momentum, but the subsequent sell patterns hinted at deeper corrections. By following the roadmap, investors could have avoided traps and maximized profits during the transition from bullish to bearish phases.
What’s Next?
XRP’s roadmap reveals its inherent volatility. Each pattern offers insight into market behavior, but success comes from aligning these signals with a broader strategy. Stay tuned for the next move—will bulls or bears take the crown?
Technical & Price Action Analysis: Key Levels to Watch
Support Levels:
$2.6666 – First line of defense. If this level doesn’t hold, it’s likely to flip into resistance, attracting sellers like bees to honey.
$2.5783 – A deeper support level where buyers might regroup. If broken, expect it to act as a ceiling for any bounces.
$2.2748 – Critical zone for bulls to keep control. If this level is lost, momentum shifts decisively in favor of the bears.
$2.1349 – The market’s last-ditch effort to keep things afloat. Failure here could open the floodgates.
$1.9667 – A psychological barrier where value hunters might step in. But remember, if it cracks, it’s a wall on the way up.
Resistance Levels:
While the chart doesn’t scream significant resistance levels, any failed support will naturally transform into tough barriers for a comeback rally.
Powerful Resistance Levels:
$1.1047 – A long-term level where sellers are likely to dig in their heels. Watch for strong rejections here.
$0.5538 – Key zone for the long game. If this level is reached and rejected, the bears could strengthen their grip.
$0.5032 – An area that will attract big players if prices retrace this far. Keep an eye on the price action here.
$0.3646 – The fortress of resistance. If bulls manage to breach this, it’s a signal of a major shift in market sentiment.
Trading Strategies Using Rays: A Path Through the Fibonacci Framework
Concept of Rays
The "Rays from the Beginning of Movement" approach is a unique method that applies Fibonacci-based geometric principles to map the dynamics of price movement. These rays act as predictive tools, marking zones where significant price interactions occur—either signaling a continuation or a reversal. By focusing on interactions with these rays, traders can better gauge probabilities without attempting to pinpoint exact levels in a nonlinear financial system.
How Rays Work
Fibonacci Rays: Constructed at mathematically significant angles starting from the initial movement, not extremum points. This increases accuracy in trending or corrective phases.
Dynamic Levels: These rays adapt to new patterns, automatically updating ranges for potential price movements.
Moving Averages as Dynamic Factors: Key levels align with Moving Averages (MA50, MA100, MA200), providing strong zones of interaction.
Ascending and Descending Rays: These define movement boundaries, marking pathways for price to travel from one ray to another.
Optimistic Scenario
Entry Point: Interaction with a descending ray around $2.6666 (support). If the price bounces above this ray and confirms with a close above MA50 at $2.5597, the movement could head upward.
Target 1: $2.8295 – Interaction with the next ray above creates an opportunity to scale out partial profits.
Target 2: $2.9138 – Absolute high from recent history; a breakout here could extend gains toward higher Fibonacci levels.
Dynamic Factors: If RSI remains above 70 while interacting with ascending rays, the bullish scenario strengthens.
Pessimistic Scenario
Entry Point: Price interaction with an ascending ray near $2.6666, but fails to close above MA50, confirming bearish sentiment.
Target 1: $2.5783 – Initial support zone becomes the first profit target in the downtrend.
Target 2: $2.2748 – Second ray below and the next potential reaction level for a partial exit.
Target 3: $2.1349 – A critical area where price may consolidate or reverse.
Dynamic Factors: Watch for Moving Averages flipping into resistance zones, confirming further downward pressure.
Trade Ideas Using Rays
Long Trade from $2.6666 to $2.8295: Enter long when price interacts with the ray at $2.6666, confirming with a bullish close above MA50. Scale out at $2.8295, targeting the upper ray.
Short Trade from $2.6666 to $2.5783: Enter short if price interacts with $2.6666 but fails to break above MA50. Target $2.5783 for a clean exit at the next ray.
Breakout Trade above $2.9138: Go long if price cleanly breaks $2.9138, with a tight stop below the breakout candle. Use dynamic Fibonacci rays to set extended targets.
Reversal Trade at $2.1349: A bounce off the $2.1349 ray could signal a countertrend move. Enter with confirmation from price closing above MA200, targeting $2.2748.
Trading is all about finding those key levels where the magic happens, and now it's your chance to engage. Have questions about the analysis? Drop them right in the comments—I’m here to discuss, clarify, and brainstorm with you!
Found this idea helpful? Don’t forget to hit Boost and save it for later so you can track how price moves along the rays. Observing these levels in real-time will not only sharpen your skills but also deepen your understanding of how market dynamics work.
Curious about my indicator? The strategy you see here, drawing all the rays and levels automatically, is part of a private setup. If you’re interested in using it, feel free to reach out to me via direct message—I’ll explain how we can make that happen.
Need a custom analysis for your favorite asset? Whether you want it shared publicly or kept private for your eyes only, I’m open to discussing options. Just let me know in the comments or via DM, and I’ll do my best to help.
Remember, these rays work across all assets, and the price often respects them like clockwork. If you want me to mark up specific assets for you, write in the comments and don’t forget to hit Boost. I’ll tackle requests as time permits.
Finally, make sure to follow me here on TradingView for more in-depth ideas and strategies. This is where I share all my updates, and I’d love to have you as part of my trading community.
Let’s trade smarter together! 🚀

PEPE, long term super cycle awaits!This is how PEPE could play out in the long-term assuming that we're putting in wave 1, which looks like a leading diaganol. In the medium term we're likely to see some lows as the minor wave 1 corrects for the clearly visible ABC. But, then hold on to your hats as we put in wave 3 which is always the most violent. If you're not out of your shorts by then, this pattern could ripe your face clean off. In any case, keep an eye and plan for early retirement. Follow for more.
