NASDAQ at Make-or-Break Resistance – Is a Sharp Drop to 23,292 "📉 NASDAQ at Make-or-Break Resistance – Is a Sharp Drop to 23,292 Next?"
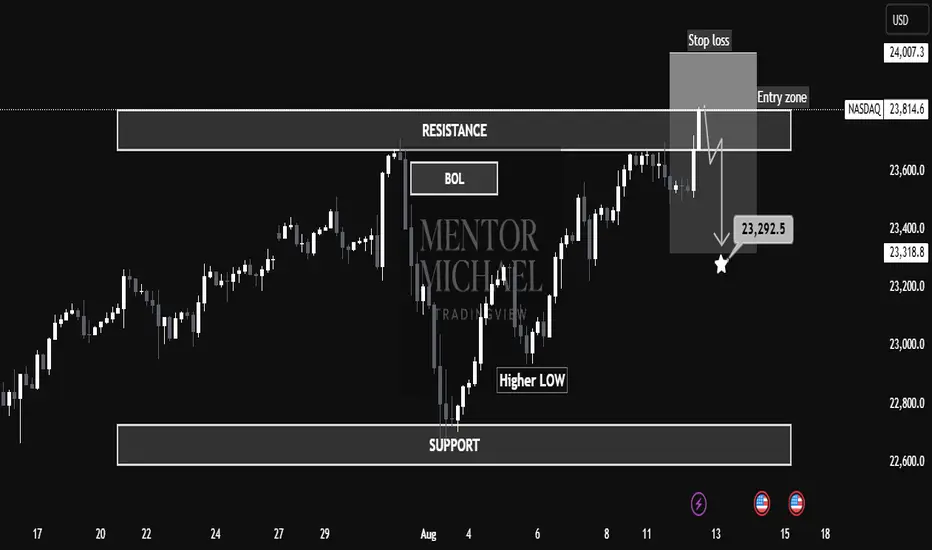
📊 NASDAQ is currently trading within a well-defined resistance zone (23,812 – 24,007) after a recent rally from the support base near 22,800. The structure suggests a potential sell-side setup if price respects the resistance and fails to break higher.
🧐 Market Structure Analysis
Support Zone: Around 22,800, where buyers previously stepped in, forming a Higher Low and initiating the last bullish leg.
Resistance Zone: 23,812 – 24,007, marked by previous rejections and a Break of Liquidity (BOL).
Price has tapped into the entry zone just below resistance, hinting at possible exhaustion from buyers.
The chart indicates a bearish bias from this zone, aiming for a move toward 23,292.5 (marked target).
🎯 Educational Trade Example
Entry Zone: 23,812 – 24,007
Stop Loss: Above 24,007 to protect against breakout rallies.
Target: 23,292.5 (aligned with previous structural support).
Rationale:
Trading against strong resistance offers asymmetric R:R if momentum shifts bearish.
The Higher Low before resistance can act as liquidity fuel for sellers once demand weakens.
Clear invalidation point keeps risk defined.
⚠ Invalidation Scenarios
A strong breakout and close above 24,007 with follow-through volume would invalidate the short idea and potentially signal continuation toward 24,200+.
💡 Key Takeaways for Students
Zone-to-Zone Trading: Always define both entry and exit zones before execution.
Structure Before Strategy: The market’s reaction to resistance is the clue — confirmation comes before position sizing.
Risk Management is Non-Negotiable: Even high-probability setups require strict stop placement.
Futures
GOLD rebounds slightly, data supports rate cut expectations, PPIOANDA:XAUUSD rebounded slightly, currently trading around $3,351/oz, positive US inflation data for July reinforced market expectations for a rate cut by the Federal Reserve in September, while a weaker US dollar boosted the appeal of gold.
Mild inflation supports rate cut expectations
Data from the US Bureau of Labor Statistics showed that the Consumer Price Index (CPI) rose 2.7% year-on-year in July, below expectations of 2.8% and unchanged from June.
Core CPI rose 3.1% year-on-year and 0.3% month-on-month, the largest increase in six months.
While core inflation remains above the Federal Reserve’s target, the overall data was interpreted by the market as positive for a rate cut.
The US Dollar Index fell to 98.02, making non-dollar-denominated gold more attractive.
Market data showed traders are betting that the chances of a Fed rate cut in September and December remain high.
Next up, the US will release weekly PPI, retail sales and initial jobless claims data, all of which could influence the policy outlook.
Viewpoint: Rate cuts and political uncertainty pave the way for gold to hit new highs
Uncertainty over the independence of the Federal Reserve and continued central bank buying of gold are key factors supporting gold prices. Demand for gold ETFs grew at its fastest pace since early 2020 in the first half of this year.
If the independence of the Federal Reserve is increasingly questioned, the safe-haven value of gold will increase significantly. Gold is a counterweight to fiat currencies (US dollars), and once investors question the independence of central banks, demand will increase.
Forex Market Volatility and Safe Haven Demand
Recent trade policy uncertainty has added to volatility in global forex markets.
The Indian rupee is nearing a record low against the US dollar, with the Reserve Bank of India selling at least $5 billion to support the exchange rate.
The US dollar has weakened after a brief rally, while the Chinese yuan has remained stable.
The weakening US dollar has somewhat increased the relative appeal of gold, leading to a recovery in safe-haven demand.
Technical Outlook Analysis OANDA:XAUUSD
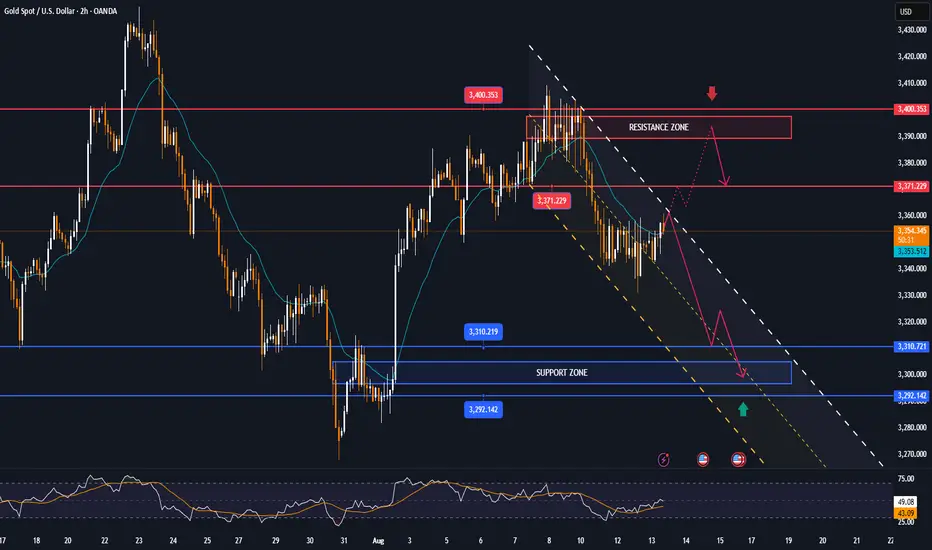
Gold rallied, but the recovery momentum is still limited by the EMA21 as the first resistance, followed by the 0.236% Fibonacci retracement level. If gold breaks above the 0.236% Fibonacci retracement level, it will be eligible to continue to increase in price towards the 3,400 USD price point, opening a new bullish cycle.
However, at the current position, gold price can still retest the $3,310 – $3,300 area due to the pressure from EMA21 and 0.236% Fibonacci retracement. This means that the $3,310 – $3,300 area is an important support area for the uptrend. As long as gold remains above $3,300, it can still increase in the short term, but in case of a sell-off below $3,300, confirmed by a price action below $3,292, it will open the conditions for a downtrend with the next target around $3,246 in the short term.
During the day, the trend of gold prices is generally sideways, with balanced conditions and indicators, described by the Relative Strength Index (RSI) hovering around the 50 level, also showing the market's hesitant sentiment. Personally, I am inclined to the upside, along with that, open long positions should be protected when the 3,300 USD mark is broken below.
Notable positions will also be listed as follows.
Support: 3,310 – 3,300 – 3,292 USD
Resistance: 3,350 – 3,371 – 3,400 USD
SELL XAUUSD PRICE 3391 - 3389⚡️
↠↠ Stop Loss 3395
→Take Profit 1 3383
↨
→Take Profit 2 3377
BUY XAUUSD PRICE 3299 - 3301⚡️
↠↠ Stop Loss 3295
→Take Profit 1 3307
↨
→Take Profit 2 3313
BTC - Short Plan UpdateAs per previous warning of the possibility of upwards liquidity grab first, here are updated details and a better entry for this trade.
Entry - 118,500-119,000
Stop Loss - 122,000
Target 1 - 62,000
Target 2 - 35,000
Target 3 - 8,000
- Note that per my plan we would drop to 35,000 and retrace (long) back up to 84,000 to 90,000 to form a 3 wave corrective drop.
- Note that the ultimate bottom could also sit between 17,000 to 19,000, however per my years of work, I believe 7,000 to 8,000 will be hit.
NOTE THIS IS NOT FINANCIAL ADVICE NOR IS IT A SUGGESTION ON HOW TO MANAGE YOUR MONEY. THIS IS MY PERSONAL TRADE ONLY.
Happy Trading.

GOLD hesitates, inflation data day in focusOANDA:XAUUSD came under pressure on Monday (August 11) and recovered slightly this morning, Tuesday (August 12). US President Trump made it clear that he would not impose tariffs on gold imports, erasing earlier market concerns about disruptions to the global gold supply chain. Investors are now turning their attention to US inflation data, due to be released this week, to gauge the Federal Reserve's interest rate outlook.
Tariff doubts dissipated
Trump tweeted: "There will be no tariffs on gold!" without providing further details. The announcement brought relief to the global gold market.
As a global gold transit and refining hub, Switzerland was once considered the "biggest victim" but Trump's latest statement essentially eliminated that risk.
Investor focus shifts to inflation
As the tariff uncertainty fades, traders will turn their attention to other market factors, the most important of which is the Federal Reserve's interest rate outlook.
• If US inflation data comes in higher than expected, this could give the Federal Reserve reason to pause its rate cut in September, which would put pressure on gold prices;
• But if the data is mild or even weak, this is expected to support gold prices as market expectations of lower interest rates are further reinforced.
Market Outlook
In the short term, gold is entering a correction phase after tariff concerns are resolved, and price movements may be more influenced by US dollar and inflation data.
If inflation remains low and the US Federal Reserve (Fed) sends a dovish signal, gold prices are expected to maintain high support levels; however, if inflation exceeds expectations and the US dollar strengthens, gold prices may face the risk of a deeper correction.
In the medium to long term, gold remains valuable as a safe haven and an asset allocation channel amid global economic uncertainty and the possibility of low interest rates.
The market expects core CPI to rise to 3.0% year-on-year in July, up from 2.9% in June. The pass-through of tariff costs could spur a rebound in goods inflation.
• If the data beats expectations, the Federal Reserve could delay a rate cut.
• Conversely, a weaker reading would increase the odds of a rate cut in September, with futures currently implying an 87% chance.
Technical Outlook Analysis OANDA:XAUUSD
Gold recovered, operating around the EMA21, showing that the overall market sentiment is still hesitant to wait for a breakthrough impact from the fundamental side.
In the short term, gold is under technical pressure from the EMA21, and the 0.236% Fibonacci retracement level, and for gold to have all the conditions for a continued bullish expectation, it needs to break above the said Fibonacci retracement level, after which the short-term target is the raw price point of 3,400 USD.
If gold continues to break the raw price point of 3,400 USD and operates above this level, the possibility of a new bullish cycle will be opened with the next target at 3,430 USD - 3,450 USD.
On the other hand, gold is still above $3,300, which does not allow the conditions for a bearish cycle to appear. That means as long as gold remains above the original price point of $3,300 and the 0.382% Fibonacci retracement level, it can still increase in the short term.
In case gold sells below $3,300, it will be eligible for a bearish cycle, the target then will be $3,246 in the short term, more than the 0.50% Fibonacci retracement level.
On the momentum front, the RSI hovers around the 50 mark, indicating a hesitant market sentiment, but an upward bend from 50 would be a positive signal for upside potential.
For the day, the overall outlook remains bullish and the key points to watch are listed below.
Support: $3,340 – $3,310 – $3,300
Resistance: $3,371 – $3,400
SELL XAUUSD PRICE 3377 - 3375⚡️
↠↠ Stop Loss 3381
→Take Profit 1 3369
↨
→Take Profit 2 3363
BUY XAUUSD PRICE 3298 - 3300⚡️
↠↠ Stop Loss 3294
→Take Profit 1 3306
↨
→Take Profit 2 3312

GER40As mentioned before, dax is going to go down, then recover. So far on the 4H chart we can see it has already started its move down.

CAKEUSDT.P : Small Long and Short OpportunityThere is 2 Opportunities for a Long and Short on Cake, Dont miss it. free Profit waiting :)

Data week, GOLD has all the conditions to riseThis week, global financial markets will look forward to US inflation data for July (CPI, PPI), retail sales data and speeches from several Federal Reserve officials.
These important pieces of information will directly impact expectations for a September rate cut and influence the performance of the US Dollar, gold, crude oil and US stocks.
On the political front, US President Donald Trump's public pressure on the Federal Reserve and recent appointments have raised market concerns about the independence of monetary policy, while escalating tariffs continue to raise the risk of global trade conflicts.
Federal Reserve: Policy Disruption and Dovish Signals Coexist
This week, the Fed kept its target range for the federal funds rate unchanged at 4.25% to 4.50%, but the vote was split, with two officials—Vice Chair Michelle Bowman and Governor Christopher Waller—in favor of an immediate quarter-point rate cut.
TVC:DXY : Technical Pressure and Political Risk
The US Dollar Index (DXY) has fallen to around 98 this week, failing to hold above 100. Technically, a break of the July low of 96.37 could lead to a drop to 95.13 and 94.62. Despite the 10-year Treasury yield rising to 4.285%, the Dollar remains under pressure, reflecting market concerns about political risks in the United States.
If CPI is higher than expected this week, the market may feel like it is moving too fast, which could cause volatility.
Traders generally believe that Trump's tariff policies, public criticism of the Federal Reserve and uncertainty about the fiscal deficit are all weakening the medium- to long-term support for the US Dollar.
Markets will be watching closely to see if the impact of tariffs starts to show in inflation data, and if consumer spending data confirms the economic recovery. A positive reading would reinforce expectations for a rate cut, a positive signal for stocks and gold. An unexpected rise in inflation could slow the pace of Fed easing, weighing on risk assets and supporting the US Dollar TVC:DXY .
Technical Outlook Analysis OANDA:XAUUSD
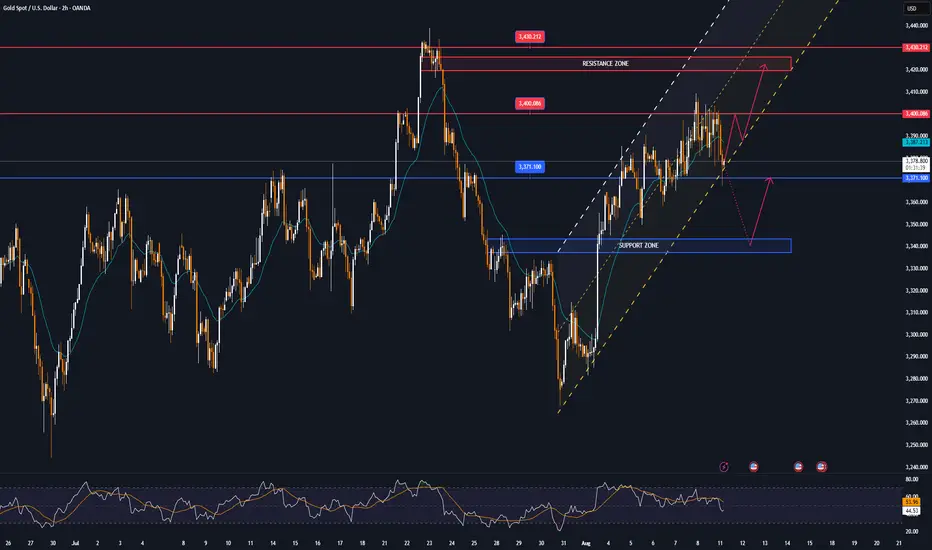
Gold has been on a long bullish recovery since breaking out and holding above the $3,300 base point, and currently structurally it has not changed much with the uptrend still dominating the daily chart.
Specifically, in the short term, gold is supported by the EMA21 with the target at the $3,400 base point noted by readers in the weekly publication last week has been achieved.
Looking ahead, the horizontal support at the 0.236% Fibonacci retracement will be the nearest support to reinforce the expectation of a continued breakout of gold prices breaking through the $3,400 point towards the $3,430 – $3,450 level.
In terms of momentum, the Relative Strength Index (RSI) has moved above 50 but is still quite far from the overbought zone (80-100), indicating that there is still a lot of room for upside ahead.
Meanwhile, even if gold is sold below the EMA21, the declines are not considered a specific technical trend in the short term, as long as the support levels of 3,310 – 3,300 USD and Fibonacci 0.382% are not broken below.
Finally, in terms of position as well as technical conditions, the gold price on the daily chart currently has a technical outlook leaning more towards the upside and the notable points will be listed as follows.
Support: 3,371 – 3,350 – 3,340 USD
Resistance: 3,400 – 3,430 – 3,350 USD
SELL XAUUSD PRICE 3424 - 3422⚡️
↠↠ Stop Loss 3428
→Take Profit 1 3416
↨
→Take Profit 2 3410
BUY XAUUSD PRICE 3338 - 3340⚡️
↠↠ Stop Loss 3334
→Take Profit 1 3346
↨
→Take Profit 2 3352
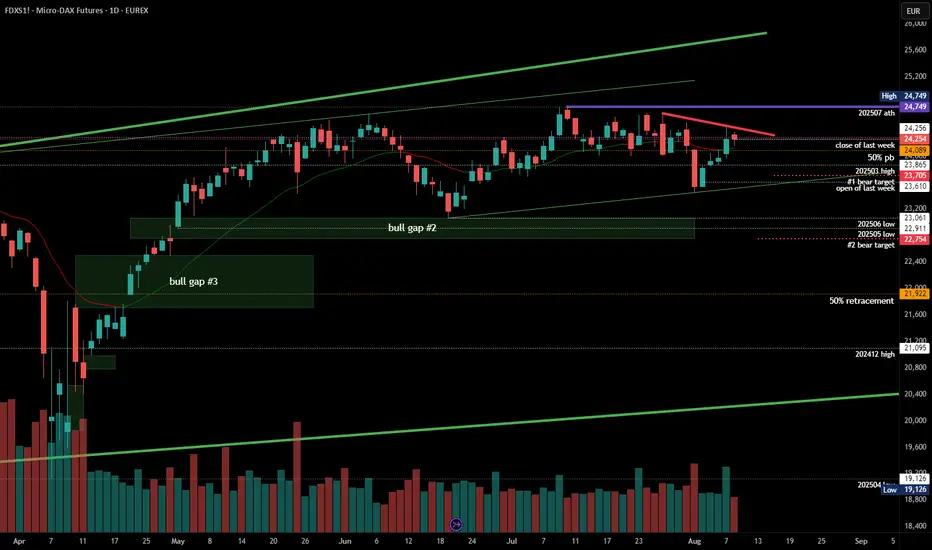
#202532 - priceactiontds - weekly update - fdaxGood Evening and I hope you are well.
comment: Multiple ways to draw triangles on this daily chart and I will continue to bet on a contracting range. So for me shorts above 24200 are mighty fine with stop 24750. Mid-point of the most obvious triangle is 24090 which is my line in the sand for both sides. If any side can turn it support/resistance, it will likely be the signal for breakout. 24090 is never 100% accurate, prices always have to be viewed as areas/zones and not exact points.
current market cycle: trading range
key levels for next week: 23500 - 24750
bull case: Bulls want to run the stops above 24510 where the sell-off end of July began, which they already stuffed. Every daily bar lasted week hat a big tail above and yet we still moved higher each day except Friday. It’s 50/50 if we go above 24510 or not. Even if bulls get above it, no long above 24250 has been profitable for more than 1-2 days, so the upside will likely be very limited.
Invalidation is below 23000
bear case: Bears messed up again last week but they can still make an important statement by not letting the market get above 24500 again. Due to the strong reversal this week, we can not expect the market to print new lows next week. Bears are favored here since it’s the upper third of the range.
Invalidation is above 24750
short term: Bearish for at least 24000 again but could go to 23700. Stop has to be 24751 as of now.
medium-long term from 2025-08-10: Another stuffed attempt. Kills me. I still think the highs are in but it’s more like a 50/50 bet right now.
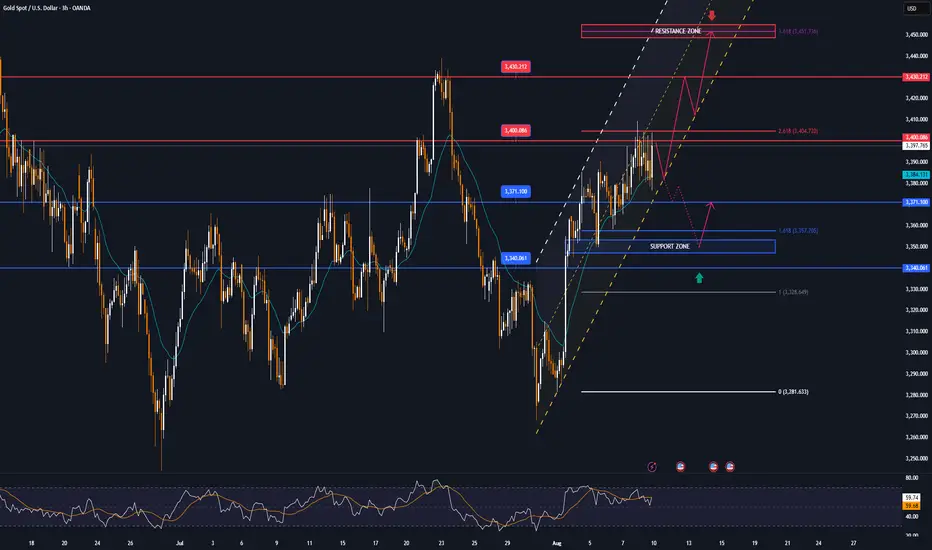
GOLD MARKET ANALYSIS AND COMMENTARY - [Aug 11 - Aug 15]This week, the international OANDA:XAUUSD price has been almost flat, fluctuating only within the range of 3,345 USD/oz to 3,408 USD/oz. Notably, every time the gold price exceeds 3,400 USD/oz, it is pushed down below this level by profit-taking pressure.
Next week, the US Bureau of Labor Statistics will release its July Consumer Price Index (CPI) on Tuesday. Accordingly, the CPI in July is forecast to increase to 2.8% compared to the same period last year, from 2.7% in June. According to many experts, this increase in inflation is not strong enough to make the Fed delay cutting interest rates at its meeting in September. Therefore, strong fluctuations in the annual CPI figures will strongly affect the Fed's interest rate cut expectations.
If the CPI in July rises above the 3% threshold, it will reduce expectations of the FED cutting interest rates in September, helping the USD increase, pushing gold prices down next week. Conversely, if the CPI in July falls below forecasts, it will push gold prices up sharply next week.
In addition to CPI data, the US also announced retail sales for July. The US economy is driven by consumption, so if retail sales decline sharply, it will also negatively impact the USD, thereby pushing gold prices up next week and vice versa.
With the current context and the above economic data, it is likely that gold prices next week will continue to move sideways, with no strong fluctuations.
📌In terms of technical analysis, the level of 3,350 USD/oz is the first support level, followed by the area of 3,285 - 3,300 USD/oz. Meanwhile, the level of 3,450 USD/oz is a strong resistance level, surpassing this level, the gold price next week has the opportunity to challenge 3,500 USD/oz. However, this possibility is not highly appreciated.
Notable technical levels are listed below.
Support: 3,371 – 3,350 – 3,340USD
Resistance: 3,400 – 3,430 – 3,350USD
SELL XAUUSD PRICE 3452 - 3450⚡️
↠↠ Stop Loss 3456
BUY XAUUSD PRICE 3349 - 3351⚡️
↠↠ Stop Loss 3345
BTC - Short Trade / Crash Update and DetailsPer my previous post here are the details on my personal trade. Note this is NOT financial advice, and this is my own personal trading plan only. Please use your own judgement.
Entry - 116,300 to 116,600
Stop Loss - 121,800
Target 1 - 95,700
Target 2 - 61,500
Target 3 - 35,000
Target 4 - 8,000
Note that Bitcoin should move up from the 35,000 target to 88,000 making a corrective wave on HTF.
At this point I will post an update and advise my own strategy and if I long 35,000 to 88,000.
Happy trading

GOLD spikes then falls rapidly, all conditions are bullishOANDA:XAUUSD prices surged after falling in the previous trading day, as Trump tariffs took effect and weak U.S. jobs data raised expectations of interest rate cuts, boosting safe-haven demand.
OANDA:XAUUSD prices reversed course on Thursday, posting sharp gains as the latest U.S. jobs data showed a weakening labor market. Investors, therefore, increased their dovish bets as the Federal Reserve is expected to resume its easing cycle in September.
The number of people filing for continuing unemployment benefits in the United States has hit a high not seen since November 2021, adding momentum to the Federal Reserve’s dovish stance. With inflation remaining high and the U.S. job market weak, the risk of stagflation has emerged.
Data released by the U.S. Labor Department on Thursday showed that continuing unemployment claims rose by 38,000 to 1.97 million in the week ended July 26. The high level suggests that it is increasingly difficult for unemployed people to find new jobs. Initial jobless claims also rose to 226,000 last week, exceeding economists’ expectations.
The data has bolstered market expectations for a Fed rate cut
Last week, weak U.S. nonfarm payrolls data boosted expectations for a rate cut.
According to data from Prime Market Terminal, traders see a 95% chance of a 25 basis point rate cut at the September meeting.
Meanwhile, higher tariffs imposed by U.S. President Donald Trump took effect on Thursday, providing a tailwind for gold, Valencia added. Countries affected include Switzerland, Brazil and India, which have yet to reach a deal with Washington.
Gold, a store of value in times of uncertainty, also tends to perform well in low-interest-rate environments.
Milan joins Fed, adding pressure on Powell to cut rates
US President Trump announced on Thursday that he will nominate Stephen Milan, currently chairman of the White House Council of Economic Advisers, to serve on the Federal Reserve Board, replacing Kugler, who unexpectedly resigned last week. The news also helped push gold prices higher on Thursday.
Trump said on social media Truth Social: "Stephen Milan will serve as the newly vacated seat on the Federal Reserve Board of Governors until January 31, 2026. He has been with me since my second term and his economic expertise is unmatched. He will do an outstanding job."
Technical Outlook Analysis OANDA:XAUUSD
Gold currently has all the bullish conditions, specifically the gold price broke above the 0.236% Fibonacci retracement level of $3,371 and tested the original price point, which is the target upside point of the $3,400 area.
The $3,371 level becomes the nearest support at present, while the Relative Strength Index (RSI) shows that there is still room for further upside ahead. As long as gold remains above the EMA21, it still has a bullish outlook in the short term.
There are hardly any factors that suggest that gold can fall significantly, so the general trend in the short and medium term is bullish and the notable points will be listed as follows.
Support: $3,371 - $3,350
Resistance: $3,400 - $3,430 - $3,450
SELL XAUUSD PRICE 3431 - 3429⚡️
↠↠ Stop Loss 3435
→Take Profit 1 3323
↨
→Take Profit 2 3317
BUY XAUUSD PRICE 3339 - 3341⚡️
↠↠ Stop Loss 3335
→Take Profit 1 3347
↨
→Take Profit 2 3353

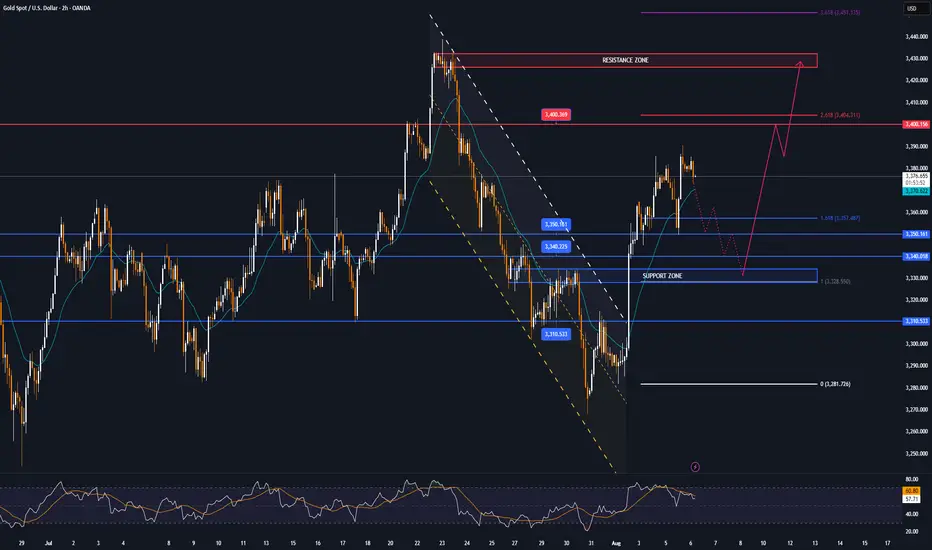
Gold at All-Time Highs – Blow-Off or Breakdown?Gold has just printed new all-time highs, but I’m approaching with caution. At these levels, everyone long is in profit — leaving no trapped buyers above and only liquidity for smart money to grab.
We kicked off the session with an impulsive spike higher, but this may have been a stop run and liquidity sweep rather than the start of another leg up. If price struggles to hold above that spike or fails on a re-test, we could see sellers step in, targeting the 4H FVG zone below.
For now, I’m watching:
A possible revisit of yesterday’s high to “fix” lack of excess on the DOM
London session reaction to today’s spike high
Potential short setups if buy-side momentum stalls
NY session might deliver the day’s best move, but we could see early opportunities in the Asian and London sessions if price confirms a shift in order flow.
What do you think? Is this a blow-off top in the making, or do buyers have one more push?

EURUSD; Heikin Ashi Trade Idea📈 Hey Traders!
Here’s a fresh outlook from my trading desk. If you’ve been following me for a while, you already know my approach:
🧩 I trade Supply & Demand zones using Heikin Ashi chart on the 4H timeframe.
🧠 I keep it mechanical and clean — no messy charts, no guessing games.
❌ No trendlines, no fixed sessions, no patterns, no indicator overload.
❌ No overanalyzing market structure or imbalances.
❌ No scalping, and no need to be glued to the screen.
✅ I trade exclusively with limit orders, so it’s more of a set-and-forget style.
✅ This means more freedom, less screen time, and a focus on quality setups.
✅ Just a simplified, structured plan and a calm mindset.
💬 Let’s Talk:
💡Do you trade supply & demand too ?
💡What’s your go-to timeframe ?
💡Ever tried Heikin Ashi ?
📩 Got questions about my strategy or setup? Drop them below — ask me anything, I’m here to share.
Let’s grow together and keep it simple. 👊

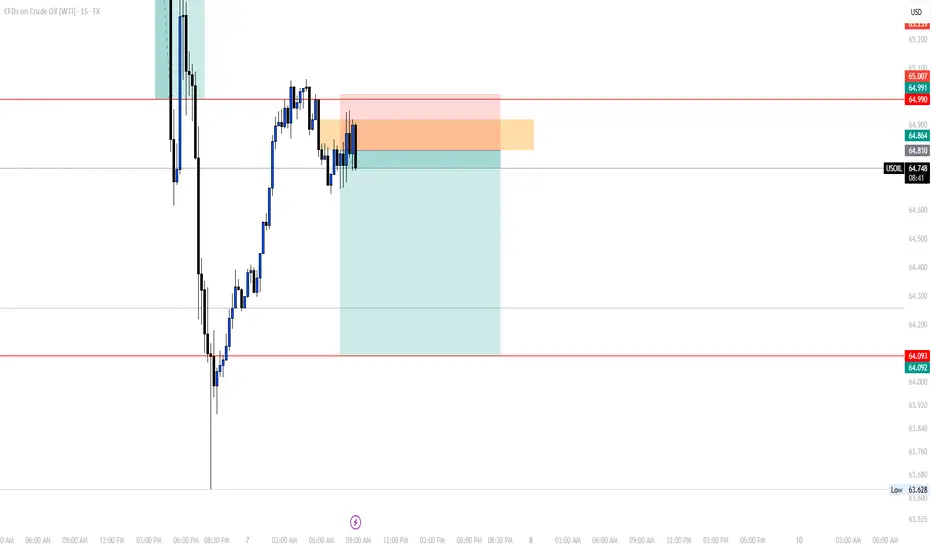
TP REACHEDOur 2nd trade of the day closed with profits.
We choose to close our trade right before it reached the main TP due to one reason, a pullback on a Liquidity lvl we have at 64.178 (5min chart).
It was a great day!
See you tomorrow!
Follow for more!

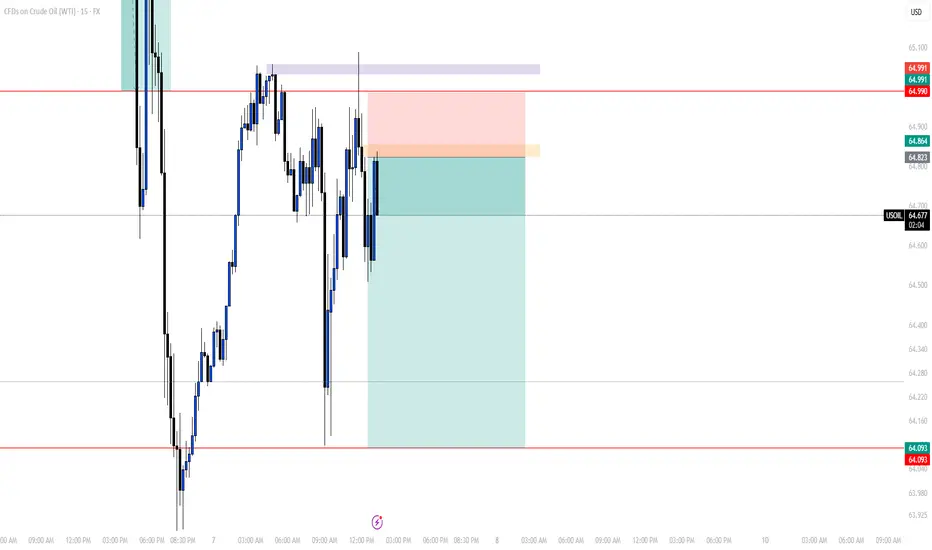
SELL USOILOur 2nd trade if the day on USOIL is a short one again since the price kept grabbing BSL to continue pushing lower and lower.
You can sell and follow the same levels as mine
Follow for more!
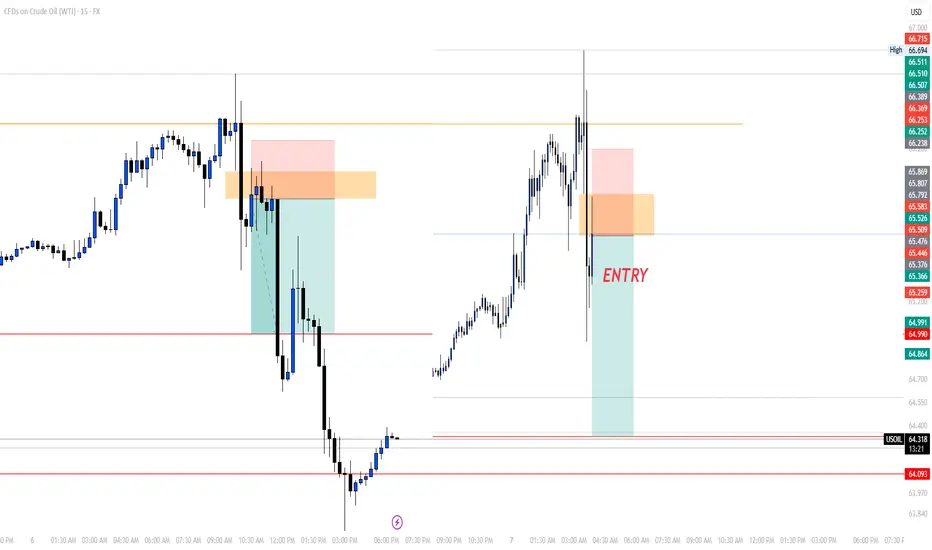
UPDATE ON THIS MORNING'S TRADEEarly in the morning, I posted a trade (Sell USOIL) in which we trargeted the LQ level which the market came closer to and didn't touch, which isn't a big deal.
As you can see on the chart, as I told my students during the LIVE TRADING SESSION they assisted, it's all about trade management.
On the screenshot on the left, we added another order at 50% lvl of the FVG, xhich the market respected at that moment before giving us a double bottom which is a sign to the change of the movement of the market.
For a safe closure of the trade, as you can see in the picture on the left, we waited for the market to break through the 5min LQ we have to close, and that's what exactly happened.
We'll wait for another trade to take later in the US session.
Follow for more!

SELL USOILThis morning we're going short again on OIL, since as you can see the price grabbed the LQ and gave us a proper rntry point we entered based on 1h ago.
Follow for more!
OUR TRADE FOR THE DAYEarly today, I posted that we'll be waiting for the market to give us an entry after grabbing the liquidity, we did have it and caught it.
I didn't share it since it was given to my students.
As you can see on the chart, the market gave us a FVG after that it did grab the liquidity which we entered based on to target again the LQ level to close with a good margin.
Follow for more!
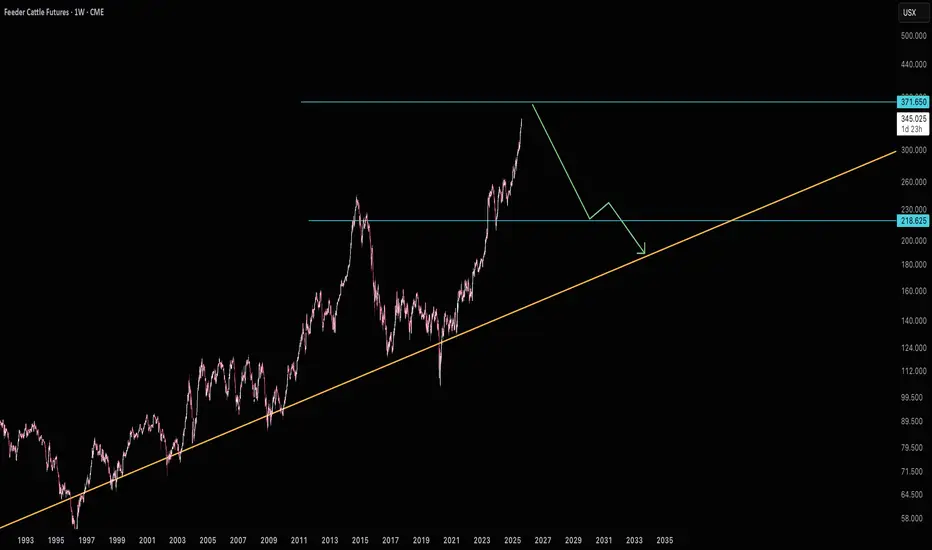
Feeder Cattle to $371 Then Back Down to $218GF is well above it's long term average. Great short opportunity at $371.
Good luck!
TRADE CANCELEDThis morning I posted to take a long trade and we canceled it since the price didn't come to our entry point which is a normal thing to happen, now after that it took the daily LQ, we'll be waiting for the price to give us a sort entry to take.
Follow for more!
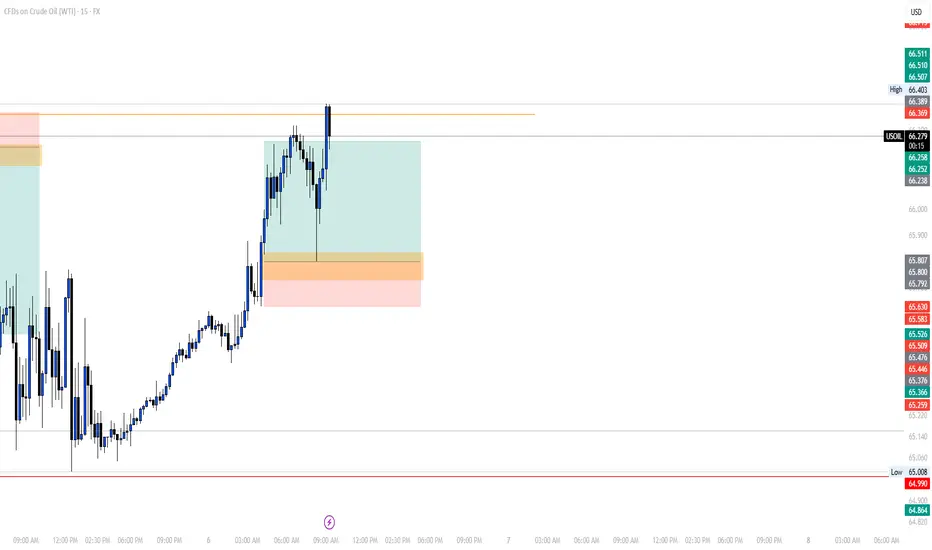
BUY USOILI'm sharing with you our trade today on OIL.
The reason we're buying is because yesterday the market grabbed the LQ now it is reversing to climb higher to fill all of the FVG we got in the previous movement.
For a safe entry, wait for the price to come back to our entry poin at 65.800 since I myself am waiting for the price to come to our entry point.
Follow for more!

GOLD trades in narrow range, leading market pulseThe current market pulse is still mainly revolving around the Trump-initiated tariff story, with spot OANDA:XAUUSD trading in a fairly narrow range and currently reported at $3,376/oz, down 0.13% on the day. Gold is also awaiting further impact from the Fed's interest rate cut, with a weaker Dollar providing support for non-yielding gold.
Tariff News Update
US President Donald Trump said on Tuesday (August 5) that US tariffs on imported semiconductors and pharmaceuticals will be announced “in about a week”. The progressive tariffs on imported pharmaceuticals could be as high as 250%.
US news agency Bloomberg News said the Trump administration is now preparing to target key economic sectors and pledge to reshape global trade.
“We’re going to start with a lower tariff on drugs, but within a year, not more than a year and a half, it’s going to be 150%, then 250% because we want drugs made in our country,” Trump said in an interview with CNBC on Tuesday. He did not specify what the initial tariff would be.
“We’re going to be announcing measures on semiconductors and chips, which is a different category,” Trump added. However, Trump did not provide further details.
The U.S. Commerce Department has been investigating the semiconductor market since April as it prepares for possible tariffs on an industry with estimated global sales of nearly $700 billion. The U.S. has imposed tariffs on imported cars, auto parts, as well as steel and aluminum under the Trump administration.
Tariffs on imported chips could significantly raise costs for major data center operators, including Microsoft Corp., OpenAI, Meta Platforms Inc. and Amazon.com Inc., which plan to spend billions of dollars on the advanced semiconductors needed to power their artificial intelligence businesses.
On the Fed’s interest-rate path
US job growth in July missed expectations, while nonfarm payrolls data for May and June were revised down significantly, with a combined loss of 258,000 jobs, suggesting a worsening labor market.
Furthermore, San Francisco Fed President Mary Daly said on Monday: "We may need more than two rate cuts, and more is likely." She also noted: "The labor market is not too weak, but it is weakening, and further weakening would be detrimental."
Surprising US labor market data and Daly’s dovish comments have all but confirmed the likelihood of a Fed rate cut in September. According to CME’s FedWatch tool, the market is now pricing in a 90% chance of a Fed rate cut in September.
OANDA:XAUUSD is often seen as a safe haven asset during times of political and economic uncertainty, and performs better in low-interest-rate environments.
Technical Outlook Analysis OANDA:XAUUSD
Gold is still trading in a fairly narrow range yesterday, but the price action is still mainly held above the EMA21 and it still has all the conditions for a possible increase. However, although the range is quite large, the overall situation is still showing a sideways accumulation trend.
Currently, gold is supported by the EMA21, followed by the short-term $3,310 level and the raw price point of $3,300. As long as it remains above the psychological $3,300 level, it is still eligible for a short-term bullish outlook.
Meanwhile, a break above $3,400 would open the door for a new short-term bullish cycle with the next target around $3,430 – $3,450.
On the momentum front, the RSI maintains its price action above 50 and is still far from the overbought zone (80 – 100) suggesting that there is still plenty of room for upside ahead.
During the day, in terms of technical position, gold has unchanged conditions that are inclined to increase in price, and the notable positions will be listed as follows.
Support: 3,350 – 3,340 – 3,310 USD
Resistance: 3,400 – 3,430 – 3,450 USD
SELL XAUUSD PRICE 3431 - 3429⚡️
↠↠ Stop Loss 3435
→Take Profit 1 3323
↨
→Take Profit 2 3317
BUY XAUUSD PRICE 3329 - 3331⚡️
↠↠ Stop Loss 3325
→Take Profit 1 3337
↨
→Take Profit 2 3343
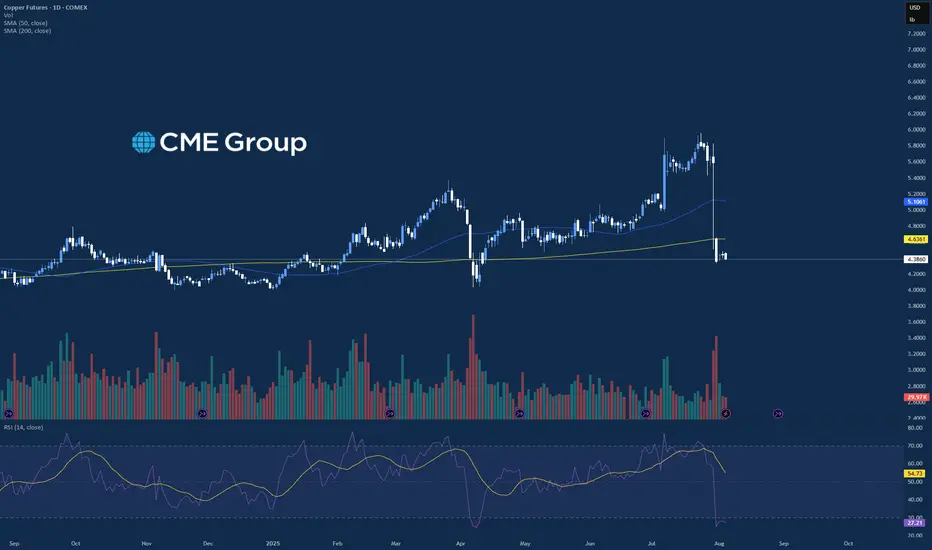
Strength in Precious Metals ContinuesThere was a good mix in price action across many asset classes on the day today where the precious metals traded higher led by the Silver market, which traded up near 1.3% on the day. There was a mixed set of data being released today with manufacturing data and PMI, and the S&P and Nasdaq finished the day lower. Over the past few weeks, there has been significant volatility in the precious metals looking at Gold, Silver, and Copper, and the last few trading days Gold and Silver have strung together a few positive days in a row. Both Gold and Silver have been trading at or near all time high prices and have been able to hold at these levels even with slight selling pressure.
Copper on the other hand has continued to struggle after the 50% tariff on all imports was announced last week, and the market has dropped from “overbought” to “oversold” levels on a daily basis in a matter of a few days. There will be a good amount of earnings coming out for the remainder of the week that could add additional volatility to the equity indices along with the precious metals to wrap up the week.
If you have futures in your trading portfolio, you can check out on CME Group data plans available that suit your trading needs tradingview.com/cme/
*CME Group futures are not suitable for all investors and involve the risk of loss. Copyright © 2023 CME Group Inc.
**All examples in this report are hypothetical interpretations of situations and are used for explanation purposes only. The views in this report reflect solely those of the author and not necessarily those of CME Group or its affiliated institutions. This report and the information herein should not be considered investment advice or the results of actual market experience.