ETHUSD 4H TIME FRAME ETHUSD is showing bullish momentum on the 4-hour chart with a strong structure to support further upside. The setup targets a potential continuation to 3,718.8, with protective risk control below 3,250.4. Watch for a clean break above 3,540 to accelerate the bullish move.
Futures

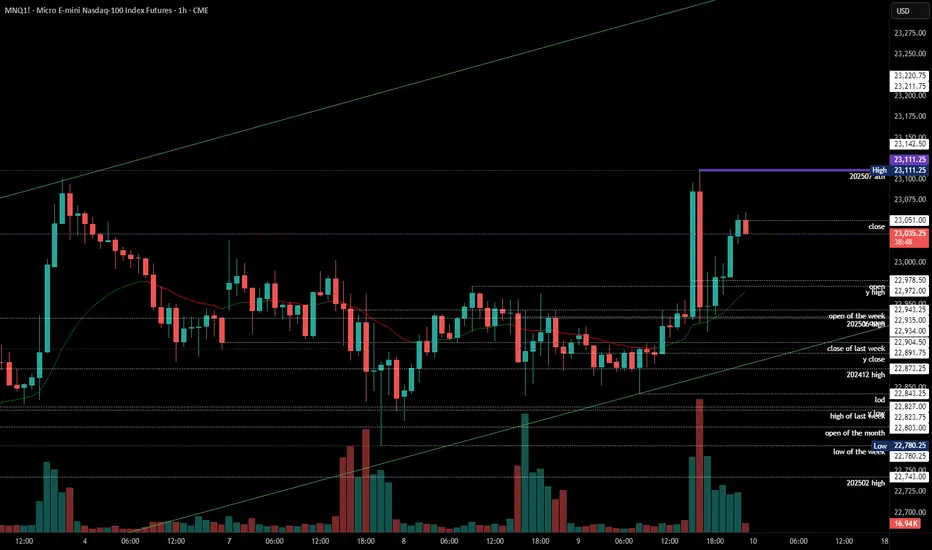
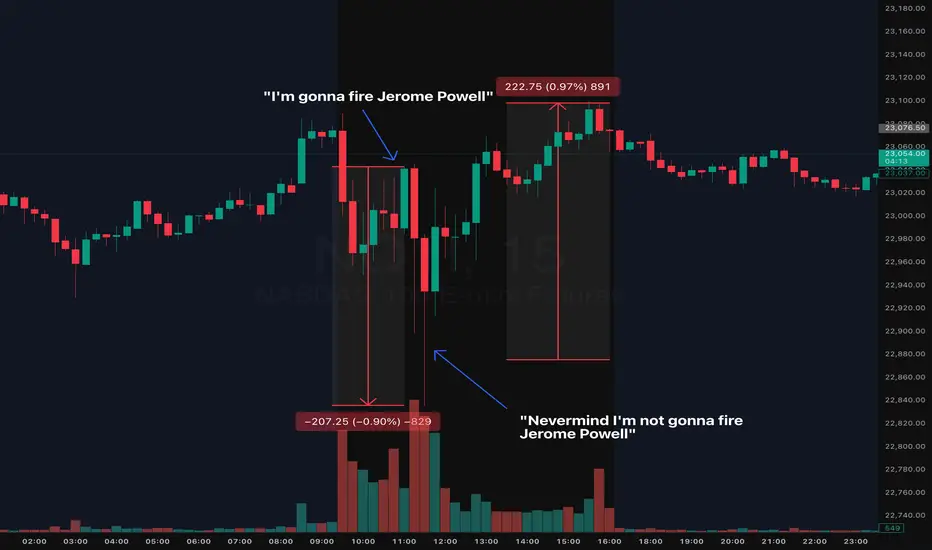
2025 Trading Final Boss: Daily Market Manipulation, The New NormMarking this point in history because we'll likely forget and move on.
During the early hours of the July 16th NYC session, we saw indices quickly flush ( CME_MINI:NQ1! CME_MINI:ES1! ) nearly 1% on the news that Trump will fire Jerome Powell. The dip was bought almost instantly.
Shortly after the dip was bought (roughly 0.50% recovery), guess what? Trump announced, he is "not considering firing Jerome Powell". The dip then recovered and achieved a complete V to finish the day somewhat green. Make what you want of it but always use a stop loss in these tough conditions.
Welcome to 2025 Trading Final Boss
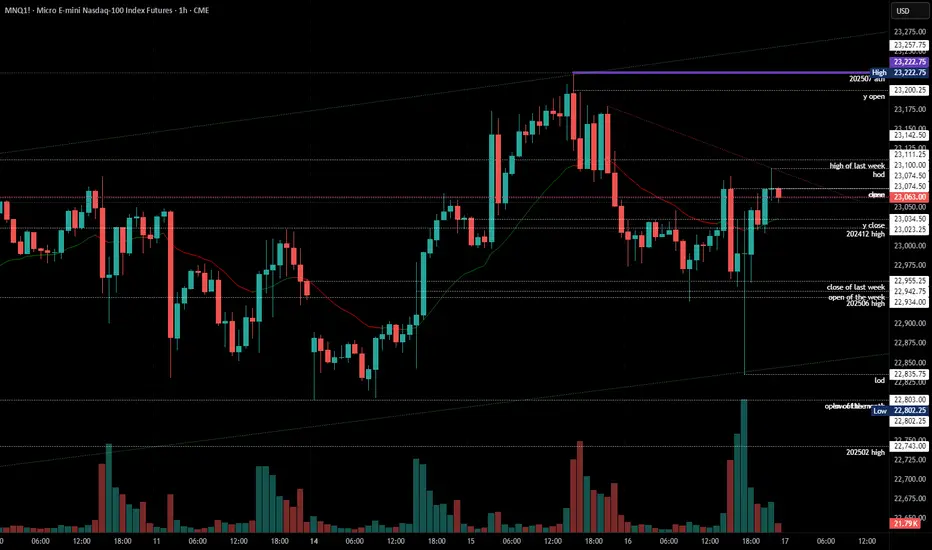
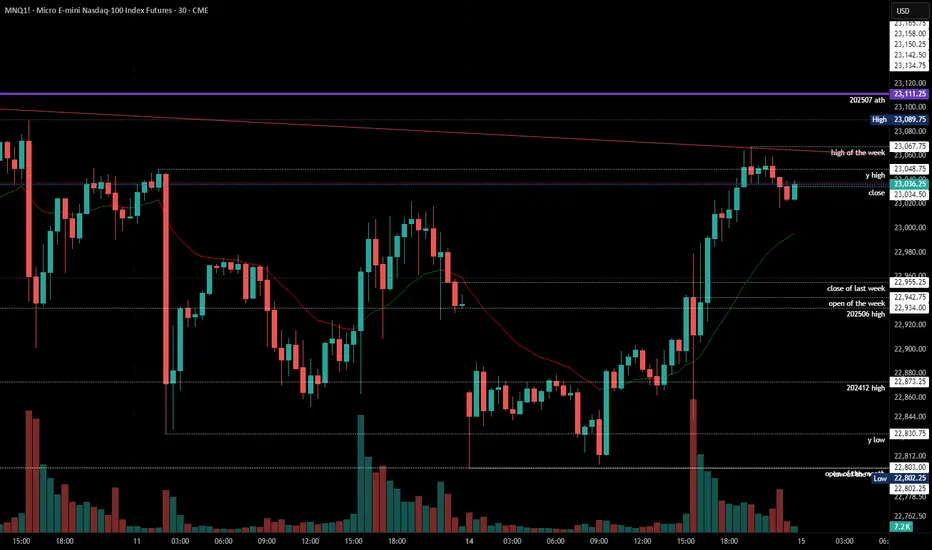
2025-07-16 - priceactiontds - daily update - nasdaqcomment: Bond markets are going ballistic. Fun times ahead. Technically it’s a trading range under ath and bears are too weak to print any decent bear bar on the daily tf.
current market cycle: bull trend
key levels: 22600 - 23300
bull case: Bulls are might fine. No daily bar is closing on it’s low and we are printing bull bar after bull bar. Daily 20ema is around 22700 and as long as we stay above, bulls remain in full control. Not event imminent firing of JPow and the bond market implosion are stopping this. Truly astonishing.
Invalidation is below 22700.
bear case: Bears are pathetic. Need lower lows below 22770. That’s it. Even if we get them, daily 20ema should be support unless an event triggers big time.
Invalidation is above 23300.
short term: Neutral. Bears barely doing anything but I have no interest in buying this frenzy, given the risks we are facing. We will go down hard soon but right now nothing about this is bearish. I do think the only bearish scenario could be that Jpow resigns/gets fired tomorrow/Friday and we drop down hard to next big support around 22000. I’d be surprised if we could get that low tbh.
medium-long term - Update from 2024-06-29: No change in plans. I expect 20000 to get hit over the next 3 months and maybe 19000 again.
trade of the day: Short US open was my preferred trade today but stop had to be 23223, so far away and target was not all that big since 23000 was the obvious support. The drop down to 22835 was a bit much but given the news, it could have easily led to a much bigger sell-off if the markets weren’t ignoring literally every risk under the sun.

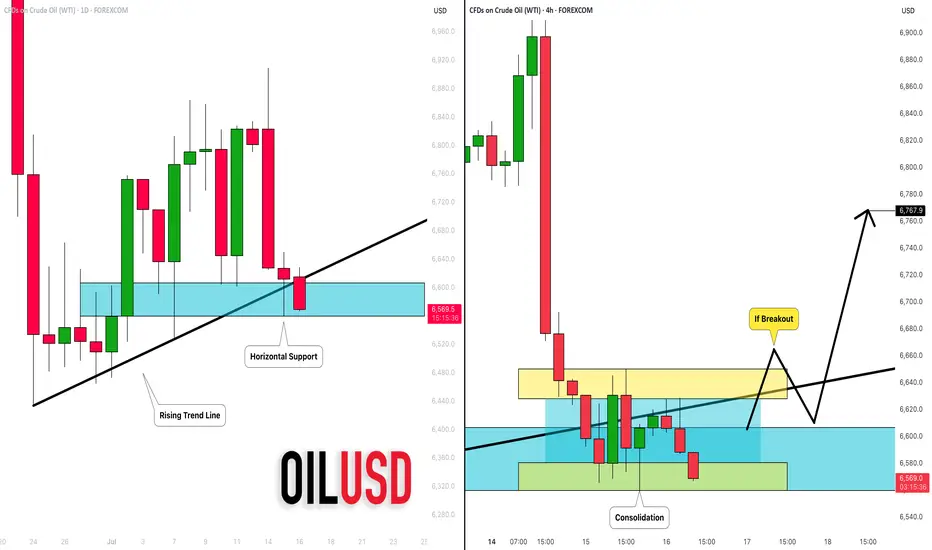
CRUDE OIL (WTI): Your Trading Plan Explained
Do not forget that today we expect Crude Oil Inventories data
release - it will be 10:30 am NY time.
Ahead of this news, the market is testing a significant daily support cluster
that is based on a rising trend line and a horizontal structure.
You signal to buy will be a bullish breakout of a minor intraday
horizontal resistance on a 4H.
4H candle close above 66,5 will be your confirmation.
A bullish continuation will be expected to 67.6 then.
I suggest waiting for the news release first and then check how
the market prices in the news. If our technicals align with fundamentals,
it will provide an accurate setup.
Alternatively, a bearish violation of a blue support will push the prices lower.
❤️Please, support my work with like, thank you!❤️
GOLD in narrow range, after sharp drop on US CPI dataOANDA:XAUUSD fell sharply on Tuesday (July 15) as the US Dollar TVC:DXY gained significantly after the US CPI report was released. As of now (July 16), gold is trading at 3,326 USD/oz, equivalent to an increase of only 2 USD in the day.
The US Consumer Price Index (CPI) in June was in line with expectations but higher than the previous value. The surge in the Dollar after the US released the June CPI is the main reason for the pressure on gold prices so far.
• Data released by the US on Tuesday showed that the US CPI increased by 2.7% compared to the same period last year in June, in line with expectations, but higher than the 2.4% in May.
• The US CPI rose 0.3% month-on-month in June, in line with market expectations but up from a 0.1% increase, the largest increase since January this year.
• In addition, the US core CPI rose 2.9% year-on-year in June, up from 2.8% in May, while the core CPI in June rose 0.2% month-on-month.
The market generally believes that US President Trump's tariff policies have increased price pressures, prompting the Federal Reserve to wait and see what further action to take. Federal Reserve Chairman Powell previously said he expected prices to rise in the summer.
The market is still expecting the first rate cut in September. Investors are looking ahead to Wednesday's U.S. producer price index data for more information on the Federal Reserve's move.
Since gold does not yield interest, it typically performs well in low-interest-rate environments, whereas high-interest-rate environments or expectations of future rate hikes put pressure on gold prices.
Technical Outlook Analysis OANDA:XAUUSD
On the daily chart, gold is trading in a fairly narrow range after 2 sessions of downward adjustment, but the specific trend is still unclear, as sent to readers throughout last week, the technical conditions mainly show a sideways accumulation movement. After testing the 0.236% Fibonacci retracement level, gold was unable to overcome this resistance, and the decline from this position brought the gold price close to the support of 3,310 USD and then the area of the original price point of 3,300 USD with the 0.382% Fibonacci retracement.
With the technical conditions not giving a specific trend as they are now, for gold to be able to have a new bullish cycle it needs to move the price action above the 0.236% Fibonacci retracement level, then the target would be around $3,400 in the short term, more than $3,430. On the other hand, if gold falls below the 0.382% Fibonacci retracement level again, it could be a good signal for an expectation of a bullish cycle, then the target would be around $3,246 in the short term, more than the 0.50% Fibonacci retracement level.
The relative strength index is hovering around 50, indicating that the market is hesitant in terms of momentum and is not leaning towards a specific trend.
During the day, with the current sideways accumulation, gold will be noticed by the following technical levels.
Support: 3,310 – 3,300 – 3,292 USD
Resistance: 3,240 – 3,250 – 3,371 USD
SELL XAUUSD PRICE 3383 - 3381⚡️
↠↠ Stop Loss 3387
→Take Profit 1 3375
↨
→Take Profit 2 3369
BUY XAUUSD PRICE 3304 - 3306⚡️
↠↠ Stop Loss 3300
→Take Profit 1 3312
↨
→Take Profit 2 3318
DXY: potentially aiming for January 2025 highsAlthough we do not Trade the dollar specifically, it is a good barometer the feel out other assets.
It seems like DXY reached a MONTHLY LEVEL. I expect price to form a FVG within this rectangle on the daily level. Which will eventually create a GAP on one of the currencies. Will follow up when this happens.
IMO reversed and is going to reach the daily level quick. This will mean, POUND, EURO DOWN.

Trading Day SummaryTrading Day Summary
Today wasn’t a winning day on the books, but it was a major win in discipline.
I hit my daily loss limit before 10 AM, stopped live trading, and switched over to paper trades to protect my capital.
The setups I took—especially in Gold and Euro—lacked full confirmation, and one overnight trade didn’t align with my plan.
I experienced around $200 in slippage, which added to the loss.
The bright side? I stayed in control. No revenge trades. No emotional spirals.
My paper trade afterward was textbook—5R+ potential. That tells me the strategy is sound. Execution and timing just need to be sharper.
Bottom line: this is a marathon, not a sprint. I’m proud of the discipline and the mindset. Tomorrow, we reset and refocus.

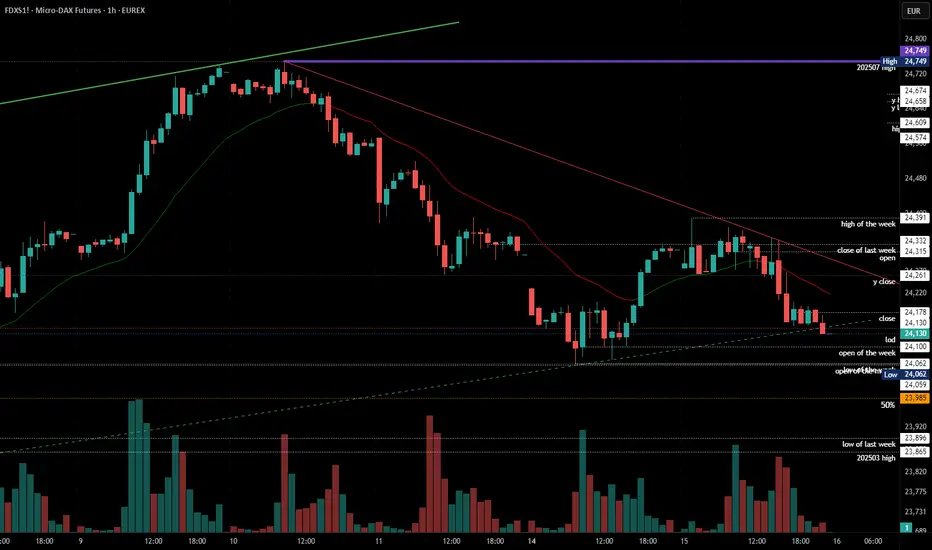
2025-07-15 - priceactiontds - daily update - daxGood Evening and I hope you are well.
comment: Very important day tomorrow. If we trade below 24000, this means we saw leg 1 from 24749 down to 24100 and leg 2 could lead us to 23500 or lower. Until we have clearly broken below 24000, I remain neutral but hopeful we can finally go lower again.
current market cycle: trading range
key levels: 23000 - 24750
bull case: Bulls need to stay above 24000 or risk a sell-off down to 23700ish. No matter how you try to draw the bull trend lines, they are all broken now but bears need lower lows below 23690 to confirm it. Daily ema is around 24100 and it has been support for 3 weeks and that is the reason I remain neutral for now.
Invalidation is below 24270.
bear case: Bears need to break below the daily ema and close below. Only then can we go lower. It’s good for the bears that they printed a lower high below 24400 but we are still too high for bulls to give up on BTFD.
Invalidation is above 24400.
short term: Neutral. If we stay below 24400, we have a shot at breaking down but 24000ish is support until proven otherwise. The selling today was not strong and the chart is rather neutral. Bears have only set up a potential structure which could break down but you have to wait for confirmation before betting on it.
medium-long term from 2025-06-29: Bull surprise last week but my targets for the second half of 2025 remain the same. I still expect at least 21000 to get hit again this year. As of now, bulls are favored until we drop below 23000
trade of the day: Scalping between 24250 - 24300 which was clear support & resistance for 4h after EU open. The bear breakdown was a surprise and not obvious to trade.
DIYWallSt Trade Journal: Perfect Morning Signals & Rate Cut bets07/15/25 Trade Journal, and ES_F Stock Market analysis
EOD accountability report: +404.50
Sleep: 7 hours
Overall health: Good
VX Algo System Signals from (9:30am to 2pm)
— 8:41 AM Market Structure flipped bullish on VX Algo X3!
— 9:33 AM VXAlgo ES X1 Sell Signal (triple sell)
— 9:40 AM Market Structure flipped bearish on VX Algo X3!
— 1:20 PM VXAlgo ES X1 Buy signal (triple buy)
What’s are some news or takeaway from today? and What major news or event impacted the market today?
We got great signals at the start of the day and that really helped with today's trading. I had some meetings today and stufff to take care of so i decided to lock out the funded account around noon and called a day.
News
— 9:54 AM
*TRADERS STICK TO BETS ON SEPTEMBER FED RATE CUT AFTER INFLATION REPORT
What are the critical support levels to watch?
--> Above 6295= Bullish, Under 6285= Bearish
Video Recaps -->https://www.tradingview.com/u/WallSt007/#published-charts

Mid-Session Market ReviewMid-Session Market Review
S&P 500: After some initial volatility from the 8:30 news, the market accepted above the prior day’s levels but has since pulled back within range, consolidating just below the highs.
NASDAQ: The NASDAQ remains above all of yesterday’s levels and is currently balancing between the high of the day and the 23,100 level, showing a rotational pattern.
Russell 2000: This market is rotational within the prior day’s range and has accepted below the CVA and PVA. Potential trade opportunities might come with a pullback to the 2,245 area.
Gold: Gold has accepted below the prior value area and is still rotational within the CVA. Trade opportunities could present themselves near the prior day’s low.
Crude Oil: The market is quite choppy, hovering around the prior day’s low and value area low. Caution is advised, with potential long opportunities on a pullback, as long as conditions align.
Euro Dollar: The Euro is dropping significantly, moving below all key levels without much respect for them. This could provide short opportunities if there’s a pullback.
Yen: Similar to the Euro, the Yen is also pushing below previous levels. It’s getting choppy near the CVA low, so caution is needed until it shows more respect for those levels.
Natural Gas: The market is rotational within the prior day’s range and respecting the CVA high. Long opportunities might be possible if conditions are right.
Aussie Dollar: It’s showing some respect for the CVA low and is still rotational. There could be a potential long setup forming, depending on how it plays out.
British Pound: The Pound has accepted below all key levels, and a pullback to the CVA low might provide short opportunities, though caution is needed around the VWAP.

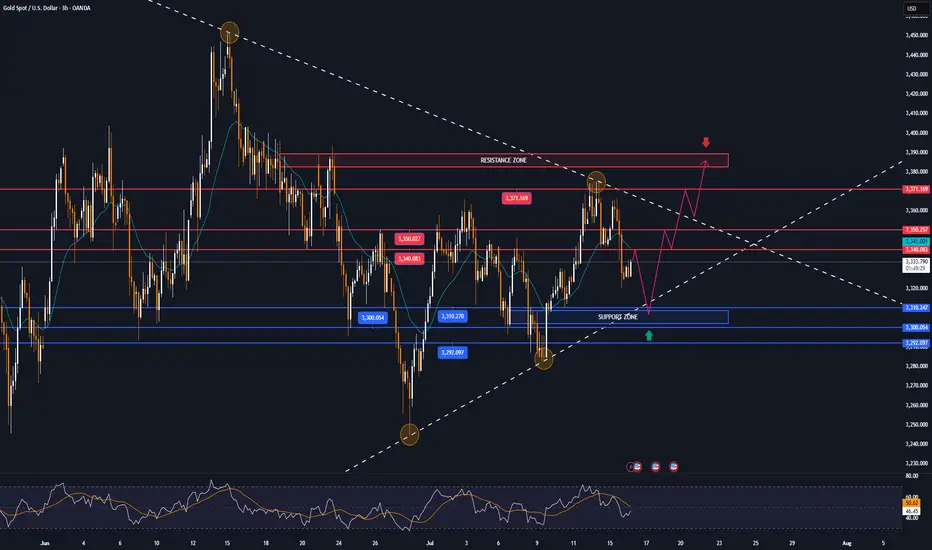
GOLD again targets $3,371, new bullish cycle conditionToday (Tuesday, July 15), in the Asian market, the spot OANDA:XAUUSD maintained a slight recovery trend, currently at around 3,360 USD/ounce.
The spot OANDA:XAUUSD rose to a 3-week high on Monday, but quickly fell back and finally closed lower. Trump's open attitude towards trade negotiations has improved the market's risk-on sentiment and negatively impacted gold, a safe-haven asset. But gold still has a lot of potential risks for price increases, and personally, the fundamental trend for gold has not changed.
The US Bureau of Labor Statistics will release its June Consumer Price Index (CPI) report today (Tuesday).
According to a Reuters survey, economists expect the US CPI to increase year-on-year in June to 2.7% from 2.4% the previous month, while the core CPI is expected to increase year-on-year to 3% from 2.8%.
The survey also showed that the US CPI is expected to increase 0.3% month-on-month in June, and the core CPI is also expected to increase 0.3% month-on-month.
According to the Chicago Mercantile Exchange's "FedWatch Tool", the market believes that the Fed is unlikely to cut interest rates in July and the probability of keeping interest rates unchanged in September is about 30%.
If the US core CPI rises by 0.4% or more in June, this could prompt market participants to reassess the possibility of a rate cut in September. In this case, the US Dollar could hold steady and push gold prices lower. On the other hand, if the data is lower than expected, gold will become more attractive while a weaker Dollar will be positive for gold prices.
Technical Outlook Analysis OANDA:XAUUSD
After gold reached the resistance target of attention to readers in the weekly publication at 3,371 USD, which is the location of the 0.236% Fibonacci retracement, it fell slightly but is now recovering positively.
Currently, gold is trading in the range of 3,360 USD, the price action above the lower edge of the long-term rising price channel with support from the EMA21, gold is now likely to continue to retest the 0.236% Fibonacci retracement level.
If gold breaks above $3,371 it will be eligible for a new bullish cycle, with the target then being around $3,400 in the short term, more so than $3,430.
On the other hand, the RSI is pointing up, maintaining activity above 50, and this should be considered a positive signal in terms of momentum. It shows that there is still a lot of room for growth ahead.
However, as of now, gold is still neutral in terms of trend, with conditions gradually tilting towards the possibility of price increase.
Along with that, the notable positions will be listed as follows.
Support: $3,350 – $3,340 – $3,310
Resistance: $3,371 – $3,400 – $3,430
SELL XAUUSD PRICE 3390 - 3388⚡️
↠↠ Stop Loss 3394
→Take Profit 1 3382
↨
→Take Profit 2 3376
BUY XAUUSD PRICE 3304 - 3306⚡️
↠↠ Stop Loss 3300
→Take Profit 1 3312
↨
→Take Profit 2 3318
End-of-Session Market ReviewToday was a solid trading day with some interesting moves across the markets:
S&P 500: The market trended upwards from the open, gradually moving into and above the prior day’s value area, closing near the high of that range.
NASDAQ 100: After some initial back-and-forth, it climbed above the prior day’s high and value area, showing strength into the close.
Russell 2000: This market was quite choppy and balanced for a good part of the session, but eventually pushed up to close near the prior value area high.
Gold: It stayed range-bound, moving between the CVA high and the prior day’s value area without breaking out.
Crude Oil: We saw a significant drop right from the start, with prices falling about 1.5 points and ending the day lower, though still within the prior day’s range.
Euro Dollar: It tested the CVA low, dipped below the prior day’s low, and then bounced back to close around that level.
Yen Dollar: It started near the prior value area low, accepted below it by midday, and remained balanced in that lower range.
Aussie Dollar: Initially, it held above the CVA area and tested a higher level before sharply dropping below the prior day’s low and then balancing in that lower area.
In total, I took eight trades today. Two of them were in the Yen, both valid setups that didn’t work out and ended in stop-outs. I also took some long trades in the Aussie Dollar that I probably could have avoided since the market was choppy.
On the positive side, I managed risk well and ended up with two winning trades that put me in the green by about $1,200. Overall, I’d rate today as an A- day. Moving forward, I’ll focus on staying out of choppy markets, paying attention to the developing value area, and possibly using Heikin Ashi bars for better clarity.

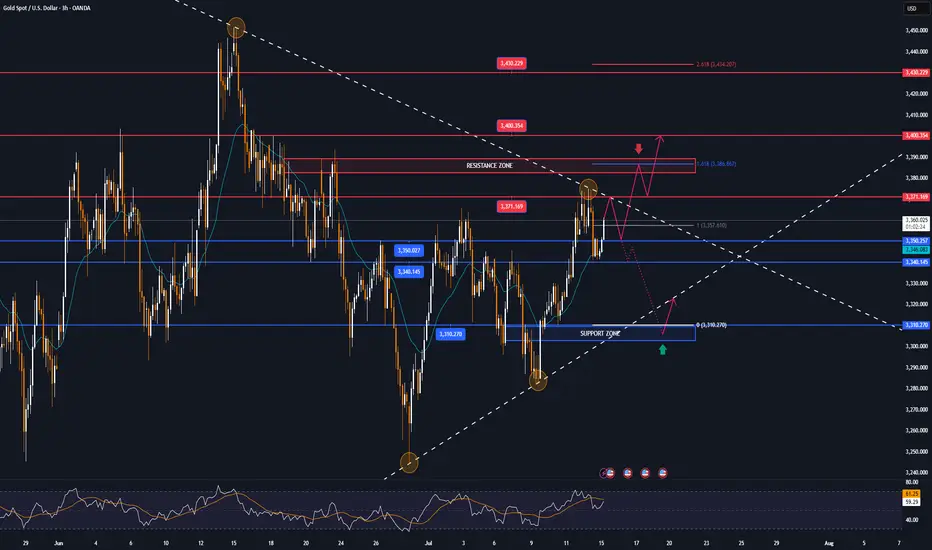
Back above $3,300, GOLD may remain neutral, tax focusOANDA:XAUUSD reclaimed the psychologically important level of $3,300/ounce last week, but while gold is still receiving some support as a safe haven amid economic and geopolitical risks, its upside momentum may be limited as the market shifts its attention to other commodities.
Gold prices ended last week on a generally bullish note, rising back above $3,300 an ounce after US President Trump unexpectedly announced a series of new trade policies. Spot gold prices rose about 0.5% last week on Friday.
Although the market initially doubted Trump’s self-imposed July 9 deadline, the overall market reaction remained steady and the renewed risk appetite helped the S&P 500 hit a new record high, somewhat undermining gold’s safe-haven appeal. The July deadline has been pushed back to August 1, but the global trade conflict is far from over. Gold has regained support after initial pressure after Trump announced a new trade policy on copper imports, along with a series of news stories about the relationship between Trump and the FED sent to readers throughout the past week.
A sharp rise in copper prices will also add to inflationary pressures, exacerbate economic uncertainty and raise concerns about recession and stagflation. In this context, gold is expected to continue to receive support from potential risks.
In addition to fierce competition in the commodity market, gold may remain fundamentally neutral in the short term, as economic data will support the Fed's neutral monetary policy. The key market focus next week will be the June Consumer Price Index (CPI). The Fed has made it clear that it is in no rush to raise interest rates while inflation risks remain high.
However, traders still need to be cautious and closely monitor the situation surrounding the tariff war initiated by Trump, which will directly affect the price of gold. In case of negative news, the gold price will receive support and vice versa if positive news appears in the market.
Over the weekend, US President Trump once again used the tariff tactic, announcing that he would impose a 30% tax on imports from the EU and Mexico, causing a strong reaction from the international community. This move not only casts a shadow over the relationship between Europe and the United States, as well as between the United States and Mexico, but also adds further uncertainty to the global trade model. EU politicians, businesses and academics were quick to respond, calling for unity to protect their interests, while Mexico stressed the need to maintain national sovereignty and pledged to respond calmly.
Technical Outlook Analysis OANDA:XAUUSD
On the daily chart, gold has a 3-day rally, and the upside momentum has reached the important target resistance at the 0.236% Fibonacci retracement level. Gold's upside momentum is also limited by this Fibonacci retracement level, specifically it has slightly dropped to $3,355/oz.
But overall, gold is still not in a position to form a specific trend, and the indicators and positions are mainly showing the possibility of continuing to accumulate sideways.
For gold to have the conditions for a new bullish cycle, it needs to bring price activity above the 0.236% Fibonacci retracement level, then the target will be around $3,400 in the short term, more than $3,430.
Meanwhile, a pullback, which sees gold sell below the 0.382% Fibonacci retracement, would open the door to a bearish cycle, with a target of around $3,246 in the short term, rather than the 0.50% Fibonacci retracement.
RSI hovering around 50 also suggests a hesitant market sentiment, so the short-term bias for gold is neutral.
Along with that, notable positions will also be listed as follows.
Support: $3,350 – $3,310 – $3,300
Resistance: $3,371 – $3,400 – $3,430
SELL XAUUSD PRICE 3406 - 3404⚡️
↠↠ Stop Loss 3410
→Take Profit 1 3398
↨
→Take Profit 2 3392
BUY XAUUSD PRICE 3340 - 3342⚡️
↠↠ Stop Loss 3336
→Take Profit 1 3348
↨
→Take Profit 2 3354
2025-07-14 - priceactiontds - daily update - nasdaqGood Evening and I hope you are well.
nasdaq e-mini futures
comment:
The biggest surprise for next week would be a huge gap down Sunday futures open and having that gap stay open. If bears could actually do something like that and trap all bulls who bought above 22600, that would be amazing.
Spoiler: Bears could not. Another gap down and bear trap. It’s sad but the reality. Don’t expect strong bears all of the sudden.
current market cycle: bull trend
key levels: 22000 - 23100
bull case: Bulls defended 22800 which is still as bullish as it gets. Don’t make it more complicated than it is. We are going sideways under the ath, can print a new one any given day. Since I don’t have any targets above 23100ish, I won’t make stuff up here. I only wait for the profit taking to begin to look for shorts.
Invalidation is below 22700.
bear case: Bears are sad. Need a daily close below 22700. If they prevent bulls from printing a new ath above 23111, I would be surprised. No need to write more here until we see much much bigger selling pressure.
Invalidation is above 23500.
short term: Neutral. Bears not doing enough and bulls going sideways under ath. No interest in buying, so I am neutral until big bears come around.
medium-long term - Update from 2024-06-29: No change in plans. I expect 20000 to get hit over the next 3 months and maybe 19000 again.
trade of the day: Long the double bottom above 22800 or the retest on US open around 22830. Bears failed to print consecutive good looking 30m/1h bear bars, so a reversal was the most likely outcome after the double bottom.
Mid-Session Market InsightsMid-Session Market Insights
In today's session, I'm closely monitoring eight different futures markets: S&P 500, NASDAQ 100, Russell 2000, Gold, Crude Oil, Euro Dollar, Yen Dollar, and Aussie Dollar.
S&P 500: We're seeing a rotational pattern within the prior day's value area and the CVA. I'm eyeing long opportunities from the prior value area low up to the high.
NASDAQ 100: The market is a bit choppy around the PVA and CVA highs, with a slight upward intraday trend. I'm staying cautious here.
Russell 2000: Also choppy, but we've got acceptance within the CVA. I'm looking for long opportunities from the CVA low, which aligns with the prior day's low.
Euro Dollar: I'm currently short from the CVA high, with the first target at the prior day's low. We've broken below the prior value area, so I'll trail this trade and see how it develops.
Yen Dollar: It’s been a bit of a mixed bag. I took a short below the CVA and prior day's low, got stopped out, but it was still a decent setup.
Aussie Dollar: I took some long positions that weren't the best setups, as it was quite choppy near the CVA high and prior day's low. Lesson learned for next time.
Crude Oil: I took a short from the CVA and PVA highs, hit my target at the low of those areas, and we’re currently hovering around that level.

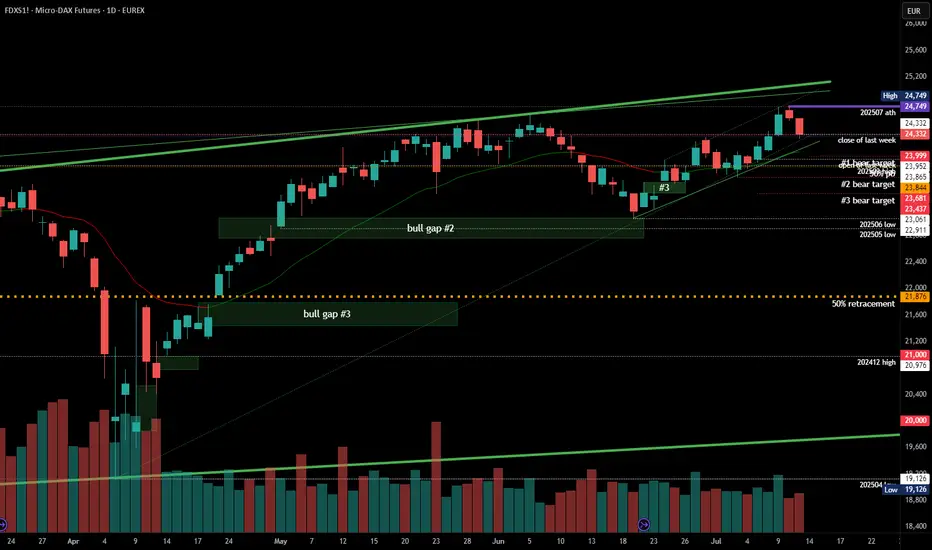
#202528 - priceactiontds - weekly update - daxGood Evening and I hope you are well.
comment: Third leg up is done and now it’s all about how long do we need for a lower low below 23680 again. For now I don’t know since we have another risk-off news but of them were bought the past 3 months, so I remain skeptical. Too early for shorts but I think longs near 24000 are likely good for a bounce to either retest 24749 or print a lower high.
current market cycle: bull wedge
key levels for next week: 23000 - 24800
bull case: Bulls want to continue sideways to up and trap all eager bears again who think that 30% tariffs between the US-EU are bad. Those poor souls. Markets can only go up.
Invalidation is below 23680
bear case: Bears need a lower low below 23680. That’s all there is to it. No idea how fast and if we get there but shorts before are most likely a gamble, since literally every dip since April has been bought and especially every Sunday Globex gap down became a giant trap. I do think 24749 is a perfect double top with the prior ath from June and we can go down from here but until we have a daily close below 23680, I am not eager to run into another bear trap.
Invalidation is above 24749
short term: Neutral. Tariff news are bad but they are not in-effect, so could be that we see another bear trap. I don’t know and I won’t pretend otherwise. Sitting on hands.
medium-long term from 2025-06-29: Bull surprise last week but my targets for the second half of 2025 remain the same. I still expect at least 21000 to get hit again this year. As of now, bulls are favored until we drop below 23000.
GOLD - GC | Weekly Recap & Plan 13.07.2025🟡 GOLD (GC) Weekly Recap & Outlook
Symbol: GC1!
Date: Week of July 8–12, 2025
Timeframes Used: 4H, Daily, Weekly, HTF structure
🔍 What Happened Last Week?
Gold saw a strong rejection from a confluence of two HTF trendlines, signaling resistance.
But that move was absorbed by:
🟦 Daily Demand (blue zone)
🔵 Daily Swing Liquidity (blue line)
This builds a bullish structure on the daily chart.
🧭 Scenarios I'm Watching
Scenario 1 — Minor Pullback:
🔹 Price may revisit the Daily Gap (pink line) and find support for continuation.
Scenario 2 — Deeper Pullback:
🟣 Price could retrace into the HTF bullish trendline (purple) before resuming upside.
🗞️ Bonus Macro Scenario: Powell Resignation?
There are growing rumors that Fed Chair Powell might resign this week.
📈 If that happens, I expect strong bullish momentum in Gold —
→ very limited retracement, and
→ potential straight breakout into new highs.
🎯 Targets for the Week:
✅ 1st Target:
W C DOL (purple line) → acts as a primary take profit area.
✅ 2nd Target (Expansion):
EQHs / DOL (extended purple levels)
Game Plan:
Watch for LTF confirmation on both retracement zones.
Maintain bullish bias unless Daily Demand fails.
If Powell resigns, be ready for breakout setups.

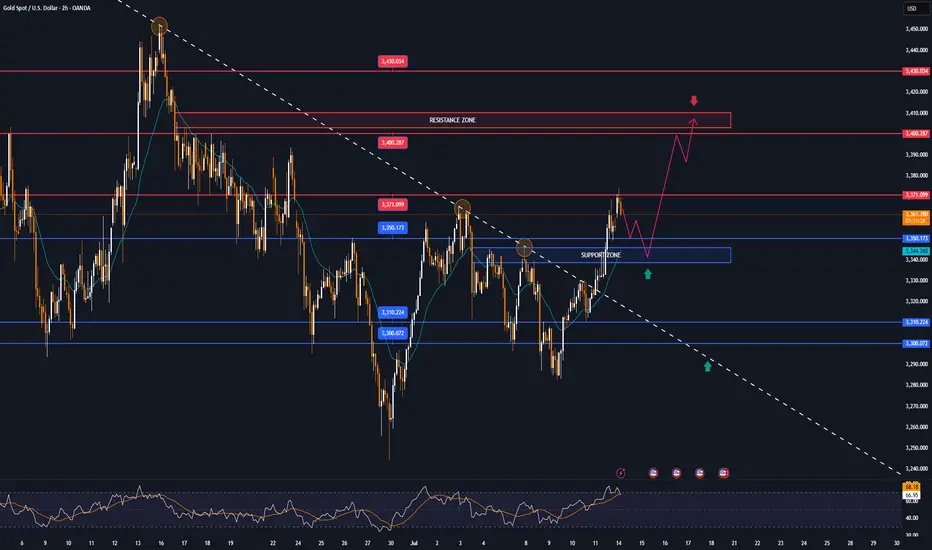
GOLD MARKET ANALYSIS AND COMMENTARY - [Jul 14 - Jul 18]This week, OANDA:XAUUSD opened at $3,342/oz, dropped to $3,282/oz, but then rebounded sharply to close at $3,355/oz. The recovery was mainly driven by former President Trump's announcement of new tariffs ranging from 20% to 50% on imports from 22 countries, effective August 1st. Particularly, a 35% tariff on Canadian goods — a key U.S. trading partner — raised concerns about global trade stability and supply chains.
Trump also proposed 15–20% tariffs on most other trading partners, reigniting fears of global trade disruptions. At the same time, ongoing conflict between Israel and Hamas continued to weigh on sentiment, despite U.S. diplomatic efforts showing little progress.
However, analysts note that gold still lacks strong momentum for a breakout. Trump's tariff threats may be more about negotiation leverage than triggering a full-blown trade war. Meanwhile, with the labor market recovering and inflation rising, the Fed is expected to maintain its neutral monetary policy, limiting short-term gold price movements.
Although geopolitical tensions remain (e.g., Russia-Ukraine, Israel-Hamas), the ceasefire between Israel and Iran has reduced gold’s geopolitical risk premium.
Looking ahead, key U.S. economic data next week — including CPI, PPI, and retail sales — will be closely watched. A strong June core CPI (0.4% or higher) could reduce the likelihood of a Fed rate cut in September, strengthening the USD and pushing gold lower. Conversely, weaker inflation data could boost expectations of a rate cut, supporting gold prices.
📌In terms of technical analysis, gold prices next week may continue to adjust and accumulate. Accordingly, if they surpass the 3,370 USD/oz mark, gold prices next week will challenge the 3,400-3,450 USD/oz range. On the contrary, gold prices next week will adjust down to 3,285 USD/oz, or even 3,245 USD/oz.
Notable technical levels are listed below.
Support: 3,350 – 3,310 – 3,300USD
Resistance: 3,371 – 3,400 – 3,430USD
SELL XAUUSD PRICE 3435 - 3433⚡️
↠↠ Stop Loss 3439
BUY XAUUSD PRICE 3329 - 3331⚡️
↠↠ Stop Loss 3326

#AIXBTUSDT #4h (ByBit) Descending trendline breakout$AIXBT just regained 100EMA support and looks ready for short-term recovery.
BYBIT:AIXBTUSDT.P aixbt.tech

GOLD continues to recover, tariff war changes unpredictablyInternational OANDA:XAUUSD continued to rise, boosted by a slight decline in the US Dollar and US Treasury yields. At the same time, investors are closely monitoring the developments in trade negotiations as US President Trump expands the tariff war.
As of the time of writing, spot OANDA:XAUUSD increased by 0.3% to 3,333 USD/oz. The general weakness of the US Dollar, the decline in US Treasury yields and renewed concerns about the escalation of the trade war have helped stabilize gold prices.
On Thursday evening (July 10) local time, US President Donald Trump once again increased pressure on trading partners. He announced that he would impose a 35% tariff on imported goods from Canada, and the USD/CAD exchange rate rose sharply in the short term.
Trump posted on his social media platform Truth Social that a 35% tariff would be imposed on imported goods from Canada, effective from August 1, 2025.
It is still unclear whether the current exemptions for goods traded under the United States-Mexico-Canada Agreement (USMCA) will be extended or terminated.
Due to the impact of escalating trade tensions, spot gold prices also rose by more than 10 dollars in the short term at the beginning of the Asian trading session on Friday, and the current high price of gold has reached around 3,336 USD/ounce.
In an interview with NBC News on Thursday, Trump said he was also considering imposing a flat tariff of 15% to 20% on most of his trading partners, adding that the exact tariff rate was being worked out. The current flat tariff rate is 10%.
Trump sent letters to trading partners this week, announcing that the new tariffs would take effect on August 1 if they could not negotiate more favorable terms. He is expected to send letters to European Union member states soon.
Trump sent the first batch of tariff letters to 14 countries, including Japan and South Korea, on July 7, with tariffs ranging from 25% to 40%. He also said he would send more similar letters this week.
Minutes from the Fed's June 17-18 meeting showed that only a "few" Fed officials thought a rate cut was possible as early as this month, while most preferred to hold off until later in the year due to inflation concerns caused by Trump's tariffs.
The Federal Open Market Committee (FOMC) voted unanimously to leave interest rates unchanged at its June meeting. The next policy meeting is scheduled for July 29-30.
Markets will focus on progress in Trump's tariff negotiations, key US economic data and speeches by Federal Reserve officials later in the day for fresh trading direction for gold prices.
Technical Outlook Analysis OANDA:XAUUSD
Gold has had 2 sessions of recovery from the area around the 0.382% Fibonacci retracement, but the temporary upside momentum is still limited and does not qualify for a new bullish cycle.
In the short term, the EMA21 with the 0.236% Fibonacci retracement will act as the nearest resistance, if gold takes the price action to break above the 0.236% Fibonacci retracement level it will qualify for a new bullish cycle with the target then being around $3,400 in the short term, more so than $3,430.
On the other hand, with the current neutral trend, once gold is sold below the 0.382% Fibonacci retracement level again, it will have conditions to decline, and the target then is around 3,246 USD in the short term, more than the 0.50% Fibonacci retracement level.
The RSI index is hovering around 50, also showing that the market sentiment is still hesitant to have a specific direction.
During the day, the sideways trend of gold prices will be noticed by the following positions.
Support: 3,300 - 3,292 USD
Resistance: 3,340 - 3,350 - 3,371 USD
SELL XAUUSD PRICE 3388 - 3386⚡️
↠↠ Stop Loss 3392
→Take Profit 1 3380
↨
→Take Profit 2 3372
BUY XAUUSD PRICE 3296 - 3298⚡️
↠↠ Stop Loss 3292
→Take Profit 1 3304
↨
→Take Profit 2 3310

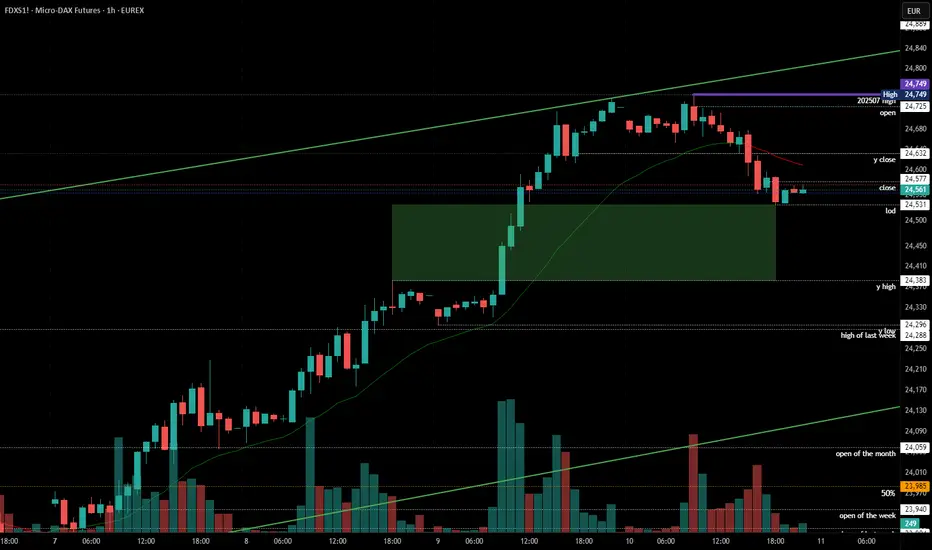
2025-07-10 - priceactiontds - daily update - dax
Good Evening and I hope you are well.
comment: 50% retracement of the last bull leg is pretty much exactly 24530 and low of the day was 24531. Could always be a coincidence eh. Bull gap still open to 24383, so do not look for shorts. I doubt we will go red into the weekend unless we get bad news. Technically we could pull back to the bull trend line 24200ish but I can not, for the life of me, see that happening tomorrow.
current market cycle: trading range - bull trend on the 1h tf
key levels: 24300 - 25000
bull case: Bulls want 25000 now. They are correcting sideways, which is as bullish as it gets. Even if bears close the gap to 24383, I would still expect another push for 24700+ with at least a lower high. Bulls remain in full control.
Invalidation is below 24270.
bear case: Bears likely not doing much but rather bulls taking profits. It was a slow grind lower on low volume. I would not expect follow-through selling tomorrow. Bears still have nothing until we see lower lows again.
Invalidation is above 25100.
short term: Neutral. Bulls remain in control but the spike phase is over and we are trading below the 1h ema, which means the trend is getting weaker. We could pull back further or stop at the 50% retracement and leave the gap open. No bigger interest in guessing what it’s gonna be, so I sit on hands.
medium-long term from 2025-06-29: Bull surprise last week but my targets for the second half of 2025 remain the same. I still expect at least 21000 to get hit again this year. As of now, bulls are favored until we drop below 23000
trade of the day: Tough to short this and hold tbh. Not really obvious today, so no trade of the day from me.
2025-07-09 - priceactiontds - daily update - nasdaqGood Evening and I hope you are well.
comment: Bears just need to do more. As long as we are not leaving behind bear gaps, bulls keep buying the dips. Wait for long pullbacks if we keep making higher lows. The bull channel is also still valid.
current market cycle: bull trend
key levels: 22700 - 23300
bull case: As long as Bulls stay comfortably above 22500, they are fine and sideways is a very bullish correction for them. Bears are certainly not doing much, so bulls buy every dip. Nothing changed. Might go up to 23300 or higher. No one knows where it will end but it’s likely orange face will end it and he will make sure he announces it in his private Epstein-and-Friends signal group in advance. Some put options 3-6m are fine to buy I think.
Invalidation is below 22700.
bear case: Bears are just not doing enough. Need something below 22700 and most likely an event to be the catalyst for it. I will leave it at that.
Invalidation is above 23500.
short term: Neutral until US-EU tariff shit show get’s a nice tweet or so. We will go down hard again. Be patient.
medium-long term - Update from 2024-06-29: No change in plans. I expect 20000 to get hit over the next 3 months and maybe 19000 again.
trade of the day: Long US open was a bit obvious but buying the huge drop was not.