Quick take o sugar futuresThe technical picture is starting to look quite interesting. Let's see if seasonality will kick in as well. Let's dig in.
MARKETSCOM:SUGAR
ICEUS:SB1!
Let us know what you think in the comments below.
Thank you.
75.2% of retail investor accounts lose money when trading CFDs with this provider. You should consider whether you understand how CFDs work and whether you can afford to take the high risk of losing your money. Past performance is not necessarily indicative of future results. The value of investments may fall as well as rise and the investor may not get back the amount initially invested. This content is not intended for nor applicable to residents of the UK. Cryptocurrency CFDs and spread bets are restricted in the UK for all retail clients.
Futures

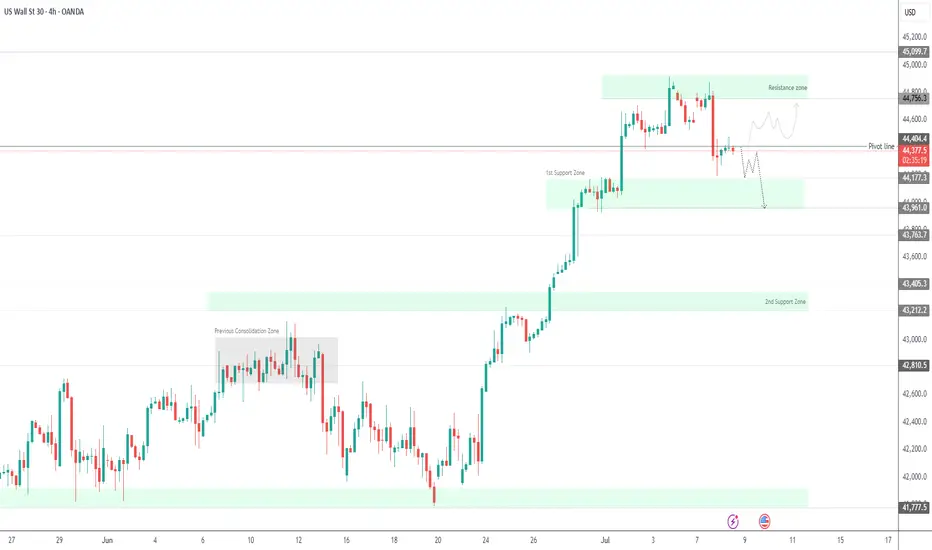
Dow Jones Below Key Pivot – Tariff Talks to Define Next MoveDow Jones – Overview
Fundamental Outlook:
In April, President Trump capped all so-called reciprocal tariffs at 10% until July 9, giving room for trade negotiations with key partners. That same month, the Nasdaq slipped into bear market territory, while the Dow and S&P 500 entered correction zones.
Since then, Wall Street has rebounded sharply. Last week, both the Nasdaq and S&P 500 surged to all-time highs, driven by a strong labor market that helped ease recession fears.
Technical Outlook:
Currently, Dow Jones is trading below the pivot level at 44410, which signals ongoing bearish momentum.
A sustained move below 44410 supports further downside toward 44180, with a break below this level opening the path to 43960.
However, if price reverses and closes above 44410 on the 1H or 4H timeframe, it may trigger a bullish move targeting 44750 and beyond.
Support: 44180 / 43960 / 43770
Resistance: 44515 / 44750 / 45100
Note:
Progress in tariff negotiations would likely support further upside in U.S. indices.
Lack of resolution may keep the Dow under bearish pressure in the short term.
CRUDE OIL (WTI): Will It Rise More?
Quick update for my yesterday's analysis for WTI Crude Oil.
As I predicted yesterday, the price went up to the target.
We got one more strong bullish confirmation after a New York
session opening:
the price violated a resistance of a horizontal range on a 4H time frame.
I think that the market may rise even more and reach 69.25 level.
❤️Please, support my work with like, thank you!❤️

GOLD is in bearish conditions, pressured by aggressive tariffsOn Wednesday (July 9) in the Asian market, the spot OANDA:XAUUSD suddenly fell sharply in the short term, and the gold price just fell below 3,290 USD / ounce.
Although US President Trump announced that the first tariff letters had been sent to some US trading partners, the gold price fell below 3,290 USD / ounce due to the weakening demand for safe-haven gold. Trump postponed the tariff deadline to August 1, easing trade tensions.
The recovery in the dollar TVC:DXY and rising US Treasury yields also weighed on gold, sending prices sharply lower after hitting a high of $3,345 an ounce.
The yield on the 10-year US Treasury note TVC:US10Y rose to its highest in more than two weeks, making gold, which does not pay interest, less attractive as an investment.
The yield on the 10-year US Treasury note rose to 4.415%. The US real yield also rose 4 basis points to 2.073%.
TVC:DXY , which tracks the greenback's performance against a basket of currencies, rose 0.20% to 97.70. The rise in the Dollar Index means that gold priced in dollars has become less attractive because they are inversely correlated.
Japan and South Korea said on Tuesday they would try to speed up trade talks with the United States in a bid to soften President Donald Trump's stance on new tariffs set to take effect on August 1.
But optimism about a trade deal boosted market risk appetite, limiting gold's upside.
Traders are awaiting the release of the minutes of the Federal Reserve's latest meeting on Wednesday, followed by data on initial jobless claims for the week ended July 5.
Investors now expect the Fed to cut interest rates by 50 basis points before the end of the year, starting in October.
Technical Outlook Analysis OANDA:XAUUSD
On the daily chart, gold fell below the 3,300USD whole price point and the 0.382% Fibonacci retracement level, which are the initial conditions for gold prices to have a prospect for a bearish trend.
Currently, with the position below 3,300USD, gold may continue to decline with the next target around 3,246USD in the short term, more than the 0.50% Fibonacci retracement level.
The current resistances of gold prices are the pressure from the EMA21 line, followed by the 0.236% Fibonacci retracement. These are also the resistance positions that readers paid attention to in the previous issue.
In addition, the RSI is pointing down from 50, currently 50 is considered the nearest resistance and the fact that the RSI is pointing down is quite far from the oversold zone, indicating that there is still room for a decline ahead.
During the day, although the trend is not yet completely clear, gold is showing conditions that are more inclined towards a decline, along with that, the notable positions will be listed as follows.
Support: 3,292 - 3,246 USD
Resistance: 3,300 - 3,340 - 3,350 USD
SELL XAUUSD PRICE 3346 - 3344⚡️
↠↠ Stop Loss 3350
→Take Profit 1 3338
↨
→Take Profit 2 3332
BUY XAUUSD PRICE 3245 - 3247⚡️
↠↠ Stop Loss 3241
→Take Profit 1 3253
↨
→Take Profit 2 3259

Trump "stirred up" GOLD recovery but limited by USD appreciationSpot CAPITALCOM:GOLD has rebounded strongly from yesterday's lows, currently trading around $3,333/oz. The main reason is that US President Trump announced a 25% tariff on Japan and South Korea starting August 1, which boosted safe-haven demand. However, the strengthening US Dollar has also limited the broader recovery in gold prices.
On Monday local time, US President Trump sent letters to 14 countries including Japan, South Korea and South Africa threatening to impose tariffs. He then signed an executive order to extend the suspension of "reciprocal tariffs" until August 1.
Trump announced that he would impose a 25% tariff on imports from Japan and South Korea, effective August 1. In a letter to the leaders of Japan and South Korea, Trump said the tariffs would be imposed on August 1 because the two countries' trade relationship with the United States is "very unfair".
This is his first letter to major trading partners ahead of the July 9 deadline to reach a trade deal.
Trump said that despite the large trade deficits between the United States and South Korea and Japan, the United States has decided to continue to cooperate with the two countries. However, the United States has decided to move forward on the premise of more balanced and fair trade. Trump said that the trade deficit has posed a major threat to the US economy and even national security, so changes are needed. Starting August 1, 2025, the United States will impose a 25% tariff on all products from South Korea and Japan, regardless of the different tariffs by industry.
Additionally, any attempt to circumvent tariffs by shipping through a third country will also be subject to higher tariffs.
Trump said companies that choose to build factories or manufacture products in the United States will not have to pay the tariffs. Additionally, if South Korea and Japan decide to increase tariffs on the United States, the United States will impose additional tariffs of the same size on top of the current 25% tariff.
Official data released by the People's Bank of China on Monday showed that China's central bank increased its gold reserves in June, marking the eighth consecutive month of increase.
Bank of America said that central banks around the world are buying gold to diversify their foreign exchange reserves, thereby reducing their dependence on the US dollar and protecting against inflation and economic instability, and the trend is expected to continue.
Technical Outlook Analysis CAPITALCOM:GOLD
On the daily chart, gold has recovered from a key technical confluence area, which is the closest support area to note for readers in the weekly publication. The area from $3,292 – $3,300 is the confluence of the 0.382% Fibonacci retracement with the lower edge of the long-term rising price channel. However, the temporary recovery is being limited by the EMA21, the current closest resistance, followed by the 0.236% Fibonacci retracement level.
The recovery momentum is significant, but for gold to have enough technical bullish conditions, it needs to take price action above the EMA21, with a bullish breakout of the 0.236% Fibonacci retracement level then the prospect of a new bullish cycle will be opened.
If gold breaks above the 0.236% Fibonacci retracement level it will have the next target at the raw price point of $3,400 followed by horizontal resistance at $3,430.
During the day, the current gold price should still be assessed as a sideways accumulation trend, when the Relative Strength Index RSI sticks around 50, showing the market's hesitant sentiment.
A strong enough fundamental impact to change the structure will give a more specific technical trend in the coming time, and the notable positions will be listed as follows.
Support: 3,300 - 3,292 USD
Resistance: 3,350 - 3,371 - 3,400 USD
SELL XAUUSD PRICE 3366 - 3364⚡️
↠↠ Stop Loss 3370
→Take Profit 1 3358
↨
→Take Profit 2 3352
BUY XAUUSD PRICE 3294 - 3296⚡️
↠↠ Stop Loss 3290
→Take Profit 1 3302
↨
→Take Profit 2 3308

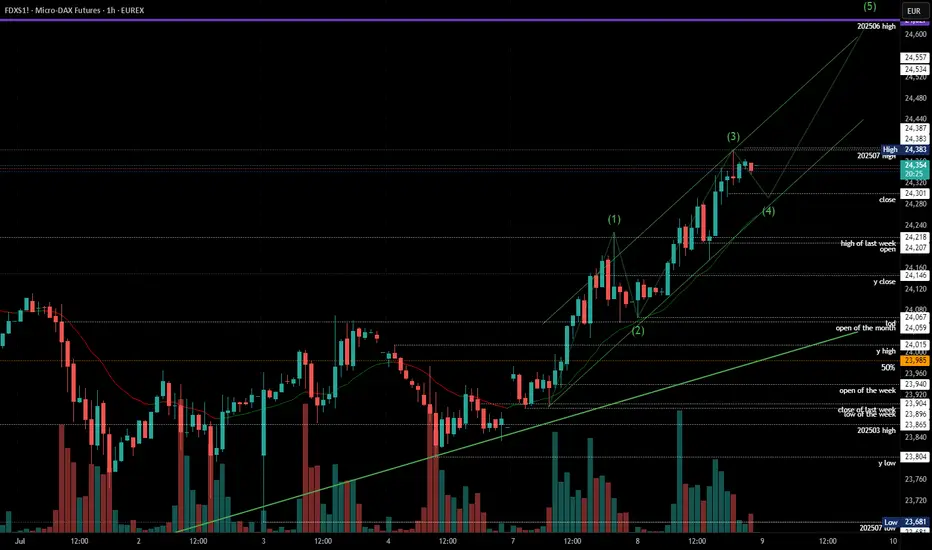
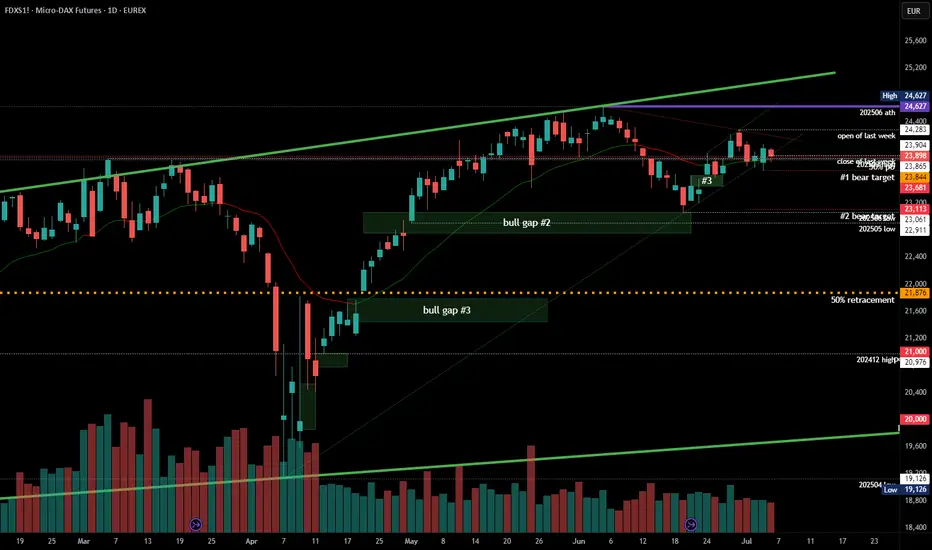
2025-07-08 - priceactiontds - daily update - daxGood Evening and I hope you are well.
comment: Not many times a month where the chart is as clear as this one. Every pattern can fail but you have to take these setups because they work more than they fail. Market is clearly refusing to go down, so don’t try to short it yet.
current market cycle: trading range - bull trend on the 1h tf
key levels: 23600 - 24700
bull case: Bulls want a retest of 24500+ and today they got a clear breakout above the prior high and stayed there. They have all the arguments on their side to test the ath. Only thing they could stop this is a news event.
Invalidation is below 23860.
bear case: Bears kinda gave up. Channel is tight and looking for shorts in these channels is not a good strategy. Above 24400 bears have to cover again since the obvious target is 24500+. Bears basically have nothing here. No matter what you think of we where should trade.
Invalidation is above 24400.
short term: Can only be bullish. Any long has stop 24170
medium-long term from 2025-06-29: Bull surprise last week but my targets for the second half of 2025 remain the same. I still expect at least 21000 to get hit again this year. As of now, bulls are favored until we drop below 23000
trade of the day: Buying any pullback was good. Most obvious one was the double bottom on EU open, right at the 1h 20ema.
US tariff deadline, GOLD expected to fluctuate very stronglyInvestors will be keeping an eye on tariff news from Washington this week as the temporary suspension of punitive import duties is set to expire. If trade tensions do not escalate further after Wednesday’s deadline, that could be good for the market, while downside risks are also a negative for OANDA:XAUUSD in particular.
News Around US Tariffs
To avoid higher tariffs, negotiators from more than a dozen major US trading partners are racing against time to negotiate with the Trump administration, trying to reach a deal before July 9. Trump and his team have continued to apply pressure in recent days.
Trump announced a deal with Vietnam to lower the 20% tariffs he had promised on many Vietnamese exports, while talks with Japan, the United States’ most important ally in Asia and sixth-largest trading partner, appeared to be stalled, even as Washington hinted it was close to a deal with India.
In data
Nonfarm payrolls data released Thursday showed the U.S. added 147,000 jobs in June, beating market expectations, and the unemployment rate fell to 4.1%.
Despite the slowdown in private-sector hiring, the overall strong report prompted markets to lower expectations for a Federal Reserve rate cut in July.
According to the CME FedWatch Tool, the probability of a rate cut has dropped sharply from 24% to 4.7%. Fed Chairman Powell reiterated that the central bank will not ease its stance until there are more signs of cooling in employment and inflation.
Personal Comments
The market is following a number of factors:
On the one hand, there is a countdown to Trump's "final blow" on tariffs, and on the other hand, the non-farm data has poured cold water once again. As the Fed's stance fluctuates, the US Dollar faces a tug-of-war between long and short positions, while gold continues to stabilize technically or has had significant price increases. July 9 of this month could be a key moment to really test the sustainability of gold in this recovery.
Technical Outlook Analysis OANDA:XAUUSD
Gold has recovered significantly over the past week, since finding support from the $3,250 area, but the temporary recovery is still limited by the EMA21 followed by the 0.236% Fibonacci retracement level.
However, sustained price action above the $3,300 raw price point should be viewed as a positive signal as it helps gold stabilize within the price channel.
If gold rises and breaks above the 0.236% Fibonacci retracement level, it will be eligible to continue rising with a short-term target of around $3,400 rather than a horizontal resistance of $3,430.
The indecision sentiment is shown by the RSI activity, which is mostly moving around the 50 level. RSI above 50 is considered a positive signal, while RSI below 50 is considered a negative signal, but gold is currently in the middle of this point.
Overall, gold has not yet had a short-term trend, but in the long-term, gold prices are still in an upward trend, which is noted by the price channel.
Finally, the notable positions will be listed as follows.
Support: 3,300 – 3,292 – 3,250USD
Resistance: 3,350 – 3,371 – 3,400USD
SELL XAUUSD PRICE 3334 - 3332⚡️
↠↠ Stop Loss 3338
→Take Profit 1 3326
↨
→Take Profit 2 3320
BUY XAUUSD PRICE 3275 - 3277⚡️
↠↠ Stop Loss 3271
→Take Profit 1 3283
↨
→Take Profit 2 3289

WTI CRUDE OIL (USOIL): More Growth Ahead
Crude Oil broke and closed above a significant resistance.
The price is now retesting that.
I think that the market is going to rise.
Next resistance - 68.5
❤️Please, support my work with like, thank you!❤️

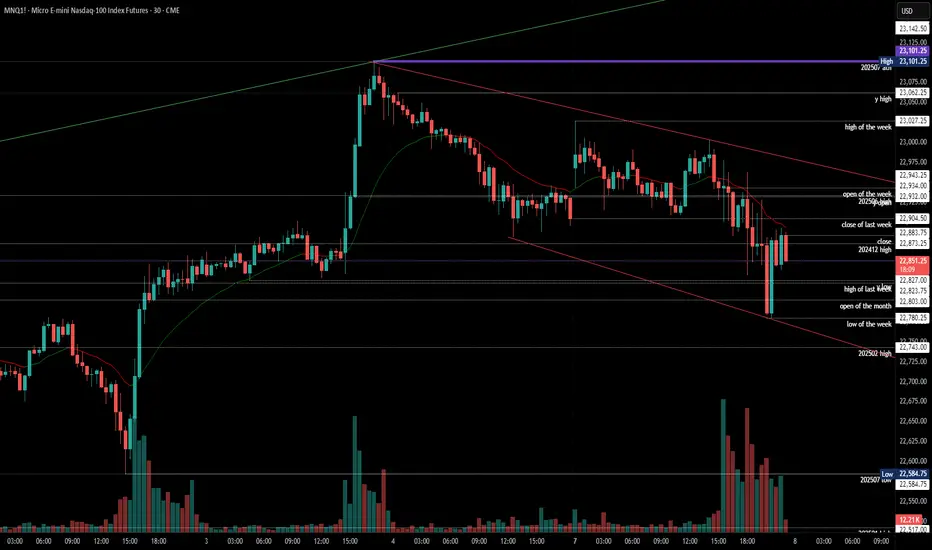
2025-07-07 - priceactiontds - daily update - nasdaqGood Evening and I hope you are well.
comment: Market is ignoring every risk under the sun because the US government is too incompetent to follow-through with their excrement show. Beyond me that we are staying up high. Got no better comment for you today.
current market cycle: bull trend
key levels: 22500 - 23100
bull case: As long as bulls stay comfortably above 22500, they are fine and sideways is a very bullish correction for them. Bears are certainly not doing much, so bulls buy every dip and the chances of a new ath are there since we are very close to it.
Invalidation is below 22500.
bear case: Bears are just not doing enough. Markets have every reason to sell hard but they don’t. Unless we see big 1h bear bars closing on their low with follow-through selling, we can not expect lower prices. We need gaps but all bears get are huge reversal bars. Below 22500 things would look better for them but for now it’s very unlikely. It’s certainly a start that we closed a 4h bar below the 4h 20ema and below last week’s close but unless we make lower lows, it does not mean much.
Invalidation is above 23100.
short term: Neutral.
medium-long term - Update from 2024-06-29: No change in plans. I expect 20000 to get hit over the next 3 months and maybe 19000 again.
trade of the day: Scalping both sides since we had many alternating bars and prominent tails.
CRUDE OIL (WTI): Move Up Ahead!
Last week, I already shared a bullish setup on WTI Crude Oil
on a daily time frame.
I see a strong intraday bullish confirmation today.
After a test of an underlined blue support area,
the price went up strongly and violated a resistance line
of a bullish flag pattern on a 4H time frame.
The market is going to rise more.
Goal - 68.2
❤️Please, support my work with like, thank you!❤️
I am part of Trade Nation's Influencer program and receive a monthly fee for using their TradingView charts in my analysis.

XAUUSD 4Hour TF - July 6th, 2025XAUUSD 7/6/2025
XAUUSD 4 hour Long Idea
Monthly - Bullish
Weekly - Bullish
Daily - Bullish
4hour - Bullish
Back to bullish here on Gold but that comes as no surprise when you look at the higher timeframe trends.
I’m mainly considering long scenarios for the week ahead but let's take a look at two for the week ahead:
4hour bearish continuation - Currently we can see price action broke above 3,320.00 resistance and is currently looking to find some footing. We’re keeping an eye out for higher lows at or near this level to then consider long scenarios. 3,395.000 seems like a good target but gold has potential to go higher.
4hour trend reversal - If we are to consider short positions on gold we would need to see a break back below our 3,320.000 zone. Look for confirmed lower highs below 3,320.000 and target lower key support levels if this happens.

EURJPY 4Hour TF - July 6th, 2025EURJPY 7/6/2025
EURJPY 4hour Bullish Idea
Monthly - Bullish
Weekly - Bullish
Daily - Bullish
4hour - Bullish
EJ is doing it’s thing and sticking with it’s bullish trend for now. The only conflicting signal is this major monthly zone around the 171.000 area so we will have to be careful.
Let’s keep a look out for two potential scenarios going into this week:
Bullish Continuation - We just saw a break above the 169.750 4hour zone which is fairly significant and it is signaling new support for this currently forming higher low, which is great. From here we’re looking for this bullish trend to continue, look for strong bullish conviction coming off this 169.750 zone and look to target higher.
Trend Reversal - This is a possibility with our 171.000 looming overhead. If we start to see bearish rejection look for a lower high below 169.750 and look to target lower toward key support levels.

USDJPY Daily TF - July 6th, 2025USDJPY 7/6/2025
USDJPY Daily Neutral Idea
Monthly - Bullish
Weekly - Bearish
Daily - Bearish
We’re still on the daily timeframe with UJ as there is nothing worthwhile. We are clearly in some daily consolidation phase and price action has no clear direction from a swing perspective.
Bearish Continuation - For us to consider a bearish continuation, which is the most likely, we would like to see a retest of our 147.500 zone followed by strong bearish rejection. If we can spot rejection around the 147.500 zone it could present some decent short positions. I’d be looking to target lower toward key support levels.
Aside from this potential setup i’m not looking at any other scenarios for UJ.

AUDJPY 4Hour TF - July 6th, 2025AUDJPY 7/6/2025
AUDJPY 4hour Neutral Idea
Monthly - Bullish
Weekly - Bearish
Dailly - Bearish
4hour - Ranging
We’re getting some mixed signals here on AJ so i’ll keep this as a neutral idea as we need more info from price action. Most of the major trends seem bearish but the 4hour trend seems to have some bullish pressure. Let’s see how this could play out this week:
Bullish Breakout - We already saw a pretty significant bullish attempt to break out of this range around 94.500. If we can spot some bullish conviction, now that we're retesting what seems to be a broken range, then we can confirm a bullish 4hour trend and prepare for potential long scenarios. I’ll be looking higher toward key resistance around 96.500 if this happens.
Bearish Breakout - For us to consider comfortable bearish scenarios, we would need to see price action fall back through our 94.500 zone and form a lower high. If we see structure formed below 94.500 we can begin targeting lower for potential short positions. Look toward key support levels as targets.

AUDUSD 4hour TF - July 6th, 2025AUDUSD 7/6/2025
AUDUSD 4hour Neutral idea
Monthly - Bearish
Weekly - Bearish
Dailly - Bullish
4hour - Ranging
We are still technically bullish overall but we can see here on the 4hour that AU is ranging between 0.65800 & 0.65500. This is a fairly small range so we’re not that interested in taking trades while price action is bouncing between these two zones.
We’re looking for conviction above 0.65800 or below 0.65500 before we can comfortably make a move. Let’s see what both of those situations would look like:
Bullish Continuation - Most of the trend data is suggesting AU is still bullish but we would need to see a strong push above resistance around 0.65800 with a confirmed higher low above before getting into any trades. If we do see this play out I'm looking toward 0.66750 resistance as a target.
Reversal back into channel - Price action seems to be poking out of the bottom of this range but we are still not convinced just yet. For us to strongly consider this a bearish move we would like to see a retest of 0.65500 as resistance followed by bearish conviction. Look for price action to move lower toward key support areas if this happens.

DXY 4Hour TF - July 6th, 2025DXY 7/6/2025
DXY 4hour Bearish Idea
Monthly - Bearish
Weekly - Bearish
Dailly - Bearish
4hour - Bearish
All timeframes are suggesting we are sitll very much bearish. Going into this week we can spot two scenarios that will consider DXY either bullish or bearish.
Bearish Continuation - Ideally we can see price action stay below our 97.500 resistance zone which is also our 38.2% fib level. Look for price action to reject 97.500 with strong bearish conviction. This will most likely confirm a bearish dollar for the week ahead. Keep in mind, price action can push up to the 98.000 zone and still remain bearish.
Reversal - This is the less likely move for the week ahead but not impossible. For us to consider DXY bullish again on the 4hour timeframe we would need to see price action push above our 98.000 resistance area with a confirmed higher low above. Look for strong bullish rejection above & off of 98.000 acting as support. This is the first step for DXY in becoming bullish again.

GOLD MARKET ANALYSIS AND COMMENTARY - [Jul 07 - Jul 11]OANDA:XAUUSD opened the week at $3,246/oz due to low summer liquidity, easing recession fears and easing geopolitical tensions. However, they later recovered to $3,365/oz due to concerns about a possible re-escalation of the trade war, as some countries faced obstacles in negotiations with the US ahead of the July 9 tariff delay deadline. By the end of the week, prices had adjusted to $3,311/oz and closed at $3,335/oz.
In addition, the US Senate has passed the OBBBA tax cut and spending bill proposed by President Donald Trump. While it helps prevent the risk of a short-term default, the bill could increase the US public debt by more than $3,000 billion over the next 10 years, putting pressure on the bond market and raising concerns about the increasing supply of government bonds while demand is weakening.
However, US economic data over the weekend put downward pressure on gold. Specifically, the June employment report showed that the number of non-farm jobs (NFP) reached 147,000, exceeding the forecast of 111,000. The unemployment rate fell to 4.1%, lower than the expected 4.3%. At the same time, NFP data for April and May were also adjusted up to 158,000 and 144,000 jobs, respectively.
These positive numbers almost erased the expectation that the FED would cut interest rates in July. The FED also reaffirmed its stance on maintaining the current policy due to rising inflationary pressures.
Overall, gold prices are still stuck in a range, and a clearer prospect of interest rate cuts from the FED is needed to make a strong breakthrough in the near future.
📌Technically, the $3,310/oz level is now acting as an important support zone for gold prices next week. If this level is broken, prices may continue to fall further to the $3,245/oz area or even lower.
On the other hand, the $3,365/oz level is a strong resistance. If gold prices break through this area, there is a high possibility that they will approach the $3,400/oz mark. However, the upward momentum may be restrained afterwards due to profit-taking pressure from investors, especially when the US-China trade negotiations are still ongoing and have not reached a final agreement. Investors tend to be cautious, waiting for clearer signals before opening new positions.
Notable technical levels are listed below.
Support: 3,300 – 3,292 – 3,250USD
Resistance: 3,350 – 3,371 – 3,400USD
SELL XAUUSD PRICE 3401 - 3399⚡️
↠↠ Stop Loss 3405
BUY XAUUSD PRICE 3294 - 3296⚡️
↠↠ Stop Loss 3290

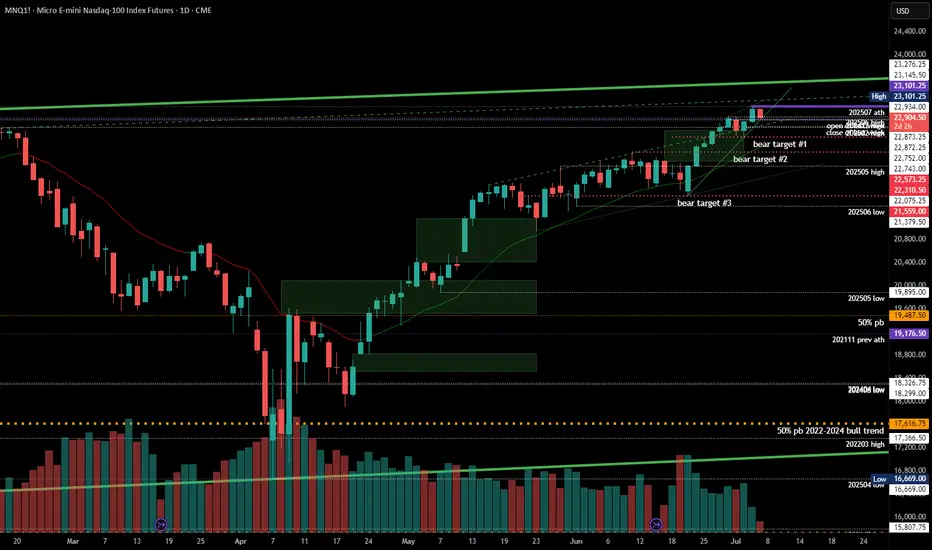
#202527 - priceactiontds - weekly update - nasdaq
Good Day and I hope you are well.
comment: Neutral. Chart is still max bullish but I have no more targets above and I’m fine with this going without me. Below 22600 I will start looking for lower targets. Until then best bears can get is sideways around 23000 but we will get a big move Monday/Tuesday once we have an answer on the US-EU tariff shit show. A good start for the bears is any price below 22584.
current market cycle: resumption of the bull trend but likely the final flag and we most likely will top out here around/under 23000
key levels for next week: 22000 - 23000
bull case: Bulls obviously still in full control. 2 bear bars out of the past 9 is a strong bull trend. Until we see much bigger selling pressure, technically we can only expect higher prices. Bulls broke above the bull channel from 21000 late may and confirmed the breakout now. The issues against the bulls are also the same arguments as for them. It’s overbought, climactic and very very late in the trend. This strong selling this late is something that usually happens before we turn,
Invalidation is below 22600
bear case: Just to make this clear again, bears have nothing right now. This chart is as bullish as it gets, that is why you can not look to short this yet. With that disclaimer, I also think it’s a bad buy. We are beyond overbought on many many economic indicators worsening and this trend is trying to accelerate. This is the time where weak/late bulls come around with the “this time it’s different” and "valuations don’t matter. We will again sell off big time this year but it’s stupid to trying to pick the top here.
Invalidation is above 23200 (any number I write here is stupid because it’s top picking. It could easily go to 23500 given the strength of this move)
short term: Neutral. No interest in buying but too early for shorts. Let’s see what the US-EU trade “talks” bring next week.
medium-long term - Update from 2024-06-29: No change in plans. I expect 20000 to get hit over the next 3 months and maybe 19000 again.
#202527 - priceactiontds - weekly update - daxGood Day and I hope you are well.
comment: Neutral. Clear triangle on the daily chart and mid point is 23850. Week closed at 23900. Market is in balance and I think it’s completely 50/50 for both sides where the breakout will happen. Given the tariff shit show, I would wait for it to happen and be flat until then. If they apply 10%+ tariffs on EU imports, we go down, if they postpone, we rally further. I trade only technicals but this is one of the few moments per year where news will completely determine where the markets will breakout out next.
Big if. If orange face does another TACO move, momentum is strong enough for markets to keep going and squeeze further. We need a very strong daily bear bar to kill it.
current market cycle: trading range - triangle
key levels for next week: 23500 - 24300 (above 24300, 500 comes into play and also likely 600+)
bull case: Bulls made a higher low but barely. This is a bad looking bull trend from the 23061 low and market is currently in breakout mode to decide where we go next. The 24283 high is a reasonable high to turn lower but as longs as bulls stay above 23600, there is a chance of this doing another try at 23300 and above the ugly bull channel is confirmed and higher prices are likely.
Invalidation is below 23500
bear case: Bears keeping it below 24000 is good but they are not doing enough or we would have made lower lows below 23600. Everything depends on the US-EU tariffs over the next days. Technically all bullish targets are met and the 24283 was high enough to qualify as a re-test. Market is free to go down again, it just needs a catalyst.
Invalidation is above 24300
short term: Neutral. I won’t gamble on the trade talk outcome but I am much more eager to sell this on bad news than to buy it on not-too-bad news.
medium-long term from 2025-06-29: Bull surprise last week but my targets for the second half of 2025 remain the same. I still expect at least 21000 to get hit again this year. As of now, bulls are favored until we drop below 23000.
BTC - Zoomed Out ScenarioAs predicted DXY has broken down a major monthly bearish trendline - currently finishing a bearish retest before further free fall.
If this plays out we have 2-3 years of a weakening / correcting dollar, and a strengthening investment in assets such as Bitcoin.
This means an extended bull market spanning 2-4 years on Bitcoin and equities.
However - there is a mass amount of liquidity to the uber lows towards 10,000 on BTC.
Market is showing manipulated intention to hit these lows by keeping the price below this bearish cross section - and that’s why bitcoin hasn’t been moving up yet.
This tells me this is more likely than we all think to play out.
I’m trading the following:
Short - 108,200 to 35,000
Long - 35,000 to 80,000
Short - 80,000 to 10,000
Will update accordingly if the plan changes.
Happy trading.

2025-07-03 - priceactiontds - daily update - daxGood Evening and I hope you are well.
comment: On my weekly chart I think this W4 was too deep to be part of a strong bull trend. 24000 is a decent spot to go sideways rather than up but above 24100 means I’m likely wrong and bears could give up for 24500+. I would not look for shorts until we see better selling pressure again. The Globex spike from 23681 to 23963 was beyond weird. It’s a bull wedge but will likely break out sideways in Globex session. 50/50 for both sides I think.
current market cycle: unclear. bull trend could continue but trading range is most likely
key levels: 23600 - 24500
bull case: Bulls want a retest of 24500+ but they find no buyers around 24000. They tried so many times to print 24000 and today they finally did it again but they would need to stay above 23900 and go sideways until bears give up. Markets can poke at a price long enough until one sides gives up.
Invalidation is below 23860.
bear case: Bears need lower lows again and if they can get below 23860, many bulls could cover in fear of a bigger pullback down to 23700. As of now bears have zero arguments since we only made higher lows since Globex low but we are also barely making higher highs and if we do, they have tails above.
Invalidation is above 24100.
short term: Completely neutral. Can go both way. US markets are overbought and once the profit taking starts, Dax won’t hold up either. Not much interest in guessing which way we go from 24000. Best to sit on hands and wait for a clear and strong signal.
medium-long term from 2025-06-29: Bull surprise last week but my targets for the second half of 2025 remain the same. I still expect at least 21000 to get hit again this year. As of now, bulls are favored until we drop below 23000
trade of the day: Longs since the giant Globex bull spike but had to have wide stops and scale in. Not an easy day.

US30 Awaits NFP – Bullish Above 44,410, Volatility Expected US30 (Dow Jones) – NFP Volatility in Focus
Today’s session is expected to be volatile due to the upcoming NFP report. Based on current forecasts, the outlook remains broadly positive for U.S. indices, though intraday swings are likely.
Technical Outlook:
As long as the price holds above 44,410, the bullish momentum remains intact, with potential upside targets at 44,750 and 44,910
A pullback toward 44,410 remains possible before any continuation higher.
However, a confirmed 4H close below 44,400 would shift the short-term structure to bearish, opening the door toward the 1st support zone around 44,180.
Key Levels:
• Resistance: 44,750 / 44,910 / 45,090
• Support: 44,410 / 44,180 / 43,970
Stay cautious — volatility is expected to spike around the release of the jobs data.

USDJPY; Heikin Ashi Trade IdeaOANDA:USDJPY
In this video, I’ll be sharing my analysis of USDJPY, using FXAN's proprietary algo indicators with my unique Heikin Ashi strategy. I’ll walk you through the reasoning behind my trade setup and highlight key areas where I’m anticipating potential opportunities.
I’m always happy to receive any feedback.
Like, share and comment! ❤️
Thank you for watching my videos! 🙏
