GOLD MARKET ANALYSIS AND COMMENTARY - [Nov 11 - Nov 15]Last week, after opening at 2,738 USD/oz, gold prices increased slightly to 2,749 USD/oz, but then dropped sharply to 2,643 USD/oz after Donald Trump announced his re-election as President. America. In the next trading session, gold price recovered to 2,710 USD/oz when the FED announced to continue cutting interest rates by 0.25%. However, the recovery momentum of gold prices was not sustainable, gold prices quickly dropped to 2,680 USD/oz and closed this week at 2,684 USD/oz.
The reason why Donald Trump's re-election as US President caused gold prices to plummet is because: First, investors expect that Mr. Trump will be able to intervene soon to end the war between Russia and Ukraine, the conflict in the Middle East, tension on the Korean peninsula,... Because during his first term, Mr. Trump almost did not let any fierce fighting occur. This will reduce the haven role of gold in the eyes of investors.
Second, during the election campaign, Mr. Trump pledged to impose a 60% tax on goods imported from China and impose a 20% tax on goods imported from other countries. If Mr. Trump carries out this commitment, it will push up the prices of US consumer goods, causing inflationary pressures to return, forcing the FED to raise interest rates, helping the USD increase sharply compared to other major currencies, causing Gold price dropped sharply.
Mr. Trump's victory may continue to have a negative impact on gold prices in the short term, but this impact may gradually decrease, because Mr. Trump will officially take office early next year. Therefore, US economic data may receive more attention from investors because it directly impacts the prospect of cutting interest rates by the FED.
This week's economic calendar is quite bleak, especially when compared to this week's major events. The main economic news and events to monitor will be CPI, PPI, October retail sales, and US weekly unemployment benefit claims data. In addition, FED Chairman Jerome Powell will also give a speech next Thursday.
📌From a technical perspective, on the H4 chart, the price of gold is forming a head and shoulders pattern, however, confirmation is needed when the 2642 support zone is broken. If this price model is true, the gold price may drop to an area approaching 2,530 USD/oz. In the opposite case, the gold price will still maintain its upward momentum if the price trades above the 2710 threshold, and at the same time breaks through the peak level at 2,790 USD/oz.
Notable technical levels are listed below.
Support: 2,668 – 2,640USD
Resistance: 2,697 – 2,700 – 2,710USD
SELL XAUUSD PRICE 2751 - 2749⚡️
↠↠ Stoploss 2755
BUY XAUUSD PRICE 2599 - 2601⚡️
↠↠ Stoploss 2595
Futures

#202445 - priceactiontds - weekly update - wti crude oil futuresGood Evening and I hope you are well.
tl;dr
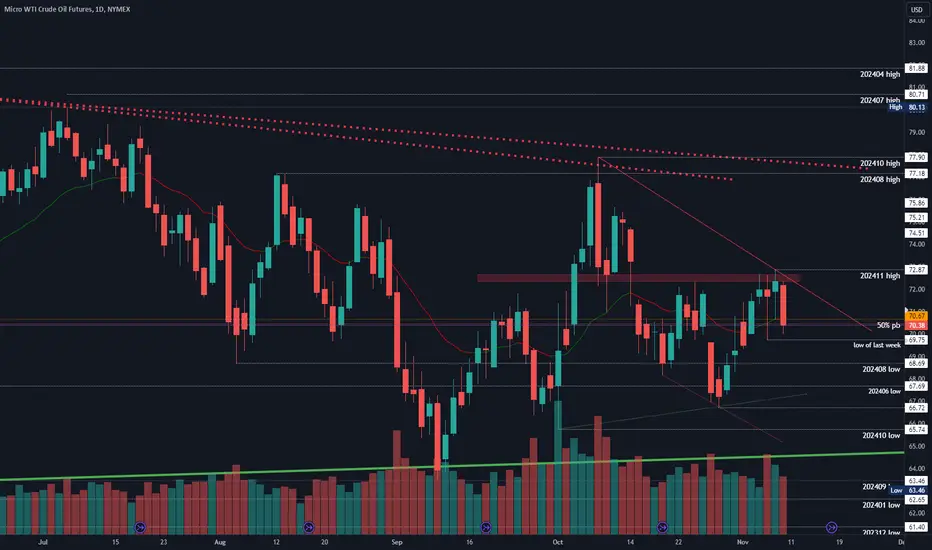
wti crude oil futures: Neutral between 68 - 73. Bulls have no tried to have a daily close above 73 for a month and could not get it. Friday’s bear bar looks like the turning point from which we will test lower. First bear target is a daily close below 70, followed by 68 and then 67. I doubt we get below 66.8 and rather print another nested triangle.
Quote from last week:
comment: The trading range expanded some but not much. On the weekly chart the September and October lows do seem to be respected and holding but since bulls fail to trade above 72.33, we are forming more nested triangles inside the big one on the monthly chart. For now the range is 65 - 72.33 until broken.
comment: Market is now trying for 4 weeks to get below 73 and still failing. Friday’s bar is decent enough that bears could have given up and market has to drop down to 68 or lower to 67 to find more buyers. The trading range 68 - 73 is still not broken and until it is, that is the range to play. I just expecting bears to be stronger next week than the bulls.
current market cycle: trading range
key levels: 68 - 73
bull case: Bulls failed so many times below 73 now, they will probably only try again at 68 or even lower. We are making higher lows since September, so for now I expect buyers to step in above 67.5. If bulls keep it above 70, I would be surprised and we chop more between 70 and 73 until one side clearly gives up.
Invalidation is below 66.7.
bear case: Bears established strong resistance under 73 and we still have an open gap there. Their next target is to get a daily close below 70 to make much more bulls cover and then I expect the selling to accelerate down to 68 or even 67. Funny thing to watch currently is that the daily, weekly and monthly 20ema are as flat and close together like I have never seen it on markets before. This market is in absolute balance between 70 and 72. Mean reversion strategies for Oil must have made a killing in 2024.
Invalidation is above 73.
outlook last week:
short term: Neutral again. Clear range and bearish pattern with limited downside. Scalp and don’t overstay your welcome in positions.
→ Last Sunday we traded 69.49 and now we are at 70.38. Good outlook but it’s not hard to be neutral and be right about it in this market.
short term: Neutral again. Range is unbroken, play it until it breaks.
medium-long term - Update from 2024-11-10 : Unless an event comes up, this will very likely close around 70 for the year.
current swing trade: None
chart update: Nothing
#202445 - priceactiontds - weekly update - gold futuresGood Evening and I hope you are well.
tl;dr
gold futures: Neutral. Market only went lower through spikes, which were followed by a pullback. This is not as strong as it looks and I do think it’s likely that bears get disappointed next week. 2600 is possible but that is the lowest I can see this going for now. Any long closer to 2626 is an amazing trade. I have an open bull gap there and I highly doubt bears will be able to close it. For now bears have turned the daily 20ema into resistance and if you want higher probability on your longs, wait for a breakout above 2725.
Quote from last week:
comment: Decent pullback now on the daily chart but still far above the daily 20ema. Friday’s rejection at 2772 was good enough to expect this to break below 2740 for the second leg down. Problem for the bears is, that even if they break below 2720, the downside is probably limited to the bull trend line from August. So clearly a tough spot to trade. Any long closer to 2700 is better than closer to 2750. Same logic for shorts, I think 2800 continues to be a good level to sell and market moves more sideways instead of another break above that price.
comment : Bear surprise because they just melted through 2700 and the bull trend line on Wednesday. Bulls retested the bull trend line and got rejected. Bears were also strong enough to keep the market below the daily 20ema and as long as that is the case, bears are in control for now. 2600 is my lower target for the bears and sideways 2600-2720 is the most likely path forward imo.
current market cycle: Best guess right now is a bigger trading range 2600-2800.
key levels: 2600 - 2800
bull case: Bulls failed at 2700 and if they don’t close a daily bar above 2720 soon, we could test down to 2600, which is where I expect many more buyers to enter the market again. We have an open bull gap, the October low and the weekly 20 ema in the price area. I do think the closer you can long to 2600, the better the trade.
Invalidation is below 2600.
bear case: Bears had 2 spikes down now and they could get a third before I see this going higher again. Bears know that each sell spike was followed by a bull bar, so the trend down is weak and will likely find it’s bottom soon. Bears will likely wait for another pullback higher to daily 20ema and/or bear trend line around 2710, before trying for a third leg down.
Invalidation is above 2730.
outlook last week:
short term: Slightly bearish for a test down to 2700-2710.
→ Last Sunday we traded 2749 and now we are at 2694. Good outlook, market got even 50 points lower than my target. Hope you made some.
short term: Neutral around 2700. If we stay below 2720, I can see a third leg down to retest 2650 or even go down to 2600/2620. Above 2730 I favor the bulls to go higher again.
medium-long term - Update from 2024-11-03: For now I can’t see this breaking above 2800, since the rally was climactic. Until 2600 is broken, I expect sideways movement inside this range. Market should test down to the weekly 20ema over the next weeks/months but bears have absolutely nothing to show for since June and that’s why we can’t expect bigger selling until they clearly do more.
Update: Changed 2700 to 2600, since market broke strongly below 2700 already. Trading range is still my preferred path forward, just the lower end went down 100 points.
current swing trade: None
chart update: Added bear trend line

#202445 - priceactiontds - weekly update - sp500 e-mini futuresGood Evening and I hope you are well.
tl;dr
sp500 e-mini futures : Bullish. Breakout was strong with follow through and I have a measured move target to 6400+ and a trend line that runs through 6200. Even if we get a pullback, the first one will most likely be bought and we retest 6050. What would the bears need to make this the ultimate bull trap? One giant bear bar that closes below 5850 could do it but how likely is that? It’s absolutely reasonable to not buy into this madness and wait for bears to come around. I would be surprised if we closed 2024 above 6000.
Quote from last week:
comment: Reasoning here is almost identical to dax and nasdaq. Selling was strong enough for a second leg and a measured move leads down to 5555, which is near the 50% retracement. I won’t repeat the same stuff here what I wrote for dax.
comment : Same logic here as for dax. Bears failed to get below 5700 and on Tuesday market went the other direction. Wednesday was certainly a huge bull surprise and we went high enough that it opens even higher targets. The rally lost steam on Thursday/Friday, which could result in a pullback first. I draw the line for bulls around 5850, if we drop below, we might as well go 5800 followed by 5730.
current market cycle: Bull trend
key levels: 5850 - 6050 (above 6050, 6200 comes in play)
bull case: With 6000 my bullish targets were met but this does not look like it’s reversing anytime soon. If bulls keep it above 5850, we are free to go up to 6100/6150. A measured move from last week up gives us 5300 and I even have a measured move target at 6500ish from the August rally but that is obviously very far fetched for now.
Invalidation is below 5850.
bear case: Bears have nothing as of now. The rally last week was strong enough to expect more upside and bears could not trade more than a bar below the 1h 20ema since Tuesday. The best they can hope for is that the bull trend line above us, holds and market does not go much above 6050. My bullish targets were met with 6000 but the market obviously broke strong enough above it. Bears have no decent reason to sell this right now.
Invalidation is above 6100.
outlook last week:
short term: Neutral until we break below 5700. I favor some more sideways movement before the second leg down but it should stay below 5830.
→ Last Sunday we traded 5758 and now we are at 6025. Well, at least I was not bearish.
short term: I want to join the bulls but need a pullback first or a strong momentum break above 6030. Zero bearish thoughts as of now.
medium-long term - Update from 2024-10-13: Very rough guess for the remaining trading weeks in 2024. Spike up, decent correction (~10%), nasty (blow off top) year end rally if earnings hold in Q4. Don’t trade based on that guess.
current swing trade: None
chart update: Removed bear lines, adjusted bull trend line and added bull channel

Scinarios for $SPX till the election year ends Bearish daily candle on Friday 25th Oct but watching RSI signals its showing some support to the up-trend line from Aug low . This setup suggested continuation upward trend up to next week and election week then signal can be more clear!.
Above 5855 is bulish entry and below 8750 is bearish one.
6000 target still valid but i will recommend 5920 to take profit
for downplay 5640 is last support which is related to FED pivot cutting . good luck

Russell 2000 Futures Ascending Triangle (15m)Ascending Triangle breakout will lead to further breakouts into ATHs with price targets of:
- 2337
- 2615 (ATH)
- +++
SL would be a breakdown of the triangle and rejection to reenter the pattern, although bullish structure could remain in place


CRUDE OIL (WTI): Intraday Bearish Movement
Crude Oil may drop from the underlined blue resistance.
As a confirmation, I see an inverted cup & handle pattern on an hourly time frame.
Goals: 71.20 / 70.84
❤️Please, support my work with like, thank you!❤️

FOMC and Powell support GOLD, bearish outlook still prevailsOANDA:XAUUSD Spot trading rose nearly 2% yesterday when the Federal Reserve cut interest rates by 25 basis points as market predicted, causing the US Dollar to plunge and giving gold a boost.
The Federal Reserve cut its benchmark interest rate by 25 basis points on Thursday, while policymakers noted a "broad deterioration" in the job market. Officials voted unanimously to lower the federal funds rate to a range of 4.5%-4.75%. Federal Reserve Chairman Jerome Powell said Trump's presidential election victory will not directly affect monetary policy.
Federal Reserve interest rate cuts have put pressure on the US dollar and bond yields, while boosting the investment appeal of non-yielding gold.
FOMC content
In their monetary policy statement, officials acknowledged the economy is growing steadily despite slowing labor market conditions. They admitted inflation was close to the Fed's 2% target but still remained slightly high.
Fed policymakers also noted that the risks to achieving their dual mandates were “roughly balanced” but acknowledged uncertainty about the economic outlook.
The Federal Open Market Committee (FOMC) statement said: "The Committee believes that the risks to achieving its employment and inflation goals are balanced and that there is uncertainty about the economic outlook. The Committee concerned about the risk of achieving his dual mandate."
While policymakers noted “progress” in achieving the inflation target, they neglected to mention “becoming more confident that inflation can move steadily toward 2 percent.” sustainable”.
“Labour market conditions have generally eased since the beginning of this year, with the unemployment rate rising but remaining low,” the Fed statement said.
Powell said the election results would not affect decision-making in the short term and that there was flexibility in future policy direction.
At his post-FOMC press conference, Fed Chairman Jerome Powell avoided giving specific guidance on the future direction of interest rates, leaving room for flexibility at the December meeting and beyond. He emphasized that because the economy is strong, the Fed can take its time lowering interest rates. He acknowledged that even after Thursday's rate cut, policy remains restrained as officials aim to return interest rates to neutral levels.
Regarding the pace of interest rate cuts, Powell said if the labor market weakens or slows as it approaches neutrality, the Fed could accelerate the pace of interest rate cuts. However, he clarified that no final decision has been made yet.
Powell also said that in the short term, the presidential election results will not directly affect monetary policy.
General assessment
The Fed's 25 basis point cut boosted gold prices, on the other hand, Powell made very clear statements about the possibility and prospect of cutting interest rates and this is not beneficial for the US Dollar.
A very basic knowledge is that the US Dollar is controlled by the Fed and not under the power of the US President. Therefore, even in the event that Trump is elected and boosts the US Dollar, it will still be restrained by the policy of cutting interest rates. Only if Trump can completely eliminate the Fed will the US Dollar have nothing to show for it. prevent. Of course, this is without precedent, nor has any President been able to do this.
Analysis of technical prospects for OANDA:XAUUSD
Although gold has recovered strongly from the 0.618% Fibonacci level confluence with the lower edge of the channel, it is still in a downtrend with the price channel as the short-term trend.
On the other hand, gold's upward momentum has also been limited by the EMA21 level, and it still has enough bearish conditions when the Relative Strength Index is also showing signs of folding down from the 50 level area.
If gold falls below the 0.382% Fibonacci retracement level, it will have the potential to fall a bit further with a short-term target of around 2,684 USD rather than 2,668 USD.
However, in case gold moves above the EMA21 level it will tend to increase further to test the 0.236% Fibonacci level. Therefore, for open selling positions should be protected above EMA21 quite "strictly."
During the day, gold still has a bearish technical outlook with notable points listed as follows.
Support: 2,684 – 2,668USD
Resistance: 2,700 – 2,710USD
SELL XAUUSD PRICE 2736 - 2734⚡️
↠↠ Stoploss 2740
→Take Profit 1 2729
↨
→Take Profit 2 2724
BUY XAUUSD PRICE 2676 - 2678⚡️
↠↠ Stoploss 2672
→Take Profit 1 2683
↨
→Take Profit 2 2688

GOLD established a falling structure after a sharp declineOANDA:XAUUSD Spot delivery is basically stable after yesterday's plunge. The current gold price is about 2,660 USD/ounce. Previously on Wednesday (November 6), after Trump was elected President of the United States, investors rushed to buy US Dollar, OANDA:XAUUSD plummeted to its lowest level in 3 weeks.
As sent to readers in many articles about the election of Trump, a shock decline in gold is inevitable because Trump's "steering wheel" will support the Dollar from general economic policies.
Trump's victory will boost the dollar as he is expected to propose new tariffs that could cause a spike in inflation and cause the Federal Reserve to pause its easing cycle.
Fed decision upcoming
After cutting interest rates by 50 basis points in September, the market expects the Fed to cut interest rates by 25 basis points this time.
The US economic calendar today (Thursday) will focus on the Federal Reserve's monetary policy decision. The Fed is expected to reduce borrowing costs by 25 basis points to a range of 4.50%-4.75%.
Trump and the Fed
Trump's economic policy proposes imposing taxes, increasing the fiscal deficit, and reducing taxes. His economic advice conflicts with the Fed's anti-inflation policy. Therefore, the Fed will be forced to take a very cautious approach when loosening monetary policy.
The risk of rising inflation after Trump introduced new taxes could slow the pace of interest rate cuts by the Federal Reserve. This is very important because Trump and the Fed are becoming opposing, it is likely that Trump will destroy all previous efforts of the Fed to curb inflation.
For more than 70 years, the Federal Reserve has operated as an independent government agency in the United States, but this tradition may soon be overturned. After declaring victory on Wednesday (November 6), Donald Trump is preparing to talk about "interest rates" after taking office in January 2025, insisting his intuition is better than the Chairman of the Reserve Federal Powell.
For more than 70 years, the US central bank has operated as an independent government agency. When officials meet to decide interest rates, they will not need to consult with the president and other elected officials. That's because, as the former Fed chairman famously said, “The job of the central bank is to get rid of the drinking bowl just as the party is getting started.”
In other words, they have to make unpopular decisions that ultimately seek to bring long-term benefits to the economy. However, once President-elect Trump returns to the White House, the independence the Fed has maintained for many years could be compromised.
Trump's statement was posted on CNN: “I think the president should at least have a say. I feel very strongly,” Trump said about the Fed's interest rate decision at a press conference in August.
Trump added: “I make a lot of money, I'm very successful and I think in many situations I have better abilities than the people at the Fed or the president.”
Analysis of technical prospects for OANDA:XAUUSD
After yesterday's strong price drop, gold has all the technical conditions to decrease in price through the price channel. The fact that gold was sold below the price channel and the 21-day moving average (EMA21) caused the bullish price structure to be completely broken.
Currently, gold is recovering slightly after receiving support from the 0.618% Fibonacci retracement level, and once this level is further broken below, gold tends to continue to decline with a subsequent target level of around 2,600 USD around the 0.786% Fibonacci retracement area.
On the other hand, the Relative Strength Index continues to point downward after breaking the 50 level, which should be considered a negative signal for gold as the RSI's next target is 25. Showing that the downward momentum remains quite wide in the front.
In the near future, technically, gold has the potential to decrease in price with the price channel being the short-term trend.
As long as gold remains in the price channel and below the EMA21 level, the bearish outlook will still be prioritized, and the notable points will be listed as follows.
Support: 2,640 – 2,645USD
Resistance: 2,668 – 2,684 – 2,697USD
SELL XAUUSD PRICE 2708 - 2706⚡️
↠↠ Stoploss 2711
→Take Profit 1 2701
↨
→Take Profit 2 2696
BUY XAUUSD PRICE 2637 - 2639⚡️
↠↠ Stoploss 2633
→Take Profit 1 2644
↨
→Take Profit 2 2649

2024-11-07 - priceactiontds - daily update - daxGood Evening and I hope you are well.
tl;dr
dax futures - Neutral. Bullish read was perfect and good for 300+ points. Now the air gets thinner again. Above 19500 longs are probably not a good trade since the downside is sub 19100 and upside probably limited to 19700 max. If market holds above the 1h 20ema tomorrow, I’ll try longs but if now, we could see some profit taking again.
comment : Hope you took the amazing longs today. Now it’s very tough to be a bull above 19500. We have big rejections from 19500 and 19600 on Wednesday and we have to assume that these prices continue to be resistance. If you want to buy this you would have to risk down to 19080 to make maybe 100 points. Not a good trade. I would rather try to scalp for 10-20 points than coming up with good trades from 19500. I will look for longs near the 30m or 1h 20ema, if they show to be support. No shorts until US starts the selling too.
current market cycle: trading range
key levels: 18900 - 19700
bull case: Bulls want to retest 19650 and then also the ath at 19802. No reason to not get there because we have multiple measured move targets or patterns that lead there or higher. 20000 is still possible, if we get follow through buying tomorrow. If you are thinking “this can’t go higher, the german economy is a dumpster fire and all news are beyond bad blablabla” I got bad news for you. This has nothing to do with any logical reason to trade near the ath. Everyone who wanted to short this because of logical reasons already has and market is moving where the least resistance is. Call it a pain trade if you will. We have 2 years of negative GDP print and dax is going for 20000. Stop looking for reasons why markets are doing stuff. Senseless waste of time and energy.
Invalidation is below 19000.
bear case: Bears want to keep 19500-19650 resistance to prevent more bulls to join for 19800 or 20000. I would not look for shorts to be honest. US markets are unstoppable and you would try to short during a euphoric wave. I do think below 19400 more bulls would cover again and we can trade to 19100 again but I would only join them on strong momentum but I still favor the bulls to print 20000 rather than bears selling this down below 19200 again.
Invalidation is above 19700.
short term: Neutral. Leaning slightly bullish if we just continue higher and we have a clear support with the 30m or 1h 20ema.
medium-long term - Update from 2024-10-19: 20000 is the goal for 2024, if bulls do not get it until year end, it will probably not happen for the next 5-10 years. This market is beyond overvalued and will drop 30-50% in the next 5 years. I have no doubts about that. That fact should not be relevant to your trading at all.
current swing trade: Took most off on 19500, leaving runner for 20000.
trade of the day: I called the long and long it was.

2024-11-07 - priceactiontds - daily update - sp500Good Evening and I hope you are well.
tl;dr
sp500 e-mini futures - Neutral. All bullish targets are met for me and I will not long anything above 5980 anymore. Too early for shorts, wait for bears to come around with force. Blow-off top with 6050 or 6100 is not out of the question, so best to join on momentum or sit on hands. Next big points will be made to the downside.
comment: All my bullish targets are now met and I would not look for longs above 5980. I got one more measured move higher to 6160 but that’s just beyond insane to expect this to be hit. But so was 6000 and here we are. All bubbles burst eventually, so will this.
current market cycle: bull wedge
key levels: 5720 - 6013
bull case: Bulls got 6000 and now want to continue and make this look like a real breakout above the bull wedge to trap many weak traders into longing this above 6000 and make them exit liquidity. At least that’s what I see potentially happening here. No interest in longs up here or looking for arguments for bulls. This is the biggest bubble there ever was. Next big points will be made to the downside.
Invalidation is below 5720.
bear case: Bears still don’t have much. The selling will start once enough bulls begin to take profits. Market is trying again to break above a multi week bull pattern and those rarely succeed. Don’t try to be an early bear and burn your account. This could easily go 50-100 points higher before turning. Measured move down from 6000 to 5730 leads exactly to the September low, where the bull trend line started. If we hit that price in 2024, you read this here first.
Invalidation is above 6050.
short term : Neutral. Scalps only for me until bears come around big time.
medium-long term - Update from 2024-10-13: Very rough guess for the remaining trading weeks in 2024. Spike up, decent correction (~10%), nasty (blow off top) year end rally if earnings hold in Q4. Don’t trade based on that guess.
Update 2024-11-07: Blow-off top happening right now and 6013 could be the end of it, I don’t know. Next comes the correction before bulls try another run at the highs during santa rally.
current swing trade: Nope
trade of the day: Buy anwhere. Again. 1h 20ema not touched since Tuesday. Trends do not get stronger than this.

SELL ON USOIL As usual here is our trade for today on CRUDEOIL/CL/USOIL, you can enter by setting the same SL and TP as mine!
Follow for more!
Let me know the market you want an entry on!

Nifty Bank Index Analysis (30-Minute Chart)Key Observations:
1.Fibonacci Retracement Levels:
The chart shows a clear downtrend from around 54,497 to the recent low near 50,279.
Key retracement levels include:
23.6% Retracement : Around 53,497, indicating minor resistance.
38.2% Retracement : Near 52,882, a level that has acted as resistance multiple times.
50% Retracement : Around 52,385, which has been retested recently.
78.6% Retracement is seen at 51,180.8, a key level of support.
2.Moving Averages (MA):
The 30-minute chart shows price movement interacting with multiple MAs.
The 200-period MA is an essential indicator of trend direction and resistance/support.
Shorter MAs like the 20 and 50 periods can highlight entry points during trend reversals.
3.Support and Resistance Levels:
Resistance: 52,389.90 and 53,497.15. Breaking these could signal bullish momentum.
Support: 51,195.90 and a lower support at 50,279.50, which marks the recent low.
4.Trendline Channels:
The index is moving within a channel, with an upward support trendline. The price respecting these levels might suggest range-bound movement with breakout potential.
3.Volume Analysis:
Recent volume spikes align with price testing key resistance levels, hinting at possible rejection or continuation if volume sustains.

Trend reversal trade setup formingTrend reversal trade setup forming.
I'm using the break of the green down trend as my entry.
risk will be determine later.

2024-11-06 - priceactiontds - daily update - sp500Good Evening and I hope you are well.
tl;dr
sp500 e-mini futures - Same here, 2 daily bars engulfing 2 months price action and market tested the upper bull wedge line for a new ath. We are close enough to 6000 that we can expect it to get hit, everything else would be a huge surprise to me. Can you short 6000? Not blindly, market mostly needs a double top or more at these levels before it gives up on it. If bears get below the 1h 20ema, I start thinking about not being bullish anymore, until then it’s peak euphoria.
comment: Huge day for the bulls, right to or through the upper bull wedge line, depending on how you want to draw it. 6000 is the target and bulls will not stop until we have printed it. Bears can’t seriously expect this to stop before so that is why most of today's price action was bears giving up. We need some time around 6000 to find out how many bulls want to buy that price or if we see an immediate profit taking and reversal down. For now the bull wedge is still alive and the best pattern we have. 6000 would be a bit of an overshoot and those can reverse very fast and they like to test down to the other extreme, which would be 5800ish.
current market cycle: bull wedge
key levels: 5730 - 6000
bull case: Bulls want 6000. Don’t make this more complicated. Market has not touched the 1h 20ema since yesterday’s US open. As long as it is not broken, only look for longs until we hit 6000.
Invalidation is below 5730.
bear case : Bears don’t have much. Complete giveup from since yesterday and they will try again at 6000. If they somehow manage to print a decent 1h bear bar below the 20ema tomorrow, their case would get better. For now they don’t have one.
Invalidation is above 6050.
short term: Max bullish for 6000 as long as 1h 20ema holds.
medium-long term - Update from 2024-10-13 : Very rough guess for the remaining trading weeks in 2024. Spike up, decent correction (~10%), nasty (blow off top) year end rally if earnings hold in Q4. Don’t trade based on that guess.
current swing trade: Nope
trade of the day: Buy anwhere.

2024-11-06 - priceactiontds - daily update - daxGood Evening and I hope you are well.
tl;dr
dax futures - 1 daily bar to almost engulf 2 months of price action. The rejection above 19600 was strong enough to expect that the highs are in but I am not convinced. I highly doubt dax will be flat or lower while wallstreet is doing an early Santa rally on coke. I am much more bullish and expect 19000 to hold. Decent 1h bear bar that closes below 19000 can convince me to turn bear.
comment: Tough to ponder what to make of big up on US markets while dax sold off hard to get below 19100 again. I do think 19000 is huge support and bulls are favored but 6 consecutive daily bar closes below the ema is pretty bearish. Will continue to look for longs around 19100 until 19000 is clearly broken and we go down.
current market cycle: trading range
key levels: 18900 - 19700
bull case: Bulls got above 19600 which was an amazingly fast up move but the sell off was even better. Bulls have still no reason not to buy this around 19100. It has been profitable for a month now and given price action on the other markets, I am having a very hard time to be bearish. Bulls need to get above 19300 for more bears to cover and then they can try to go 19500 or higher again. Most outrageous target of 20000 is still on the table.
Invalidation is below 19000.
bear case : Bears see the perfect head & shoulders pattern on the daily chart. Also the huge rejection above 19600 and the 6 consecutive closes below the daily ema. Bears have all the arguments on their side to try and break below 19000. Is the current market environment good for them? I don’t know. It’s not that often that major western indices converge that much but let’s see tomorrow. Measured move down brings us to 18300. Make no mistake, I absolutely, 100% expect that price to be hit again this year. This rally is nothing but coke fueled euphoria based on hopes and dreams the next US government will wave a magic wand and fulfill wallstreet’s dreams.
Invalidation is above 19700.
short term: Bullish as long as 19000 holds. I think we can print 20000 before this corrects big time. Below 19000 I am wrong.
medium-long term - Update from 2024-10-19 : 20000 is the goal for 2024, if bulls do not get it until year end, it will probably not happen for the next 5-10 years. This market is beyond overvalued and will drop 30-50% in the next 5 years. I have no doubts about that. That fact should not be relevant to your trading at all.
current swing trade: If 19000 holds tomorrow, will do a swing long and hope for a homerun to 20000.
trade of the day: Wild swings in both directions. Globex was obviously as bullish as it gets but changing to full bear mode on EU open and hold to 19100 was tough.

Ready for the US election, GOLD still fluctuates quite modestlyOANDA:XAUUSD volatile without a clear trend, as uncertainty over the US election has fueled market expectations of a controversial outcome and possible political tensions, while investors also Close attention should be paid to the Federal Reserve this weekend during their monetary policy meeting.
The US presidential election takes place on Tuesday, with polls showing Democratic candidate Kamala Harris and Republican candidate Donald Trump in a tight race for the White House.
A Reuters/Ipsos poll last month showed public fears that the US could repeat the riots that followed Trump's 2020 election loss, when hundreds of people stormed the country after he claimed that his defeat was due to fraud in Congress.
If Trump wins, I think gold will fall then rise quickly again because a Trump win will benefit the Dollar and a stronger Dollar means gold will be under direct correlation pressure. However, we will not forget that under Trump, the tariff war and his policies created a long period known as the “Trade War”, which has caused gold prices to increase ever since. up to now.
Another focus this week is the Federal Reserve's interest rate decision on Thursday, with markets expecting a 25 basis point rate cut. Gold is considered a hedge against economic and political instability and often performs well when interest rates are low.
Analysis of technical prospects for OANDA:XAUUSD
On the daily chart, gold has reached the support level most recently noticed by readers in the previous issue at the horizontal support level of 2,725 USD.
There has been a slight recovery as of the time this article was completed, but the level of recovery is not significant as the operating amplitude is still very slow while the downward RSI has not been reached yet. level 50, level 50 is considered a support or resistance point depending on the RSI's movement conditions.
In the short term, if gold moves above 2,745 USD, the resistance point you noticed in the previous publication, it will have the conditions to continue to increase further with a target of around 2,768 USD in the short term. , more than the 2,786USD price point of the 0.50% Fibonacci extension.
In a more negative case, gold breaks below 2,725 USD, it is likely to decline further with a target of 2,709 USD in the short term more than the original price of 2,700 USD which is also the price point of the 21-day moving average EMA21. Therefore, the short-term long-term protection level should be set behind the level of 2,725 USD, in the longer-term case the long-term open position protection level should be set behind the original price level of 2,700 USD.
In the immediate future, gold still has an upward trend in the medium and long term with support for the above mentioned price increase, and notable points will be listed as follows.
Support: 2,725 – 2,709 – 2,700USD
Resistance: 2,745 – 2,768 – 2,786USD
SELL XAUUSD PRICE 2777 - 2775⚡️
↠↠ Stoploss 2781
→Take Profit 1 2770
↨
→Take Profit 2 2765
BUY XAUUSD PRICE 2703 - 2705⚡️
↠↠ Stoploss 2699
→Take Profit 1 2710
↨
→Take Profit 2 2715

GOLD is waiting for more information from the electionOANDA:XAUUSD Still waiting for more information from the US Presidential election for a medium-term trend, investors need to prepare for political tensions after polls showed Donald Trump and Kamala Harris are both tied. each other on scores. The presidential election still has a very high possibility of a controversial result, and remember that in the 2020s when Trump lost the race for the White House, there were many riots in the US. protests led to mild political tensions.
With the tight race between former President Trump and Vice President Harris for control of the U.S. Congress at stake, in the event the result is unclear or controversial, this could aggravate further political instability.
Trump has repeatedly said that any defeat can only come from widespread fraud, echoing his claims in 2020. If the margins in key states are as close as expected, there is It may take several days to know the final winner.
Additionally, the Federal Reserve is expected to cut interest rates by 25bps on Thursday, following a sharp cut in September, while adding to US interest rate cuts this year.
Gold is considered a hedge against economic and political instability and tends to perform strongly when interest rates are low. This has helped gold gain nearly 33% this year so far.
Analyze technical prospects OANDA:XAUUSD
On the daily chart, gold's technical structure has not changed much. For more than 3 trading sessions, it has mainly moved sideways, because there has been no sudden impact from the fundamental factors.
Support at $2,725 helped gold recover yesterday but the RSI is still pointing down without reaching the nearest support level at 50. This shows that gold can still A little more bearish, and once the $2,725 support level is broken below it will be open to a little more downside with a target then around $2,709 – $2,700.
However, on the daily chart overall, gold still has conditions to increase with the main long-term price channel supporting the uptrend and the same with the medium-term price channel. The most notable support is the EMA21 level which is also keeping gold above it.
During the day, gold's main technical outlook is bullish with notable technical points listed as follows.
Support: 2,725 – 2,709 – 2,700USD
Resistance: 2,745 – 2,768 – 2,786USD
SELL XAUUSD PRICE 2777 - 2775⚡️
↠↠ Stoploss 2781
→Take Profit 1 2770
↨
→Take Profit 2 2765
BUY XAUUSD PRICE 2703 - 2705⚡️
↠↠ Stoploss 2699
→Take Profit 1 2710
↨
→Take Profit 2 2715

2024-11-05 - priceactiontds - daily update - daxGood Evening and I hope you are well.
tl;dr
Indexes - Who wants to be long into election day? That question pondered my mind couple of times today but here we are. Surprising bull strength. I said it was too soon for the bigger second bear leg down but today was also too strong for bulls at this point. No bigger opinion on today’s price action. Most markets traded back up to the 50% retracement and near their daily 20ema and that spot is as neutral as it gets. Still leaning more bearish than bullish and I would not be surprised if the Globex session sell this hard.
dax futures
comment: Clear trading range 19100 - 19400. I expect bears to come around soon and reverse it down. If we print above 19450, I am most likely wrong about this. Friday’s high was not broken and we are right under the 20 ema and 50% retracement. Many reasons for bear to short again. Above 19450 bears will probably give up and we test 19600 or higher. Market is neutral around 19250.
current market cycle: trading range
key levels: 18900 - 19400
bull case: My line in the sand for bulls continues to be 19400-19450. If they break above that, bears will likely give up. Other than that I don’t have many arguments for them. We are below the 50% and daily ema, if bears come around here, bulls just have to cover because it could easily go back down to 19250 or lower.
Invalidation is below 19000.
bear case: Bears need to keep this below 19400. If they can manage, next target is test of the open price 19260 and then we could get a big second leg down. We have a decent two legged pullback now on the 4h chart and today’s high could fit a proper channel.
Invalidation is above 19400.
short term: Bearish if we stay below 19420ish (max 19450). I think the odds of a reverse are much better than more upside.
medium-long term - Update from 2024-10-19: 20000 is the goal for 2024, if bulls do not get it until year end, it will probably not happen for the next 5-10 years. This market is beyond overvalued and will drop 30-50% in the next 5 years. I have no doubts about that. That fact should not be relevant to your trading at all.
current swing trade: None
trade of the day: Buying the EU opening reversal was an amazing trade. Perfect double bottom with Monday’s low.

2024-11-05 - priceactiontds - daily update - sp500Good Evening and I hope you are well.
tl;dr
Indexes - Who wants to be long into election day? That question pondered my mind couple of times today but here we are. Surprising bull strength. I said it was too soon for the bigger second bear leg down but today was also too strong for bulls at this point. No bigger opinion on today’s price action. Most markets traded back up to the 50% retracement and near their daily 20ema and that spot is as neutral as it gets. Still leaning more bearish than bullish and I would not be surprised if the Globex session sell this hard.
sp500 e-mini futures
comment: Bulls had a good day and a buy vacuum up to the 50% retracement and daily 20ema. Bears have to come up with something big to reverse this. On the daily chart you can see the candle bodies from 2 weeks ago stayed above 5830, which is my highest target for bulls for now. If they go above that, they might as well melt to the bear trend line 5870.
current market cycle: trading range (chance that we are already in a bear trend is there)
key levels: 5730 - 5840
bull case: Bulls want to get a measured move up from today, which would lead to 5900. For now I don’t think the odds are too good for that but today’s strength was also surprising. Above 5830 I think most bears will give up.
Invalidation is below 5730.
bear case: Bears have to defend their big leg down from last week and they should keep it below 5830. They could see this as a buy vacuum to test the daily 20ema and we go down from here. My W4 target from my weekly outlook was 5800, so we are still close enough for this to be correct.
Invalidation is above 5830.
short term: Leaning bearish if we stay below 5830. Want to see this reverse completely and then some.
medium-long term - Update from 2024-10-13 : Very rough guess for the remaining trading weeks in 2024. Spike up, decent correction (~10%), nasty (blow off top) year end rally if earnings hold in Q4. Don’t trade based on that guess.
current swing trade: Nope
trade of the day: Buying US open I guess.

GBPUSD technical bearish, eye on BoE MPCMarket expectations for the November 7 meeting
The Bank of England's (BoE) Monetary Policy Committee (MPC) will meet this Thursday, with 90% of market participants expecting interest rates to be cut by 25 basis points from 5% to 4, 75%.
This follows the central bank's first interest rate cut of 2024, which took place at the meeting ending on July 31, 2024. At this meeting, the MPC voted with a majority to reduce the Interest Rate Bank interest rate 0.25%, down to 5%.
Key economic indicators influence decisions
Recent data paint a complicated picture for BoE decision-makers. The current inflation index of 1.7% is lower than the bank's 2% target, so is no longer an immediate concern for the BoE.
According to the Office for National Statistics, the UK unemployment rate (for those aged 16 and over) is estimated to be 4.0% in June to August 2024 compared to 4.1% before there.
From June to August 2024, average annual employee regular earnings growth (excluding bonuses) is 4.9% and the region's average annual regular earnings growth public sector was 5.2%, down 5.7% compared to the same period three months ago; for the private sector it is 4.8%.
Global monetary policy context
The US Federal Reserve (Fed) also meets this Thursday, with markets pricing a 25 basis point interest rate cut to 4.50%-4.75% with a probability of nearly 100%. This creates an interesting context for the BoE's decision as global central banks are increasingly shifting their focus from fighting inflation to supporting economic growth.
Analyze technical prospects OANDA:GBPUSD
On the daily chart, GPB/USD recovered from the lower edge of the price channel, however, the recovery was limited as the main trend of GBP/USD up to now is still a downtrend noticed by the channel. price.
GBP/USD is also under pressure from the 0.236% Fibonacci retracement level, the 1.30042 horizontal resistance level and the EMA21 moving average.
Even if GBP/USD manages to move above 1.30042, it still doesn't have much solid bullish conditions as there are other resistance levels above from 1.30448 and the confluence of the upper channel edge with the 0.382% Fibonacci.
As long as GBP/USD remains below Ema21 and within the price channel it remains technically bearish, while the Relative Strength Index is also close to 50, the 50 level being considered resistance when RSI is below this level.
During the day, the technical outlook for GBP/USD is bearish with the highlights listed below.
Support: 1.29073 – 1.28448
Resistance: 1.29842 – 1.30042 – 1.30448 – 1.30705

JASMY IS ABOUT TO SKYROCKET SOON! TA + TRADE PLANPrice Trend:
The chart shows a downward trend for JASMY/USDT, indicating bearish sentiment. This is evident from the lower highs and lower lows.
Volume:
Volume appears moderate with periodic spikes, suggesting occasional bursts of buying or selling activity. The recent downward trend does not have significantly high volume, indicating a lack of strong selling pressure, which could suggest potential consolidation.
VMC Cipher_B (Divergences):
The VMC Cipher indicator, typically used for divergences and momentum shifts, is displaying mixed signals with some green dots that might hint at potential bullish divergence. However, without a strong upward momentum or green dots appearing more frequently, this remains inconclusive.
RSI (Relative Strength Index):
The RSI is around 45.95, indicating a neutral to slightly oversold condition. It hasn’t reached extreme oversold (below 30), so it doesn’t signal a strong reversal but could imply some buying interest around these levels.
Stochastic Oscillator:
The Stochastic oscillator is at 68.84, pointing upward, which may suggest a short-term bullish signal as it exits oversold territory. However, it's not yet in the overbought zone (above 80), so this could imply limited upside momentum.
HMA Histogram:
The HMA histogram shows mixed colors, signaling a lack of strong trend direction in the immediate term. The histogram bars are also close to zero, indicating limited price momentum.
Trading Plan
Entry and Exit Strategy:
Short-Term Entry:
Consider entering a long position if RSI drops near 30 or if the Stochastic Oscillator enters the oversold zone and begins to cross upward, confirming potential upward momentum. Alternatively, wait for a breakout above the nearest resistance level at approximately $0.018.
Long-Term Position:
Given the overall downtrend, a short position could be considered if JASMY retests and fails to break above resistance levels at $0.019 - $0.020, signaling a continuation of the downtrend.
Stop Loss:
For a long position, set a stop loss below recent support at around $0.016 to limit downside risk.
For a short position, consider a stop loss above $0.020 if the price begins to trend upward past resistance.
Take Profit:
For a long trade, potential take-profit targets could be $0.0185 and $0.019 if the price breaks out of the consolidation zone.
For a short trade, consider take-profit targets at $0.016 and $0.015, aligning with previous support levels.
Risk Management:
Limit exposure to a small percentage of the trading portfolio due to current trend uncertainty.
Monitor volume and momentum indicators for any changes, as low volume on a breakout or breakdown can be misleading.
Wait for Confirmation: Patience may be required, especially if the price continues consolidating. A confirmed breakout with strong volume could offer a more reliable entry.
Set Alerts: Place alerts near critical levels such as $0.016 (support) and $0.019 (resistance) to act swiftly based on price movement.
