Nvidia [NVDA] Top is in!! [S #1]----------------------------------------------------------------------------------------------
**First off, I have not posted in a while but the good news is I plan to become active and post consistently!
I will be providing high quality signals, and only signals and analysis that I personally find worth showing. Any smaller less likely to succeed trades I will be avoiding.
This will be a new series of content, I will label posts depending on category:
= Signal (Expect clear and direct post, I will not be showing or explaining much of the TA)
= Educative Post (I will be showing my Technical Analysis (TA) and teaching how it works)
Since this is a new series of posts, I will label this post as the first signal (S #1)
----------------------------------------------------------------------------------------------
***ALL ANALYSIS, SIGNALS, AND ANY CONTENT IS FOR EDUCATIONAL PURPOSES
ONLY AND ARE NOT MEANT TO BE PROFITED OFF.***
----------------------------------------------------------------------------------------------
----------------------------------------------------------------------------------------------
Current Price which is $140,25 at market close, and $140.30 during the pre market.
It is already starting to dip a bit during the pre market!
This Signal is based from bearish divergences, price action, miscellaneous bear flags, and my special indicator.
$135.24
$127.87
$122.71
Tight Stop loss: $142.52
Good Stop loss: $144.50
Loose Stop loss: $146.20
----------------------------------------------------------------------------------------------
***ALL ANALYSIS, SIGNALS, AND ANY CONTENT IS FOR EDUCATIONAL PURPOSES
ONLY AND ARE NOT MEANT TO BE PROFITED OFF.***
----------------------------------------------------------------------------------------------
Futures

2024-11-04 - priceactiontds - daily update - daxGood Evening and I hope you are well.
tl;dr
Indexes - Most went sideways today and we got some marginally lower lows. That was decent enough to disappoint bulls who were used to BTFD for a long long time now. I do think some expansion of the current range is possible but I doubt we get a bigger breakout tomorrow due to US elections. Will the election effect the market big time? No idea but my guess is less than many expect. Can either side end the party for the 0.1% and make them sell their overvalued stonkz? Probably not but I am open to surprises. My guess is we will chop wildy back and forth, like today’s US open. Bears will likely get their second leg down, but it’s too soon.
dax xetra
comment: 50% pullback of the current range from Thursday’s low to Friday’s high is around 19260 and we closed 19260. Market is in balance at that price and I expect more sideways before we get another impulse down. To guess if we hit 19000 before 19350, is impossible and you should not trade based on those questions. Middle of the range is the worst place for trades, so wait.
current market cycle: trading range
key levels: 18900 - 19400
bull case: My line in the sand for bulls continues to be 19400 and until they break that price, bears are in full control. For tomorrow I expect more buyers around 19000-19100 and I will continue to look for longs in that area, until it’s clearly broken.
Invalidation is below 19000.
bear case: Bears prevented bulls from printing 19400, which showed strength and bulls finally gave up around 2 p.m. cet where we broke below 19300. The selling was much weaker than Friday’s rally and already had 3 legs down. Maybe bears can push this down to 19000-19090 but I don’t think the odds are good to take that trade. Shorts above 19300 can work. Most important for now is to not get trapped into bad trades like shorting below 19200 or buying above 19350.
Invalidation is above 19400.
short term : Neutral. Market needs to move more sideways before we get another impulse, which will probably be down for a second leg. Will look for shorts above 19300.
medium-long term - Update from 2024-10-19: 20000 is the goal for 2024, if bulls do not get it until year end, it will probably not happen for the next 5-10 years. This market is beyond overvalued and will drop 30-50% in the next 5 years. I have no doubts about that. That fact should not be relevant to your trading at all.
current swing trade: None
trade of the day: Shorting 19350 since it was bigger resistance and market tried 3 times to get above and failed.

TP REACHED ON USOILAs you can see on the chart, CL reached our TP in which it reversed its direction to start going higher.
Follow for more daily trades!

Analysis: Key Levels to Watch for Short and Long OpportunitiesI'm watching the Nasdaq closely as it approaches a critical decision point. In this analysis, I’ll outline two potential scenarios, including both short and long trade ideas based on the confluence of key technical levels.
Current Setup and Key Level: 20,320
Right now, the 20,320 level is my primary focus. This level aligns with:
The 38.2% Fibonacci retracement of the recent downtrend, suggesting potential resistance.
The VWAP (Volume-Weighted Average Price), which is acting as a dynamic resistance level.
This confluence makes 20,320 a critical resistance zone, where the market might either reverse or push through, setting the tone for the next significant move.
Scenario 1: Short Opportunity at 20,320 Resistance
If the price approaches 20,320 and shows signs of rejection (like a bearish candle pattern), I’m looking to take a short position at this level. Here’s why:
Fibonacci & VWAP Confluence: The alignment of the 38.2% Fib level with the VWAP reinforces this level as a strong potential resistance.
Risk Management: I would place a stop-loss above the 50% Fib level (around 20,400) to manage risk if the price breaks higher.
Targets: My initial target would be around the 20,000 level. If this breaks, I anticipate a stronger move downward due to potential stop-losses being triggered below 20,000 (more on that below).
Note on Stop-Loss Clusters: I believe many traders might have their stops placed just below the 20,000 mark. If the price breaks below this level, we could see a quick, momentum-driven move lower as these stops are triggered, potentially driving price toward deeper levels.
Scenario 2: Bullish Break Above 20,320
If the price breaks above 20,320 and holds above both the VWAP and the 38.2% Fib level, it could signal a bullish shift. Here’s what I’m looking for in this scenario:
Confirmation Above VWAP and Fib Level: A strong break and close above these levels would indicate that bulls are taking control and might push for higher retracement levels.
Potential Targets: In this scenario, I’d look for the price to move towards the 50% Fibonacci level (around 20,400) as the next resistance, followed by the 61.8% level near 20,500 if momentum holds.
Invalidation for Shorts: A decisive break and hold above 20,320 would invalidate the short setup. If this happens, I’ll look for potential long entries on a pullback to the VWAP or 38.2% Fib as support, with stops below these levels to manage risk.
Conclusion
The 20,320 area is the key level to watch here, with potential for both short and long setups:
Short Scenario: Look for rejection at 20,320 to target a move down to 20,000, with a possible extension lower if the 20,000 support breaks.
Long Scenario: A break above 20,320 could open the door for further upside, with potential targets around 20,400 and 20,500.
This setup combines technical indicators with price psychology, as stops clustered around the 20,000 level may drive significant moves if that support level is breached. I'll be monitoring how the price reacts to 20,320 closely for confirmation of either setup.
Let me know if you see anything differently or if you have any questions. Happy trading!

GOLD has corrected down, facing a BIG event weekOANDA:XAUUSD rose quickly after weak non-farm payrolls data, then fell sharply from highs above $2,760/ounce and finally closed lower, closing at around $2,736/ounce.
Gold prices quickly rose to 2,760 USD/ounce after the release of US non-farm payroll data, showing that only 12,000 new non-farm payrolls were added in October, much lower than the 113,000 expected. expected and much lower than in September. However, gold prices have since dropped and lost all of their price gains during Friday's trading day.
Hit by hurricanes and strikes by aerospace factory workers, U.S. nonfarm payrolls increased by just 12,000 in October, the smallest increase since December 2020.
Other data from the nonfarm report showed the unemployment rate remained at 4.1% in October, in line with expectations, and the increase in average hourly wages last month increased to 4.0% compared to compared to the same period last year, in line with expectations and higher than the 3.9% revision in September.
Hourly earnings increased 0.4% month over month, above the forecast 0.3% and the revised 0.3%. The average number of working hours also increased to 34.3 hours, higher than expectations of 34.2 hours, but still equal to the previously adjusted increase.
As noted by readers in the short comments, it is very possible that gold's downward adjustment period is not over yet as Friday's economic data is considered very positive for gold. If it is "theoretically" correct, gold should increase sharply as soon as the data is released, but there are possibilities that the market has digested all the previous data or the data will react after more fundamental impacts. another version.
Therefore, I needed to warn about this phenomenon with short comments!
Tensions in the Middle East have helped limit gold's decline
The BBC reported that Hezbollah launched a rocket attack in northern Israel, killing seven people. It was the worst attack in months and dashed hopes of a ceasefire in the war in the Middle East.
There are too many risks ahead of the US election, as well as rumors about Iran retaliating against Israel. Polls show a tight race between Donald Trump and Kamala Harris in next Tuesday's US presidential election.
Gold is a traditional hedge against economic and political instability and tends to thrive in low interest rate environments.
It must be noted once again that, although gold and the Dollar have been increasing together recently, it does not mean that this correlation has been lost. Gold and the US Dollar have a negative correlation and if Trump is elected, the US Dollar will continue to get stronger because of Trump's policy trends (This has been sent to readers in many publications), the US Dollar will be stronger. This means that gold will be subject to correlation pressure.
This week will be a trading week with many "huge" events with the Presidential election and the US Congress along with the monetary policy decision of the US Federal Reserve (Fed). It is expected to have a STRONG and DEEP impact on the gold market trend.
Economic data to watch out for this week
Monday: Reserve Bank of Australia monetary policy decision
Tuesday: ISM Services PMI, US Presidential and Congressional elections
Thursday: Bank of England monetary policy decision, US weekly jobless claims, Federal Reserve monetary policy decision
Friday: University of Michigan preliminary consumer sentiment
Analysis of technical prospects for OANDA:XAUUSD
On the daily chart, gold has a 2-day bearish correction with the short-term uptrend temporarily lost as price activity falls below the price channel. However, this is not a negative thing because the nearest support at 2,725 USD still keeps gold above it.
The relative strength index is pointing down from the oversold area but has not yet reached the 50 level, the 50 level is considered the nearest support point in terms of momentum.
Although gold has adjusted down, in the overall picture it still has an uptrend with long-term and medium-term price channels and important support at the EMA21 level.
As long as gold remains above the EMA21 and within the price channel, it still has a bullish outlook and the notable points are listed below.
Support: 2,725 – 2,710 – 2,700USD
Resistance: 2,745 – 2,768 – 2,786USD
SELL XAUUSD PRICE 2759 - 2757⚡️
↠↠ Stoploss 2763
→Take Profit 1 2752
↨
→Take Profit 2 2747
BUY XAUUSD PRICE 2708 - 2710⚡️
↠↠ Stoploss 2704
→Take Profit 1 2715
↨
→Take Profit 2 2720

#ES_F Day Trading Prep Week 11.03 - 11.08Last Week :
Sunday Globex opened right over the Mean of Value and gave a push back to VAH where we spent the night and RTH of Monday consolidating under, staying under VAH meant weakness for us going into the week and we kept seeing flushes towards VAL but every move towards it was mostly done during ON hours and would be bought back up over 840s. Finally midweek buyers saw no continuation and we got an RTH volume sell that closed under the Mean into the Key Area that needed to be taken out for continuation into VAL.
Once under VAL all the buyers in Value and over were trapped for Supply and once we failed to get back into Value we saw the continuation sell back into Previous Distribution Balance with a strong break of Lower Edge to put us back into lower HTF Range of 790 - 630s. We did another look below 750 end of day Thursday which failed to continue that night and gave rotation back into to the Edge and Friday we most likely saw short covering before the Weekend after a big move that gave us a push to that balance top with a failure to hold over and finished with a close under the Edge trapping more supply.
This Week :
Could be another tricky week as we have election coming up Tuesday and some bigger data on Thursday so of course have to be careful trading this week but what can we sort of expect after last week ?
We are back in Previous Distribution Balance of 750s - 800s and IF we do have enough covering and buying still then that could keep the price around it with moves out of it finding their way back in as one of the scenarios BUT this what is different this time around from the time that we spent in this balance before is that now we have plenty of supply and trapped buyers built up over us in the above ranges Value and Over it, plus the Supply that got built over Thursday and Friday inside it, with a push and close under the Edge this shows us acceptance in this lower range and IF we don't have the buying to keep us up we get through that 750s area then I would look for continuation pushes into the Mean and VAL area which has a bigger Cost Basis that we made a while ago with a Gap which happened during a contract roll that we could try to get into. IF we do get there then that would be an area to be careful around as we can see covering there under Value and above lower Edge but it's not something I would build a house on because size can take it out and that could bring more selling to test the lower Edge and maybe a peak under it.
We don't have any news or data on Monday so we have to ask will the buyers from Thursday/Friday want to hold this product into Election Day or did they Sell Friday into the short covering and the ones who didn't will sell out once we take the stops which can bring the continuation move under VAH that we are looking for.
To not get too short biased, IF we are able to hold over VAH/750s and see a push back over the Edge then we would need to see price hold over 790s to bring back stability AND once stability is back would need to see a push back into above VAL, until then need to be careful looking for higher prices from the Edge as we could either balance under the Edge/VAH area or get continuation to lower targets.

#202444 - priceactiontds - weekly update - wti crude oil futuresGood Evening and I hope you are well.
tl;dr
wti crude oil: Neutral between 68 - 72. Market is in balance inside this range and for now no side has clearly better arguments for a bigger impulse. Market formed another nested triangle inside the big one. Which means buyers and sellers are in balance.
Quote from last week:
comment: Bulls actually managed to hold it above 68 and the trend line but failed to close the bear gap completely. This leaves us in nowhere land between 70-72 and a proper triangle. Play that until it’s clearly broken. No more deeper analysis needed.
comment : The trading range expanded some but not much. On the weekly chart the September and October lows do seem to be respected and holding but since bulls fail to trade above 72.33, we are forming more nested triangles inside the big one on the monthly chart. For now the range is 65 - 72.33 until broken.
current market cycle: trading range (nested triangles on multiple tf)
key levels : 65 - 72.33
bull case: Bulls need a daily close above 72.7 for a chance of retesting north of 75. Again. There is a very good chance last weeks low 66.72 can hold for now. Bulls made 3 higher highs the past 3 trading days but look at the bars. They scream weakness and the close below 70 was bearish as well. Bulls do not have many arguments here.
Invalidation is below 65.
bear case: Bears keeping this below 70 is much stronger than I expected this for the past 3 weeks. As long as they are not letting the bulls get consecutive bull bars above the daily 20ema, the bears remain in control. Yet I do think sideways is more likely than a break below 65. Last weeks price action was disappointing for both sides, which is why I continue to be neutral on this.
Invalidation is above 72.3.
outlook last week:
short term: Neutral 68-70 but leaning bearish near 71. Not the best spot to trade currently.
→ Last Sunday we traded 71.78 and now we are at 69.49. Good outlook.
short term: Neutral again. Clear range and bearish pattern with limited downside. Scalp and don’t overstay your welcome in positions.
medium-long term - Update from 2024-10-20: No idea where this wants to go in the remaining 2 months of this year so I am neutral until we have a better pattern. The big triangle on the weekly chart is alive and until that changes, no more updates.
current swing trade: None
chart update: Nothing

#202444 - priceactiontds - weekly update - goldGood Evening and I hope you are well.
tl;dr
gold: Neutral. Bears got a minor pullback from the ath but only printed 1 decent bear bar before disappointment again. 2720 is probably next big support and I see the market rather moving sideways and retesting the highs before a bigger move down and a break of the bull trend line.
Quote from last week:
comment: Minor pullback by the bears but they can not get follow through selling and that is why we can only conclude higher prices. We are trading near the top of the bull channel but we can just continue to do so until we hit 2800, which is my next upper target. I do think around 2800 we will see some bigger profit taking.
comment: Decent pullback now on the daily chart but still far above the daily 20ema. Friday’s rejection at 2772 was good enough to expect this to break below 2740 for the second leg down. Problem for the bears is, that even if they break below 2720, the downside is probably limited to the bull trend line from August. So clearly a tough spot to trade. Any long closer to 2700 is better than closer to 2750. Same logic for shorts, I think 2800 continues to be a good level to sell and market moves more sideways instead of another break above that price.
current market cycle: bull trend but it’s getting weaker and we could already be in a trading range 2700-2800.
key levels: 2700 - 2800
bull case: Bulls want this to stay above the previous support 2720 and move sideways between 2720 and 2800. It would show great strength if they would not let the market test down to the bull trend line and move sideways instead. If they do this for a couple more days, bears will give up and try again around 2800. For now I don’t see bulls breaking 2800 again, since the rally was very climactic over the past months.
Invalidation is below 2680.
bear case: Bears finally printed some decent bear bars on the 4h chart and they want a second leg down to test the bull trend line around 2700. There we can expect some sideways movement and a battle for the big round number. Until it is clearly broken, I favor the bulls to continue sideways to up again and that 2700 is support.
Invalidation is above 2820.
outlook last week:
short term: Bullish for 2800. Again.
→ Last Sunday we traded 2754 and now we are at 2749. Perfect outlook, 2801 was hit on Wednesday and Thursday. Hope you made some.
short term: Slightly bearish for a test down to 2700-2710.
medium-long term - Update from 2024-11-03: For now I can’t see this breaking above 2800, since the rally was climactic. Until 2700 is broken, I expect sideways movement inside this range. Market should test down to the weekly 20ema over the next weeks/months but bears have absolutely nothing to show for since June and that’s why we can’t expect bigger selling until they clearly do more.
current swing trade: None
chart update: Added potential two legged correction down to 2700

#202444 - priceactiontds - weekly update - sp500 e-mini futuresGood Evening and I hope you are well.
tl;dr
sp500: Bearish. 5730 was expected support and if bears are strong, 5800 stays resistance now. Expecting more sideways movement before another impulse down. Next target for bears is 5600 and bulls need a daily close above 5800. Thursday’s selling was strong enough for more downside but could also just have been distorted price action since it was end of the month. Friday was disappointing for bears already, which is why I think the selling is not as strong as hoped.
Quote from last week:
comment: Another disappointing week for the bulls. Big question now is the same as for dax and nq, was this the last before a deeper pullback or can we print 6000 before 5700? I don’t know and I am not going to pretend I do. Market is in breakout mode and the triangle has a bit more room to go. We simply need more price action because right now the market is in balance around 5870.
comment: Reasoning here is almost identical to dax and nasdaq. Selling was strong enough for a second leg and a measured move leads down to 5555, which is near the 50% retracement. I won’t repeat the same stuff here what I wrote for dax.
current market cycle: trading range
key levels: 5700 - 6000
bull case: 6000 remains bulls target but if we get a daily close below 5700, we will likely see 5550 before 6000. If we stay above, we will continue sideways.
Invalidation is below 5700.
bear case: Bears need to keep the pullback shallow and probably below the daily ema 5830. If they manage, their next target is 5670 which is the weekly 20ema and below that is 5555 for the measured move target, 50% retracement and July low.
Invalidation is above 5830.
outlook last week:
short term: Neutral. Bearish below 5820 for 5800, below 5800 we likely see 5730. Bullish above 5860 for 5880+ and above 5930 we will see 6000.
→ Last Sunday we traded 5846 and now we are at 5758. Outlook was ok.
short term: Neutral until we break below 5700. I favor some more sideways movement before the second leg down but it should stay below 5830.
medium-long term - Update from 2024-10-13: Very rough guess for the remaining trading weeks in 2024. Spike up, decent correction (~10%), nasty (blow off top) year end rally if earnings hold in Q4. Don’t trade based on that guess.
current swing trade: None
chart update: Added current valid bear trend lines and a potential bearish wave series down to 5555.

GOLD MARKET ANALYSIS AND COMMENTARY - [Nov 04 - Nov 08]This week, after rising to 2,790 USD/oz, OANDA:XAUUSD then continuously dropped sharply to 2,733 USD/oz and closed the week at 2,736 USD/oz.
According to the US Bureau of Labor Statistics, the US's October non-farm payrolls (NFP) report showed that the country only created 12,000 jobs, significantly lower than the forecast of 100,000 jobs due to the impact of the coronavirus pandemic. recent storms. Although the US economy created fewer jobs than expected, the country's unemployment rate in October remained unchanged at 4.1%.
Meanwhile, wage inflation increased. Specifically, average hourly earnings increased 0.4% last month, higher than the forecast of 0.3%. In particular, the US's basic Personal Consumption Expenditures (PCE) Index for October - the FED's favorite inflation measure - remained at a high level of 2.7%, unchanged from the level of July and October.
All of the above economic data show that the FED is in a difficult position when production activities decline sharply, the labor market weakens, but inflation remains continuously high.
However, many forecasts are likely that the FED will still cut interest rates by another 0.25% next week, but will cautiously announce the direction of interest rate cuts in the next meetings.
In addition to the FED meeting, next week there will also be the US Presidential election on November 5. According to forecasts of many experts, it is likely that Donald Trump will be re-elected as US President. If Mr. Trump becomes US President in the next term, he will impose strong tariffs on imported goods as promised during the election campaign. This will push inflation up, forcing the FED to delay interest rate cuts, and may even have to raise interest rates again.
Thus, next week's gold price is at risk of being double-impacted by the FED meeting and the US presidential election.
📌Technically, in the H4 chart, gold price still shows a clear uptrend when the price trades above the EMA89 moving average. Next week, if gold prices still trade above the 2720 threshold, we can expect gold prices to continue to maintain an upward trend. In case the price will return to a downward adjustment cycle if the 2710 support zone is broken, correspondingly in the H1 chart, the gold price forms a head and shoulders model. If this model is correct, the gold price will find its way back around mark 2650.
Notable technical levels are listed below.
Support: 2.700 – 2.710 – 2.720USD
Resistance: 2.786 – 2.768 – 2.745USD
SELL XAUUSD PRICE 2776 - 2774⚡️
↠↠ Stoploss 2780
BUY XAUUSD PRICE 2649 - 2651⚡️
↠↠ Stoploss 2645

Children Of The CornCorn Should go Up. exponential m.a. is popping. Wanted to do some Futures type here. This should be a decent, Steady gainer.
~Careful not to step on corn-flakes, you wouldn’t want to become a cereal-killer.
~The corn stalk decided to change careers. He went into a completely different field.
~Plain popcorn? I’m sorry, but you're going to have to do a lot butter than that.
This One should mint us some Green...

GOLD prices fall under the weight of yields and exchange ratesWorld gold prices fell in the trading session on Friday (November 1) under pressure from rising US Treasury bond yields and the USD exchange rate. However, the need to hedge risks ahead of the US presidential election next week helps limit the decline in gold prices.
At closing, the spot price of gold in the New York market decreased by 7.9 USD/oz compared to the closing level of the previous session, equivalent to a decrease of 0.29%, to 2,736.5 USD/oz - according to data from the exchange.
World gold prices decreased by 0.44% this week. On Thursday, spot gold prices set an all-time record at more than 2,790 USD/oz.
The main source of downward pressure on gold prices this week is the increasing trend of US Treasury bond yields and the USD exchange rate.
The 10-year US Treasury bond yield increased nearly 10 basis points on Friday, reaching 4.382%, the highest in the past 4 months - according to data from CNBC news agency.
Yields increased due to falling bond prices as investors strongly sold US Treasury bonds ahead of the US presidential election next Tuesday. The reason leading to investors selling US debt is concerns about the increasing federal budget deficit whether Mr. Donald Trump or Ms. Kamala Harris are elected.
The Dollar Index, which measures the strength of the USD against a basket of six other major currencies, increased 0.33%, closing Friday's session at 104.32 points - according to data from MarketWatch. This week, the index increased by 0.06%, bringing the total increase in the past month to 1.75%.
The USD is increasing in value because this currency is also promoting its role as a safe investment channel in the context of the approaching US election.

GOLD has conditions to increase with expectations of recoveryOn Thursday (October 31), some traders chose to take profits, causing gold prices to fall again, falling 2% and reaching a low of 2,731 USD/oz. As of the time of writing, Friday, November 1, gold has recovered to 2,746 USD/oz.
Safe-haven demand ahead of the US presidential election has pushed gold prices up for the fourth consecutive month, and gold prices have increased about 4% in the past month.
Previously, strong economic data released by the US increased market expectations that the Federal Reserve could cautiously cut interest rates in the coming months. Meanwhile, PCE data showed PCE inflation at 2.1% year-on-year, the lowest since early 2021 and slightly above the central bank's 2% target inflation rate.
Before the taper, gold prices had risen by more than a third this year due to central bank buying and safe-haven demand due to conflicts in the Middle East and Ukraine. Uncertainty about the US presidential election has also highlighted the value of gold as a safe-haven asset.
In 2024, gold's gains are driven by economic uncertainty, central bank buying and geopolitical risks, especially in the Middle East. Gold prices are now entering a historic year as expected interest rate cuts from the Federal Reserve and central bank demand will further support gold prices.
Therefore, do not worry about price drops because in terms of fundamental long-term trends, gold is still strongly supported.
During this trading day, traders need to pay attention to the US Nonfarm Payrolls (NFP) and October Unemployment Rate data.
Surveys predict 108,000 new jobs will be added, compared with 254,000 last month.
The Nonfarm payrolls measure the change in the number of people employed during the previous month, excluding agriculture. Job creation is a leading indicator of consumer spending, which accounts for the majority of economic activity.
Figures that are much higher than expected or equal to the previous period will be considered a positive signal for the USD and continue to add pressure to the gold downtrend. Meanwhile, data at or below is expected to support gold's return to the bullish cycle and the continuation of its long-term uptrend, ending the ongoing bearish correction.
Analysis of technical prospects for OANDA:XAUUSD
On the daily chart, yesterday's correction caused gold to swing below the short-term rising price channel noted by the price channel on the chart.
However, gold is also approaching a notable support level sent to readers in yesterday's edition at $2,725 when gold has the conditions for a correction.
Although the price dropped significantly, the mid- and long-term trend is still bullish with specific conditions such as stable price activity in the price channel, stable activity above the EMA21 level.
During the day, if gold can hold above the 0.236% Fibonacci level, it will have the potential to increase further with a short-term target of about 2,768USD, the price point is the confluence of the lower edge of the channel © and the 0.382% Fibonacci level.
The expectation for the intraday trend is a recovery with a target level of around 2,768 USD, along with which notable price points will be listed as follows.
Support: 2,745 – 2,725USD
Resistance: 2,768USD
SELL XAUUSD PRICE 2765 - 2763⚡️
↠↠ Stoploss 2769
→Take Profit 1 2758
↨
→Take Profit 2 2753
BUY XAUUSD PRICE 2714 - 2716⚡️
↠↠ Stoploss 2710
→Take Profit 1 2721
↨
→Take Profit 2 2726

GOLD is close to the current level of 2,758 USDOn Tuesday (October 29) in the Asian market, spot gold suddenly increased sharply in the short term. Gold price just touched 2,757.74 USD/ounce, setting a new intraday high and approaching the previous historical high.
Traders prepare to release key economic data that will help set the tone for the Federal Reserve's next policy decision. Although tensions in the Middle East appear to have cooled, the Uncertainty about the US election still supports gold prices.
The Fed will announce its interest rate decision at its two-day meeting starting November 6. Jobs and inflation data, as well as if the results of the US presidential election are contested, This could influence the Fed's decision.
The market still expects policymakers to cut interest rates by 25bps at their November meeting. Lower borrowing costs are typically positive for gold, which does not yield a yield.
According to CME's FedWatch Tool, the market expects the probability of the Fed cutting interest rates by 25 basis points to be about 98.4%.
When the presidential election between Harris and Trump was still too close, gold had 3 consecutive weeks of increases despite the increase in US Treasury bond yields and the USD, which often puts pressure on precious metals, losing correlation. This describes both gold and USD as having separate supports.
According to the latest statistics from the China Gold Association, China's gold consumption decreased by 11.2% year-on-year in the first three quarters of 2024 as high prices suppressed jewelry demand.
Analysis of technical prospects for OANDA:XAUUSD
Gold has had 3 consecutive days of increase and is heading for the 4th day of price increase after adjusting and taking support from the short-term price channel and the 1% Fibonacci level.
Currently, gold is close to the all-time peak set previously, once gold breaks the $2,758 level which is also the target increase since gold corrected down from this level, it will have enough room to continue. upside with the next target around 2,768USD in the short term, more than the 2,786USD price points of the Fibonacci 0.382% and 0.50%.
The relative strength index (RSI) is pointing up with no signs of weakness as it approaches the overbought area, suggesting that bullish momentum remains solid, and as long as gold remains within the channel it will continue to trend. short-term upward trend.
However, in case it is sold below 2,700 USD, it will open up expectations for a medium-term correction down cycle with the target at the area of the EMA21 moving average. In the current market context, this scenario is quite unlikely.
During the day, the bullish technical outlook for gold prices will be brought into focus again by the following notable levels.
Support: 2,745 – 2,741 – 2,725USD
Resistance: 2,758 – 2,768 – 2,786USD
SELL XAUUSD PRICE 2774 - 2772⚡️
↠↠ Stoploss 2778
→Take Profit 1 2767
↨
→Take Profit 2 2762
BUY XAUUSD PRICE 2730 - 2732⚡️
↠↠ Stoploss 2726
→Take Profit 1 2737
↨
→Take Profit 2 2742

Conditions for a correction cycle, pay attention to US PCEAt the time of writing on Thursday (October 31), spot gold was at 2,783 USD/ounce, after reaching a previous record high of 2,790 USD/ounce.
Gold prices rose nearly $13 on Wednesday as uncertainty over the US presidential election fueled safe-haven demand.
Today, the U.S. Bureau of Economic Analysis will release the Personal Consumption Expenditures (PCE) price index for September, which is the Federal Reserve's preferred inflation indicator and is expected to trigger a big fluctuations in the market.
It is expected that the US PCE price index in September is expected to increase by 0.2% over the previous month and 2.1% over the same period last year.
Surveys also show that the core PCE price index in the US in September is expected to increase 0.3% over the previous month and 2.6% over the same period last year.
Also on the same day, seasonally adjusted initial unemployment claims in the United States for the week of October 26 will be released, expected to be 230,000, compared to 227,000 the previous week.
Following the release of the PCE data, investors will need to focus on the US nonfarm payrolls report on Friday.
The focus this week is on jobs data and if strong non-farm payrolls data will support the Federal Reserve to pause interest rate cuts in December. However, in case NFP data is lower than expected Expected results will be positive for gold prices. Details about this data will be sent to readers in tomorrow's publication. Today we will focus on US PCE data.
Analysis of technical prospects for OANDA:XAUUSD
On the daily chart, gold corrected slightly from the area of the 0.50% Fibonacci extension you noticed in yesterday's edition and the temporary correction was not significant.
Maintaining below the 0.50% Fibonacci level gives gold the ability to decrease a bit more with a short-term target of around 2,768 - 2,770 USD where the price point of the 0.38% Fibonacci confluences with the upper edge of the price channel.
In terms of the main trend, gold still has a main trend of increasing prices, but in terms of market structure, gold has also had a long period of price increase where the market will not be able to move in a straight line. Therefore, traders need to be ready for downward corrections, and must also note that during the past 2 years, corrections of hundreds of prices or more have occurred quite frequently. This makes us (traders) have to adapt to the current market environment, the appropriate measures are still volume control and appropriate opening positions and strict protection levels.
Currently, if gold falls below the 0.382% Fibonacci level, it would open up a short-term correction with a near-term target around $2,745 as the RSI attempts to turn Go below Level too buy. RSI below is overbought so it is considered a negative signal for gold price.
During the day, the main outlook remains bullish but there are expectations for the above downside correction and notable comments are listed below.
Support: 2,770 – 2,768 – 2,757 – 2,745USD
Resistance: 2,786 – 2,790USD
SELL XAUUSD PRICE 2803 - 2801⚡️
↠↠ Stoploss 2807
→Take Profit 1 2796
↨
→Take Profit 2 2791
BUY XAUUSD SCALPING PRICE 2756 - 2758⚡️
↠↠ Stoploss 2752
→Take Profit 1 2763
↨
→Take Profit 2 2768
BUY XAUUSD PRICE 2749 - 2751⚡️
↠↠ Stoploss 2745
→Take Profit 1 2756
↨
→Take Profit 2 2761

MYM1! Bullish Price Action for 10/31
This week’s overall trend for CBOT_MINI:MYM1! appears bearish, but during the NY session, we’re seeing strong bullish moves, often exceeding 200+ ticks. Given this pattern and the respected supply zone, I anticipate similar price action tomorrow (10/31).
I plan to enter at the 8:30 CST open, aiming for a 250-tick gain, and then sell as price reaches the supply area for a target of 280 ticks.
This is my first posted idea, so let’s hope it plays out as expected. Let’s collect those ticks!

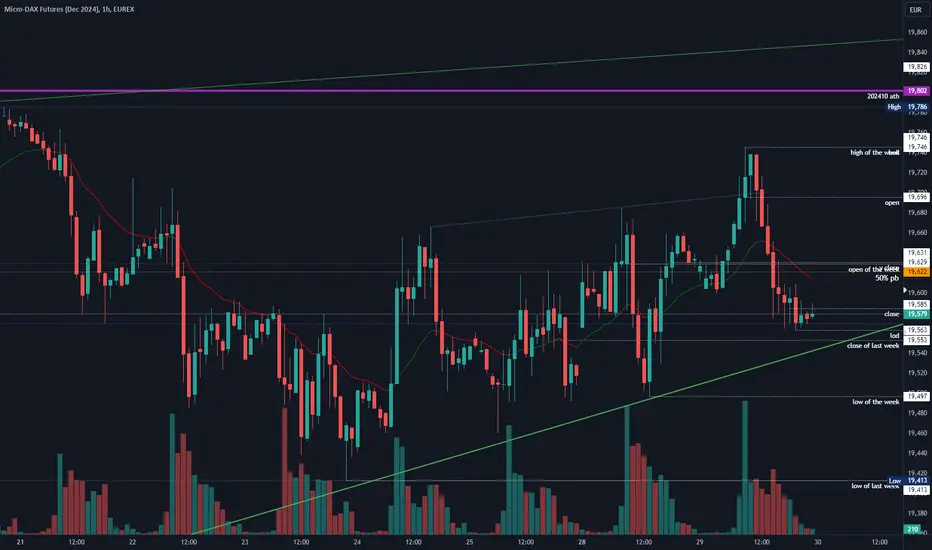
2024-10-30 - priceactiontds - daily update - daxGood Evening and I hope you are well.
tl;dr
Indexes - Many bull trend lines are gone for good. Bears closed at the lows and they desperately need follow through tomorrow. If nq won’t keep the markets afloat tomorrow and drops below 20400, we will likely see a big sell off with 20200 or lower. Dax looks done, clear break of the trend line, swing shorts are juicy here.
dax futures
comment: Daily chart now looks really bad. Next support is around 19000-19100. If bears fail to generate follow through tomorrow, we could retest the bull trend line even up to 19600 again but as of now I heavily favor the bears to go deep red into the weekend.
current market cycle: trading range more likely than start of a bear trend but we only know once we reach 19000 and see if it’s support or not
key levels: 19000 - 19800
bull case: Bulls gave up today after the market failed to print a better close yesterday. Since they have been trying to go above 19800 for so long now, I do think many will wait for a deeper pull back to at least 19000 before buying again. They could try to retest the bull trend line up to 19600 but as of now, it’s a stretch. Got not much for the bulls here.
Invalidation is below 19000.
bear case: Bears now have the best setup in a long time. Clear trend line break and market has tested the highs more than enough. Bears next target is 19000 where we could expect bigger support. 19000 is the previous October low and an exact measured move from the current range down. I will watch futures open in an hour and will likely get on some swing shorts.
Invalidation is above 19620.
short term: Bearish for 19000 if we stay below 19620. My bullish targets are met with this lower high and trend line break. Expecting a deeper pull back before a year end rally.
medium-long term - Update from 2024-10-19: 20000 is the goal for 2024, if bulls do not get it until year end, it will probably not happen for the next 5-10 years. This market is beyond overvalued and will drop 30-50% in the next 5 years. I have no doubts about that. That fact should not be relevant to your trading at all. Right now there is no selling pressure. I am confident that we will hit 17000 in 2025 but timing is more important than price, so let’s not waste brain capital on being bearish for now.
current swing trade: None
trade of the day: Globex marked the high of the day and market just sold off. 19300 was expected to be bigger support and market showed a decent reaction where one should have covered shorts.

2024-10-30 - priceactiontds - daily update - sp500Good Evening and I hope you are well.
tl;dr
Indexes - Many bull trend lines are gone for good. Bears closed at the lows and they desperately need follow through tomorrow. If nq won’t keep the markets afloat tomorrow and drops below 20400, we will likely see a big sell off with 20200 or lower. Dax looks done, clear break of the trend line, swing shorts are juicy here.
sp500 e-mini futures
comment: Bull trend line is now also broken and once market prints below 5800, this is over until year end rally might try 6000 again. Same logic as dax but market is not as bearish after today. Bears need follow through below 5820 and then 5800, if they get it, buckle up. Bulls obviously want to reverse up like the past 2 weeks and trade above 5900 again.
current market cycle: triangle probably broken - entering bigger trading range
key levels: 5800 - 5870
bull case: Bulls need to stay above 5830 or we test 5820, followed by 5800. Today’s close does not look good. Before the close I heavily favored the bulls to reverse this again but then we saw couple of sell spikes which erased the previous lows. Market turns neutral again above 5865.
Invalidation is below 5800.
bear case: Bears need follow through. No surprise. 5800 is the target for tomorrow, once they get it, market is free to fall down to 5730-5740. Interesting day ahead of us.
Invalidation is above 5920.
short term: Leaning bearish if we stay below 5865. Best chance for bears in a long time.
medium-long term - Update from 2024-10-13: Very rough guess for the remaining trading weeks in 2024. Spike up, decent correction (~10%), nasty (blow off top) year end rally if earnings hold in Q4. Don’t trade based on that guess.
current swing trade: Nope
trade of the day: Selling 5880 and buying 5850 has been profitable for many days now. So it was today.

Microsoft (MSFT): Can Earnings Sustain the Trend Channel?With Microsoft set to report earnings, investors are keenly watching updates on AI-related spending, especially growth within Azure and Copilot, as well as broader financials. A significant focus will be on capital expenditures (Capex) for generative AI initiatives, expected to rise from $9.92 billion a year ago to an estimated $14.74 billion in this recent quarter. Beyond revenue and earnings, the market is waiting to see how these hefty investments are shaping the company’s growth trajectory.
Technically, NASDAQ:MSFT continues to test the lower bound of its trend channel—a level that may weaken with repeated retests. The stock’s reaction to earnings will reveal if this support can hold. The formation suggests a potential head and shoulders pattern, particularly if NASDAQ:MSFT dips below the neckline support at $388 with declining volume.
For now, we’re maintaining our cautious outlook. If Microsoft fails to hold its key support levels, it may confirm the bearish trend we’ve been observing. As always, we’ll provide updates if any significant developments occur after the earnings report.

GOLD new era levels, pay attention to today's GDP dataOn Asian markets on Wednesday (October 30), OANDA:XAUUSD delivery maintained its uptrend during the day and the gold price has now reached $2,780/ounce once again refreshing its all-time high and heading towards the target technical point noted by readers in yesterday's publication . OANDA:XAUUSD Continuing its upward momentum from the previous session, spot gold rose more than $32 on Tuesday due to uncertainty over the US presidential election and conflict in the Middle East, as well as expectations of an interest rate cut by the Federal Reserve. Federal Reserve, has enhanced the investment appeal of gold.
During this trading day, the US Bureau of Economic Analysis will release third quarter gross domestic product (GDP) data. This is the most important economic data of the day and is expected to cause big fluctuations. on the financial market in general and gold in particular.
Current market expectations suggest that the initial value of US real GDP in the third quarter is expected to grow at a quarterly rate of 3%.
If GDP data is higher than market expectations, this could cause gold to correct short-term declines or react lower after a long streak of gains and support the USD. On the other hand, GDP data was much lower than expected, which should be supportive for gold and could see it continue to find new all-time highs.
Ahead of the Fed's next policy meeting on November 6-7, traders will need to closely monitor more US economic data later this week including inflation and employment data. could provide direction for the Fed's 2025 outlook. Economists expect the Fed to cut interest rates by 25 basis points next week.
Because gold does not generate interest, it tends to perform better in low interest rate environments and is considered a hedge against market volatility and risk.
According to Bloomberg, the latest news coming from the situation in the Middle East, Israel launched an attack on a residential building in the northern Gaza town of Beit Lahiya on Tuesday, killing at least 93 Palestinians or more. missing. The US called it a "terrible incident".
Regarding the situation in the Middle East, the latest report by Britain's Reuters on Wednesday said that the Gaza Ministry of Health announced that Israel had launched an attack on a residential building in the northern town of Beit Lahiya Gaza on Tuesday, leaving at least 93 Palestinians dead or missing, and 10 injured. Medical staff said at least 20 children were among the dead.
Analysis of technical prospects for OANDA:XAUUSD
The technical chart continues to show that gold has the ability to increase in price comprehensively with the price channel currently trending in the short term. Gold has also had 4 consecutive days of gains after correcting from $2,758, it is heading for the 5th day with an active position that brings a lot of upside prospects.
Currently, gold has broken above the price channel while maintaining price activity above the 0.382% Fibonacci extension, which provides it with room to continue further gains with a subsequent target of around $2,786 Fibonacci price points. extended 0.50% attention to readers in yesterday's edition.
As long as gold remains in the price channel, it will still have a short-term bullish outlook, along with that, once gold breaks above the 0.50% Fibonacci level it can continue to increase further towards the original price level of 2,800 USD, Fibonacci point 0.618% at 2,804USD.
The relative strength index (RSI) has just broken above the overbought area, but has not yet peaked nor shown any signs of weakening, so in terms of momentum, prices can still be bullish with expectations of a correction around the area. The price point area was 2,800 USD when RSI peaked.
During the day, the bullish outlook for gold will be noticed again by the following technical levels.
Support: 2,774 – 2,768USD
Resistance: 2,786 – 2,800 – 2,804USD
SELL XAUUSD PRICE 2801 - 2799⚡️
↠↠ Stoploss 2805
→Take Profit 1 2794
↨
→Take Profit 2 2789
BUY XAUUSD PRICE 2740 - 2742⚡️
↠↠ Stoploss 2736
→Take Profit 1 2747
↨
→Take Profit 2 2752

2024-10-29 - priceactiontds - daily update - daxGood Evening and I hope you are well.
tl;dr
Indexes - Mixed and still undecided. Not one broke out of their patterns today and I expected the breakout last Friday. Dax faked to the upside to sell off to the bull trend line again while nasdaq printed a strong bullish outside bar and is now near the top of the bull wedge. All patterns are still valid and the only constant is that bears are not able to generate follow through selling, so naturally market tries the opposite.
dax futures
comment : Daily chart says it all. Bulls not strong enough to close a day at the highs but bears even weaker and not able to print lower lows. 19600 is the middle of the range and mean reversion pays. I still lean more bullish than bearish for another run at the ath.
current market cycle: late bull trend
key levels: 19400 - 20000
bull case: Bulls broke above the minor bull channel but it was a trap and market sold off to near the bull trend line. As long as this line holds and market makes higher lows, I favor the bulls to retest the ath or go higher for 20000. The current trading range is fairly tight, so there is no deeper meaning to what the market is doing. No side has an advantage and we are waiting for the next impulse. Play the range until it clearly stops working.
Invalidation is below 19490.
bear case: Bears had a decent sell off today but market closed only 40 points lower. Bears need to start printing lower lows but most bears use the lows to cover and scalp out of positions.
Invalidation is above 19750.
short term: Bullish below 19600 for at least 19700. Stop is 19490
medium-long term - Update from 2024-10-19: 20000 is the goal for 2024, if bulls do not get it until year end, it will probably not happen for the next 5-10 years. This market is beyond overvalued and will drop 30-50% in the next 5 years. I have no doubts about that. That fact should not be relevant to your trading at all. Right now there is no selling pressure. I am confident that we will hit 17000 in 2025 but timing is more important than price, so let’s not waste brain capital on being bearish for now.
current swing trade: None
trade of the day: Buying before EU open was good if you were awake. The selling after the open surprised me big time and I absolutely did not expect bears to be able to get all the way down to below 19600. Good for you if you took it. Best trade was obviously selling 19700 and just holding. Was tough to take if you were long before, because the breakout look good enough.
2024-10-29 - priceactiontds - daily update - goldGood Evening and I hope you are well.
tl;dr
Gold - 2800 is close, nothing is stopping this. BTFD. I expect bigger profit taking around 2800.
gold
comment: I gave the 2800 target a long long time ago and we are close. Only question is, where do you enter new longs? We have a decent channel upwards where the lower trend line is around 2760. Market also respected the 1h 20ema today. We have a big bull trend line from July right above us and that should be resistance until clearly broken. I can’t see this breaking above it, so I would rather buy on pullbacks and I do think there is a very good chance we will see a bigger correction once we reach 2800.
current market cycle: late bull trend
key levels: 2750 - 2800
bull case: Bulls want 2800, that’s it. Any pullbacks should stay inside the current channel and not go below 2760. The rally has become climactic and we can expect a pullback/correction soon.
Invalidation is below 2760.
bear case: Bears see the pattern which lead to around 2800 and it’s a big obvious number. Not many want to short this until market has reached it and they see more bulls taking profits. That is why we are currently in a big hurry to get to the target and bears are not fighting it. On the monthly chart this rally is beyond climactic already and I seriously don’t know if Gold ever printed bigger gains in 4 months or even 4 straight big green months at all. This price action is unsustainable and we will see a bigger correction over the next months.
Invalidation is above 2810.
short term: Bullish and you should not look for shorts until we have touched 2800 and bears build much greater selling pressure.
medium-long term - Update from 2024-09-22: Very strong breakout above, again. Market currently has no ceiling. Most likely 2700 next and I do think 3000 could be a potential target if we continue. There is certainly an argument for a measured move based on the bull rally from 2018-08 to 2020-08.
current swing trade: None
trade of the day: Buying the breakout around US open above 2770, which was a textbook breakout and good for 160 ticks. Also legit was buying the 1h 20ema, which could have been more profitable but with more risk since your stop had to be wider.

DreamAnalysis | Identifying Key Triggers For ADA✨ Welcome to Today's Analysis!
Today, I’ll be analyzing ADA/USDT and identifying key triggers for trading opportunities in both spot and futures markets.
📅 Daily Timeframe Analysis
In the daily timeframe, ADA/USDT has been in a prolonged downtrend since reaching a high near the resistance level at $0.6660. After about 200 days of decline, the price has now reached the significant support level of $0.3150. This level has proven to be a crucial area of support, experiencing numerous interactions with candlesticks over time, which has slightly weakened its strength.
🔽 If ADA/USDT breaks below this level, it may drop further to the next support level around $0.2770. This area serves as the last stronghold, and a breakdown here could trigger sharper declines. Conversely, a rebound from the support level could lead to bullish triggers at $0.4041 and $0.4649, though these setups carry higher risk. I will use volume and RSI confirmations for entry to mitigate this risk.
🔼 Currently, the volume appears to be consolidating, indicating limited momentum in the market. A confirmed volume spike alongside a support break would suggest a strong bearish move, while a volume increase on a rebound would signal a potential bullish reversal. The primary bullish trigger would be a breakout above $0.4041 for spot trades, with potential targets at $0.4900 and $0.5700.
⏳ 4-Hour Timeframe Analysis
Moving to the 4-hour chart, we can see that the $0.3150 support aligns closely with $0.3286 in this timeframe. The price has recently bounced off this level and is currently attempting a pullback. If the pullback establishes a lower high, it will validate the breakdown and we can target $0.2770 next.
📉 In the event of a fake-out (where the price breaks support and then re-enters the range), a recovery above $0.3500 would indicate that buyers are stepping in to push the price higher. In this case, we could anticipate a move toward the upper range, with a long position triggered upon a break of $0.3669. A higher high, confirmed by an RSI move above 50, would strengthen the long setup.
📈 If momentum picks up, we can also aim for the key resistance at $0.4123, offering a solid opportunity for an extended long position.
❌Disclaimer
This is not financial advice; it is merely my personal opinion on how the coin might move. Always conduct your own research before making any decisions.
