2024-10-10 - priceactiontds - daily update - daxGood evening and I hope you are well.
tl;dr
dax - Perfect two legged (ABC) correction on the 1h tf and now bulls are free to continue the short squeeze. Buckle up. Bears are only allowed to speak below 19250. If bears manage that, next target would be 19100 and a continuation of the trading range since last Tuesday. My swing long is going.
comment : My line in the sand for the bulls was 19250 and the low was 19276. Bulls now want the third big leg up tomorrow and they have all the reason to assume it will happen. We have a perfect bull trend line, so watch what the market is doing around it and don’t short until it’s broken. I’m full bull here.
current market cycle: bull trend
key levels: 19000 - 20000
bull case: Bulls want the third leg to 19600+. That’s it. As long as the bull trend line holds, it’s bullish. You can either long now or wait on a breakout above 19450 with follow through. Either is fine. Stop is obvious (if not, ask me).
Invalidation is below 19276.
bear case: Bears fumbled it today. Selling was decent but they could not get below the breakout price 19270 and if bulls start the better buying tomorrow, I don’t think we will see much fighting. If bears somehow manage to print below 19250, consider me surprised and that I am wrong.
Invalidation is above 19450.
short term: Max bullish. Stop is still 19250.
medium-long term - Update from 2024-09-01 : 4 Months left in 2024 and I do think the market is in a trading range where the upper area is around 19000 and the lower area is probably 17000 or 16000 if something bigger comes up. Since we are at the very top, I expect the market to go some sideways before trying to go down again. Next 2000 Points will be made to the downside but it’s too early to short this.
current swing trade : Can do long now, 19358 or wait on breakout. Stop is the same.
trade of the day: Selling 19400 was decent I guess but on these days you find the middle of the range and scalp.
Futures

2024-10-10 - priceactiontds - daily update - oiltl;dr
oil - 297 points given to you yesterday. Hope you made some. 76 could be resistance but I can see this printing 78 again tomorrow. Either way, bad place to buy right now. Need better pullback or a buy near the 1h 20ema or bull trend line. I got nothing for the bears here either. They made big bucks and did not fight this much.
comment : Closed the given swing long for around 260. I hope you also made some. Bulls are in control again and I doubt bears want to fight this big time before 77 or higher.
current market cycle: strongest bull trend
key levels: 71 - 80
bull case: At 75.55 I don’t know how deep the pullback can get. Lowest should be around 74. There is a bull trend line and the 1h 20ema is around 75. Above targets are 77/78 and if bulls get wild again, we will print 80 soon. After such wild moves up and down, it’s more reasonable to not expect more extremes and maybe somewhat more contracting prices and sideways movement before the impulse.
Invalidation is below 74.
bear case: They gave up above 74.5 and their next target is to keep the market below 77 and turn more neutral again. I honestly don’t have decent arguments for the bears. They made big points on the pullback and now bulls try again. I would not look for shorts in this.
Invalidation is above 76.5.
short term: Bullish for 77 or higher. Neutral below 74.
medium-long term - Update from 2024-10-06: That bear trend is over and we are again in the big trading range 64 - 78/79. I would update this again if we break above 80 with follow through.
current swing trade: None
trade of the day: Gave you the swing long yesterday at 73.28. That.

TP REACHED ON USOILEarlier today I posted to buy on USOIL and now the market have reached out TP.
Follow for more daily trades!

GOLD recovers moderately after sharp declineOANDA:XAUUSD maintained a moderate intraday recovery after yesterday's sharp decline. Gold price is currently trading around 2,611 USD/ounce.
Minutes of the Federal Reserve's September meeting showed that the vast majority of Fed officials favored a significant 50 basis point interest rate cut. Traders' focus now turns to the US CPI data released today.
Today the US Bureau of Labor Statistics will release the September Consumer Price Index (CPI) report. Investors will focus on this report for more data to evaluate on the US interest rate outlook.
The market expects US annual CPI growth in September to decrease from 2.5% to 2.3%. CPI in September is expected to increase by 0.1% over the previous month, lower than the previous increase of 0.2%.
The annual US core CPI growth rate in September is expected to remain at 3.2%; Core CPI growth rate compared to the previous month in September is expected to decrease from 0.3% to 0.2%.
The market estimates inflation will continue to decline, data equal to or lower than expected would be a very positive signal for gold prices. However, if inflation is higher than the previous period, it will open the door for expectations that the Fed will pause the monetary policy easing cycle and this is not beneficial for gold, boosting the US Dollar.
Analysis of technical prospects for OANDA:XAUUSD
On the daily chart, gold is trying to hold above key technical levels above the $2,600 full price and above the 0.236% Fibonacci retracement level.
Temporarily, the recovery momentum is quite weak, hindered by the EMA21 level. However, conditions still allow gold prices to rise technically with the trend channel not broken below, on the other hand, the Relative Strength Index (RSI) approaching the 50 level, showing some signs of being broken. bend and if RSI points up it will be a positive signal for gold prices.
As long as gold remains within the price channel, it still has conditions to increase in price. In case gold is sold below the level of 2,600 USD, confirmed by the price penetrating the level of 2,594 USD, it will tend to decrease further with the target level being able to reach 2,560 USD, the price point of the 0.382% Fibonacci retracement.
During the day, gold still has a technical outlook that leans heavily towards price increases with notable levels listed below.
Support: 2,608 – 2,600 – 2,594USD
Resistance: 2,618 – 2,634 – 2,660USD
SELL XAUUSD PRICE 2636 - 2634⚡️
↠↠ Stoploss 2640
→Take Profit 1 2629
↨
→Take Profit 2 2624
BUY XAUUSD PRICE 2589 - 2591⚡️
↠↠ Stoploss 2585
→Take Profit 1 2596
↨
→Take Profit 2 2601

2024-10-09 - priceactiontds - daily update - oilGood evening and I hope you are well.
tl;dr
oil - 71.54 has a very good chance of being the low of this pullback. Confirmation is only above 74.7. Tough spot right now. I would not be surprised if Globex starts the pump early. Decent chance we see 76 tomorrow and 78 on Friday. Bears would surprise me below 71 and I do think we would see an even bigger flush below that price.
comment : Yeah I know, oil again. Market is moving the most currently so embrace the volatility. I make it short today. 71.54 has a very good chance of being the low of this pullback. Market could retest 77, so 300+ ticks higher from here. If you would long this now, stop is either 69.8 or 71.5. Both are reasonable. Confirmation for the bulls is above 74.75.
current market cycle: strongest bull trend
key levels: 70 - 80
bull case: Bulls see the 3 legs down and a 200 tick buy from the lows. Next they want follow through to break above the bear channel and they know, bears will have their stops between 74.5 and 74.7. Above is no good resistance until 77 again. On the daily chart we can also see bulls bought the daily 20ema almost to the tick and the bull channel now looks proper. Enough reasons why a long now is a decent trade.
Invalidation is below 71.5.
bear case: Bears had a gigantic pullback and now 2 bigger tails below the daily bars. Are they gonna fight this or do they think they made almost 700 ticks from the highs and it’s probably reversing soon? If you look at the daily chart, you can not come to the conclusion that you want to short 73.35 right now. If we somehow manage to get below 71.5, the bulls case is probably dead but market would likely be more neutral than bearish.
Invalidation is above 74.7.
short term: Bullish with stop 71.5.
medium-long term - Update from 2024-10-06: That bear trend is over and we are again in the big trading range 64 - 78/79. I would update this again if we break above 80 with follow through.
current swing trade: Long 73.28, stop 70.5. Target 77 or higher.
trade of the day: Shorts at 77 which was the big red line and August high. Market spiked and bulls who bought above 76.5 did not even had the chance to exit break even.

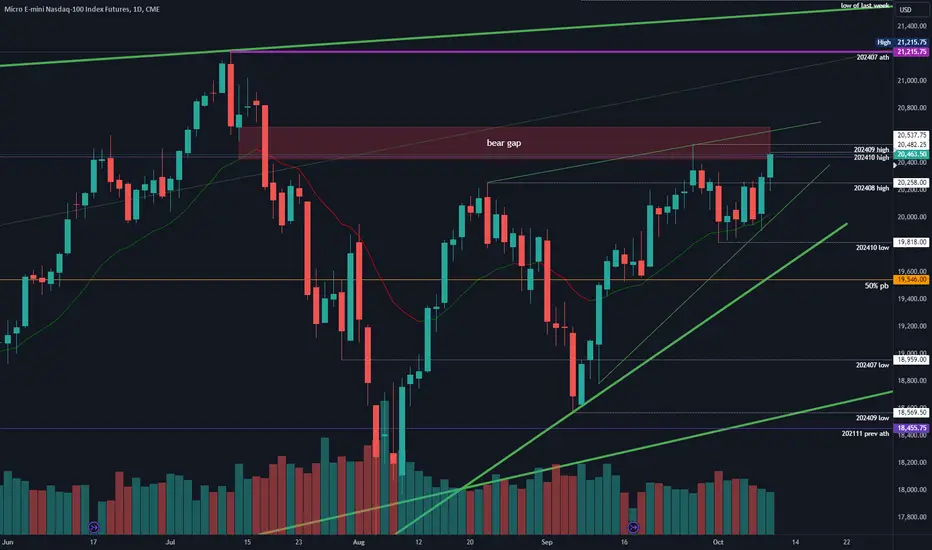
2024-10-09 - priceactiontds - daily update - nasdaqGood evening and I hope you are well.
tl;dr
nasdaq - Same as dax for me. Strong breakout and I do think we will retest 21000. September high is 20537 and there is a possibility, this continues to be resistance ut given the current context, the bulls are favored for higher prices.
comment : Nested bull wedges on the daily chart and the bear gap to 20650 is getting very small. Only resistance left is the September high 20537 and the current breakout looks strong enough to expect higher highs above it and likely a retest of 21000.
current market cycle: Bull trend (nested bull wedges)
key levels: 19800 - 21000
bull case: Bulls prevented the market to close below the daily 20ema for 6 days and today bears gave up. Market refuses to go down and now we will test higher again. Bulls have all the arguments on their side if they stay above 20200. Below their case gets shaky again.
Invalidation is below 20260.
bear case: Bears see the open bear gap to 20650 and the upper bull wedge line around that same price. They will likely try to fight the bulls around that area again but I don’t think they want to risk much at that level. Market refuses to go down and their next best level for good shorts is 21000. If you are looking hard for more bear arguments… Maybe that the current volume is utterly trash and on the 1h tf you have another bull wedge and we are at the high of it. Pullback could go as deep as 20300. Can bears hope for some hot CPI and jobless claims tomorrow? I doubt it but you should not be in positions when the news is released or have really wide stops for your swings.
Invalidation is above 20520.
short term: Max bullish if the pullback stays above 20300. Neutral below.
medium-long term: Very likely a retest of the ath before I expect a correction 10% or more, before another year end rally. Embrace the volatility.
current swing trade : Nope
trade of the day: Long the opening reversal. Was too strong to now long it, no ifs or buts.
TP REACHED ON NASDAQ30 min ago I posted to buy on NASDAQ and the market has reached our TP.
For further questions, don't hesitate to ask!
Follow for more daily trades!

TP REACHED ON CL/US OIL/CRUDE OILYesterday I posted to sell on CL/CRUDE OIL/US OIL and today the market have reached our TP.
For further questions don't hesitate to ask!
Follow for more analysis!

2024-10-08 - priceactiontds - daily update - oilGood evening and I hope you are well.
tl;dr
oil - Good pullback by the bears. Wait and see if bulls buy it and market found a bottom. Pullback could get some more but I doubt it will be much. 72-74 is neutral. Wait for strong momentum to the upside again.
From yesterday:
short term: max bullish but maybe one comment… No matter the reason for the short squeeze, it can turn down again violently and form a gigantic range. So imagine if we retest the breakout price of 72.36. How many traders would be trapped then? Don’t be early.
comment : Low of the day was 72.71. Hope you listened.
current market cycle: strongest bull trend
key levels: 70 - 80
bull case: Bulls got a big pullback which will probably be a great buying opportunity for many who can hold through more pain and scale in lower. Was 72.71 the low for this pullback? Possible but market almost never prints one big surprise bar and then moves in the other direction. Need better confirmation and strong buying again. Targets above are obvious. As long as bulls stay above 71, I think they are good and we will retest 77 and maybe higher.
Invalidation is below 71.
bear case: I don’t think bears did much here. More likely bulls wanted to secure the windfall profits and reduce risk. Are bears shorting 73 now in hopes of an even bigger reversal down to 70? I highly doubt that. The breakout price was retested imo and we can move higher again. Best bears can get is more sideways movement around 73. Bears also had 2 decent legs down. A third one is possible but betting on it might not be that good of a strategy here.
Invalidation is above 75.
short term: Neutral around 73-74. Bullish above 75 and bearish below 70.
medium-long term - Update from 2024-10-06: That bear trend is over and we are again in the big trading range 64 - 78/79. I would update this again if we break above 80 with follow through.
current swing trade: None
trade of the day: Shorts at 77 which was the big red line and August high. Market spiked and bulls who bought above 76.5 did not even had the chance to exit break even.

2024-10-08 - priceactiontds - daily update - daxGood evening and I hope you are well.
tl;dr
dax - Do or die for the bears at exactly at the bear trend line and last weeks close and also Monday’s pullback high around 19260. Above 19290, bulls are favored for a breakout and target 19330 or higher. If we turn here, I expect 19100 or lower.
dax futures
comment: Watch the 30m 20ema tomorrow and see if bulls can hold above it. The 19250-19280 area should be resistance and I favor the bears, once we drop below 19200 again. Bulls want the breakout above 19280 and then a strong move for a retest of 19491 ath. We are near are exactly at two very important trend lines. One is the big bull trend line from early August (please see my weekly post and chart) and the other is the bear trend line from the ath. I expect a huge day tomorrow, once we know who wins the battle. Right now I think odds are 50/50.
current market cycle: bull trend (big trend line is currently at 18950 on xetra) - close below 19000 ends that bull trend
key levels: 19000 - 20000
bull case: Bulls need to break above the bear trend line to stay above the bull trend line and daily 20ema. Market traded the 4th consecutive day around the daily ema and tomorrow we will likely have a huge breakout. If bulls win, we will probably retest the ath.
Invalidation is below 19000.
bear case : Bears are in do or die mode. Either reverse hard and stay below the bear trend line, or give up and see 19400+ again. Both sides showed strength this week and there is no clear direction for tomorrow. Bear case gets better once we trade below 19200 again.
Invalidation is above 19280.
short term: Neutral between 19200 - 19280. Bearish below, bullish above. Best to wait for the breakout tomorrow or Friday but I favor tomorrow.
medium-long term - Update from 2024-09-01: 4 Months left in 2024 and I do think the market is in a trading range where the upper area is around 19000 and the lower area is probably 17000 or 16000 if something bigger comes up. Since we are at the very top, I expect the market to go some sideways before trying to go down again. Next 2000 Points will be made to the downside but it’s too early to short this.
current swing trade: Will swing in the direction of tomorrows breakout
trade of the day: Strong selling through Globex but market made a tripple bottom near 19050 and whenever the market tries to do something 2-3 times and fails, it will likely try the opposite. Long above 19130 - bar 10 was a very good trade.

NF data is coming in, GOLD remains stable with rising channelOANDA:XAUUSD Continuing to maintain the recovery trend with a slight increase in the Asian trading session on October 4, gold is currently trading at 2,661 USD/oz, a slight increase equivalent to 0.21% on the day and about 5 USD as of today. the time the article was completed.
Investors will release the US nonfarm payrolls report, which is expected to cause major volatility in the gold market.
US nonfarm payroll employment is expected to increase by 140,000 in September.
The US non-farm payrolls report for September will be released, this is the most important data this week.
Surveys show the number of nonfarm workers in the United States is expected to increase by a seasonally adjusted 140,000 in September, following a gain of 142,000 in August. US unemployment rate expected will remain unchanged at 4.2% in September.
In addition to changes in overall nonfarm payroll employment and the unemployment rate, investors need to focus on average hourly earnings data, which can provide important signals about inflation. broadcast.
The average annual hourly wage increase in the United States in September is expected to be unchanged from 3.8% the previous month. Surveys show average hourly wages in the United States are expected to rise 0.3% in September, following a 0.4% increase in August.
The September non-farm payrolls report is the next important economic data in the US that could affect Fed policy. If non-farm data is stronger than expected, this could further weaken expectations that the Federal Reserve will cut interest rates sharply in November, thereby pushing the dollar higher and creating pressure. for gold price.
Conversely, if non-farm employment data is lower than expected, this will be a positive signal for gold prices as it will boost expectations that the Federal Reserve will cut interest rates sharply, and cause the currency to US Dollar weakens again.
Analysis of technical prospects for OANDA:XAUUSD
On the daily chart, gold is still trading fairly stable with an uptrend after recovering from corrections and from the support area noted by readers in the previous issue at the lower edge of the price channel, confluence with horizontal support at 2,634USD.
In terms of structure, there are no changes compared to previous publications, still an uptrend highlighted by the price channel and weekly target level at 2,672USD.
Once the $2,672 level is broken above, gold will have room to continue rising a little further with a target then around $2,685.
As long as gold remains within the price channel and above the 0.618% Fibonacci extension at $2,624, it still has a short-term technical bullish outlook. Notable levels are listed below.
Support: 2,645 – 2,634 – 2,624USD
Resistance: 2,672 – 2,685USD
SELL XAUUSD PRICE 2686 - 2684⚡️
↠↠ Stoploss 2690
→Take Profit 1 2689
↨
→Take Profit 2 2684
BUY XAUUSD PRICE 2619 - 2621⚡️
↠↠ Stoploss 2615
→Take Profit 1 2626
↨
→Take Profit 2 2631

GOLD stabilized at the beginning of the weekOANDA:XAUUSD It is still trading quite stably as at the beginning of the week there were no macro data or events that created a shock on the market.
On Tuesday (October 8) in the Asian market, spot gold is currently trading around 2,643 USD/ounce.
OANDA:XAUUSD weakened on Monday due to a significant rise in US bond yields, but gold's decline was limited as geopolitical tensions still had the potential for unexpected spikes.
Gold prices reached a record high of 2,685.42 USD/ounce on September 26. Gold is considered a hedge against economic and geopolitical instability and tends to thrive in low interest rate environments.
Last week's US jobs report reinforced beliefs that the economy is unlikely to require significant interest rate cuts from the Federal Reserve for the rest of the year, with traders currently pricing in There is an 86% chance that the Fed will cut interest rates by just 25bps next month.
The market will focus on the Federal Reserve's policy meeting minutes, as well as US consumer price index (CPI) and producer price index (PPI) data this week.
In addition, China's central bank did not buy gold for reserves in September for the fifth consecutive month.
Analysis of technical prospects for OANDA:XAUUSD
Although gold has had 4 consecutive days of decline, the price declines were not strong and did not create any breakthroughs, as the declines were limited and recovered quickly.
Temporarily, the price drops should only be considered a technical correction without any impact on the main uptrend with the nearest support at 2,634 USD. Note to previous readers.
The main support follows the EMA21 line, with gold recovering above the 2,645 USD price point of the 0.786% Fibonacci level, it will have conditions to set expectations to retest the 2,672 USD level once again.
The relative strength index points down with a very moderate slope, not a significant bearish signal.
In case the $2,634 level breaks below gold there is still some other support from the 0.618% Fibonacci level and the EMA21 moving average.
There is no change in the main trend with price channel as the long-term trend, and notable technical levels are listed again as follows.
Support: 2,634 – 2,624USD
Resistance: 2,645 – 2,659 – 2,672USD
SELL XAUUSD PRICE 2666 - 2664⚡️
↠↠ Stoploss 2670
→Take Profit 1 2659
↨
→Take Profit 2 2654
BUY XAUUSD PRICE 2619 - 2621⚡️
↠↠ Stoploss 2615
→Take Profit 1 2626
↨
→Take Profit 2 2631

BUY NASDAQThe 2nd trade I'm sharing with you today is on NASDAQ, you can buy with the samme TP and SL as placed on the chart.
For more questions, don't hesitate to ask!
Follow for more analysis.

NQ Could Potentially Purge Tuesdays's Lows?
Price looks like it's heading towards Tuesday's Low. We don't have any major news today so I'm not expecting huge movement but, from what price has shown me, it looks like the next draw on liquidity is Tuesday's low.
After price entered and respected the Weekly Imbalance, it displaced lower with energy and retraced back to the 4-hour order block that was responsible for that displacement leg. The first 4-hour order block was respected and price, again, pushed lower creating another 4-hour order block.
Now, it looks like price is drawing towards that second 4-hour order block and if it respects that level, then I would like to see price run lower and take out Tuesday's Low.
I am not a financial advisor. Trade at your own risk. I am only sharing my ideas and predictions of what price could do and I could be 100% wrong. Stay safe!

2024-10-07 - priceactiontds - daily update - sp500Good Evening and I hope you are well.
tl;dr
Indexes - Bears stuffed the bullish price action from Friday with a decent bear bar closing on it’s low. Markets continue in their respective trading ranges near the highs and the daily ema have held again. If bears can generate follow through selling tomorrow, the highs could be in for now and we could see a deeper pullback.
sp500 e-mini futures
comment: 5750 - 5800 is my neutral range (written in my weekly update) and bears managed to get 5734 but could not close below the daily 20ema. To take control of the market, bears need follow through tomorrow below 5720 and a close below 5700 would be good for them. If they fail, bulls will buy it and we continue inside the range.
current market cycle: nested bull wedges
key levels : 5700 - 5850
bull case: Bulls have to stay above the daily 20ema or lose control, that’s their target for tomorrow. Since market is trading below the 1h 20ema, we will probably go more sideways during Globex and EU session before we see a bigger impulse again. Bulls still have the lower wedge bull trend line around 5700 and that would be their last stand before bears can take control and push this much lower again. Odds favor the bulls to stay above 5690 until we tested the trend line more than once. They rarely break on the second/third hit.
Invalidation is below 5690.
bear case: Bears want to trade below the daily ema and test the bull trend line around 5690-5700. We have spent enough time at the highs and a new impulse is around the corner. As of now I have no opinion where we might break out to. Bears can also make the case for a head & shoulders top and a measured move down would bring us to almost exactly the 50% pullback of the recent bull trend (5638ish). Coincidences eh.
Invalidation is above 5850.
short term: Neutral at the daily 20ema. It’s more reasonable to expect more sideways instead of a breakout. When it happens, watch for follow through before you join the trend.
medium-long term - Update from 2024-09-22: Very much like my outlook in dax. Trading range on the daily chart and we are at the highs. We could make higher ones or not. Does not matter much. I expect at least 5300 to be hit again in 2024.
current swing trade: Nope
trade of the day : Globex was bearish enough and once market traded below the 1h 20ema, it could not stay above it for long. Overall I’d say it was a tricky day. Shorting inside the trading range bar 30 - 45 was not a good trade since market just went up and down inside the tight range. Bears showed some strength with bars 45 and 47. Can you then reliably short on bar 50? I doubt it. To weak of a signal and you have the bar 18 low, so you would be shorting low in a potential trading range. Bar 53 was even worse to short, since it was a perfect double bottom with bar 18. Bar 54 was the bar that surely made the market always-in-short and 55 was the give up bar but then market printed one more strong bear bar and reversed for 11 points, trapping late bears.

2024-10-07 - priceactiontds - daily update - oilGood Evening and I hope you are well.
tl;dr
Oil - 16% in 5 days. Alrighty then. No matter your religious beliefs, you can not buy and pray for higher prices. Buying near the 1h 20ema was profitable since last Tuesday but the rally is so climactic that we will very likely see a bigger pullback soon that will be driven by traders taking profits and reducing their risk. Don’t be exit liquidity. Otherwise it’s obviously max bullishness and we can expect a test of 80 soon. Any decent pullback is a good buying opportunity, just don’t buy big bear bars and hope for the best. Wait until market turns up again.
comment : Does not make sense to try to come up with a bull/bear case when the market is doing one of the nastiest short squeezes ever. It’s max bullish and your job now is to evaluate potential spots to get long. No matter how you put it, you can only long this on strong momentum or a decent pullback. The 1h 20ema was profitable for 4 trading days now, look for longs around that price. Can we go higher without a better pullback? Look at the rally 2023-06-28 to 2023-09-28. 3 months of a very strong bull rally and markets always have pullbacks. It could obviously still go higher before a pullback but I would not buy above 77 right now. Market has to form a better pattern for this to be sustainable. Right now it’s a short squeeze and we will soon see a bigger pullback because trader want to lock in profits in order to reduce their risk.
current market cycle: strongest bull trend
key levels: 70 - 80
bull case: Bulls are in control. Don’t look for shorts, can almost certainly only get burned. Potential targets for bulls to begin to take profits are above us. I got two bear trend lines around 77 - 79. I’d be surprised if we straight go for 80 without a better pullback. Any pullback is a good buying opportunity, just don’t long too early and get trapped in a deeper one you can not hold onto.
Invalidation is below 73.
bear case: Get outta here, no bear case.
Invalidation is above 80.
short term: max bullish but maybe one comment… No matter the reason for the short squeeze, it can turn down again violently and form a gigantic range. So imagine if we retest the breakout price of 72.36. How many traders would be trapped then? Don’t be early.
medium-long term - Update from 2024-10-06 : That bear trend is over and we are again in the big trading range 64 - 78/79. I would update this again if we break above 80 with follow through.
current swing trade: None
trade of the day: Long anywhere and have the balls to hold.
