#202524 - priceactiontds - weekly update - wti crude oil futuresGood Day and I hope you are well.
comment: Good week for oil bulls but still a lower high below the April high 78.1. Now what? If this buying is the real thing and market is expecting higher prices for longer, the pullback will stay above 70. If bulls do that, we can expect at least a second leg up to retest 75+ or even 80+. We are seeing a full on war between Israel and Iran but you should not trade based on that. There are bulls who bought above 73 on Friday and lost Money so far.
current market cycle: trading range 54 - 78 on the weekly tf. Decent chance we are in a bull trend that could lead to 80/84 or higher.
key levels: 70 - 77
bull case: Bulls have all the arguments on their side. They now need to leave a big open gap to 69.3 and then we can do a measured move up. My lowest target for that is 80. Structure on the 1h chart is a textbook two-legged pullback and above 74.5 it’s a clear buy signal.
Invalidation is below 70.8 but can likely also be 70
bear case: Bears do not have much. They trapped late bulls on Friday and that’s a likely reason we sold off 677 ticks from the high. They need lower lows below 70.8 and close the gap to the Thursday high before the news-bomb hit. For that to happen they have to break 2 bull trend lines. I will not look for shorts on this tbh.
Invalidation is above 74.5
short term: Bullish. Maybe a bit more sideways but I have given two invalidation prices for bulls and couple of targets above. I don’t think looking for shorts makes any sense unless you are really good at scalping.
medium-long term - Update from 2025-06-15: Maybe we have seen the 2-year trading range coming to an end on Friday and we are in a new bull trend that could lead oil to 80 or higher. Right now it’s pure guesswork until we print higher highs above Friday’s 77.62. Oil above 80 is not something we have seen since end of 2023 so expect some ripples.
Futures

#202524 - priceactiontds - weekly update - nasdaq e-mini futuresGood Day and I hope you are well.
comment: I do think we will continue to print lower highs from 22094. Very clear invalidation price for that thesis is a print above 21855. 21000 is my target for the next days/weeks. A strong daily bear close below the daily 20ema around 21450 would be my confirmation. Above 21855 we continue to chop sideways and could retest 22094.
current market cycle: trading range most likely for now until we have a daily close below 20ema
key levels for next week: 21450 - 21855 (below 21450 - next target is 21000 and above 21855 next target is 22000)
bull case: Bulls outdid themselves by almost completely reversing the strong sell-off on Friday. That certainly was unexpected but now is decision time. Can they keep the market above 21500 a second time? If so, most bears will likely be quick to give up again and we can continue sideways 21500 - 22100 or even higher. Since we did not close below the daily ema, bulls remain in control.
Invalidation is below 21450
bear case: Bears see the bull wedge as broken and want to trade down from here. The top we have formed is a credible double top with ath 22656 and good for swing shorts. Bulls have been given two amazing macro numbers last week, especially the cpi print and we could not break strongly above. Instead we got a spike and it crumbled afterwards. Those are the type of things that don’t happen in bull trends.
Invalidation is above 21855
short term: Neutral for now and I wait for the breakout to either side. I want to favor the bears but they were so weak after the Globex sell spike on Friday, it’s not wise to hope they suddenly become strong.
medium-long term - Update from 2024-06-15: Daily close below 21450 is my validation for the new bear trend which has the first bigger target at 21000 but I think we will printed below 20000 again this year. Structure is obviously not yet bearish, so don’t be early if you want confirmation and can’t/won’t scale in to shorts higher.

#202524 - priceactiontds - weekly update - daxGood Day and I hope you are well.
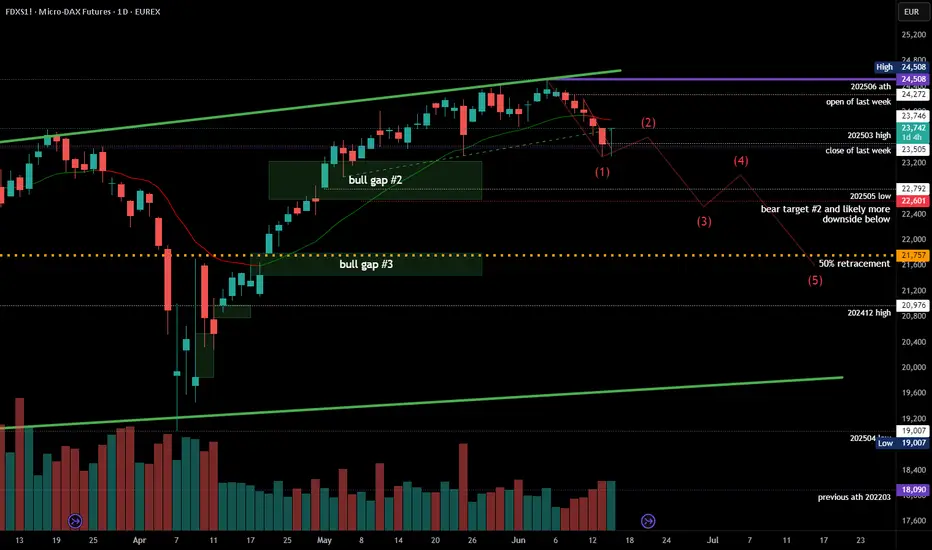
comment: Bears leaving no doubt who is in control of the market now. Volume is picking up on the move down and bear bars are getting bigger. I expect a bit more fighting around 23500 but once we break below, 23000 is the next target and also likely a gap close down to 22600. I have drawn my least bearish wave thesis on the chart where the 50% retracement gets hit over the next weeks. Much more bearish would be the 20000 target. If this selling continues without a pullback, I will adjust the legs.
current market cycle: trading range until we close below 23200 - then we are in the new bear trend. As of now the continuation inside the range is more likely.
key levels for next week: 22600 - 24000
bull case: Got nothing for the bulls but in case we trade back above 23580, we have to assume sideways for longer. I don’t think we can try another new ath after this selling. Bulls found support at the sell-spike from the 50% tariff announcement. If overall markets won’t sell off early on Monday, we can expect some sideways movement before market gets the next impulse up or down. Anything above 24100 would surprise me big time.
Invalidation is below 23280
bear case: 23280 is the price to break for more downside and 23580 is the most important price for bears to prevent the bulls from getting. If 23580 holds, we can do another strong leg down to close the gap 22600. If we go above, the next bear trend line would be around 23950ish and if we get there we will likely test 24000 again. After 5 consecutive bear bars, bulls can not hold longs in hope for another run at the highs. The bear bars are getting bigger and market tested above 24000 enough to know there are not enough buyers. Bulls tried 4 times to 3 times to continue the trend. Selling this top with long term shorts is as good as it gets. On lower time frames I expect a bit more sideways before another leg down.
Invalidation is above 23280
short term: Neutral but only on time frames lower than 4h. W1 has likely concluded but I expect at least a big second leg down to 22600ish. Bears have to keep it below 23580 or we could test back up to 24000.
medium-long term from 2025-06-15: Bull trend has most likely concluded. Long term shorts are fine. Stop has to be at least 24508. I see it 70% or more that we will see 22000 before end of August.
WIF 4H. Make or Break ZoneBINANCE:WIFUSDT The asset is still moving within a defined range and is now brushing against the lower boundary of its structure. This area has historically triggered buyer interest — and if that repeats, we could be looking at a recovery toward $0.97+ in the short term.
However, failure to defend this support could send price cascading down to the $0.58–$0.60 zone.
Given the ongoing uncertainty in global markets, especially due to rising geopolitical tension, any long positions should be executed with tight risk management and a hard stop-loss.
Entry range (EP):
• Market
• $0.8120
• $0.7790
Take-Profit targets (TP):
• $0.8880
• $0.9425
• $0.9765
I’m managing risk carefully and limiting exposure per trade to no more than 2% of my portfolio. This is my personal trading log and not financial advice — always DYOR and trade responsibly.
Let the market decide — I'm prepared either way.
Stay sharp. Stay safe. 🧠📊

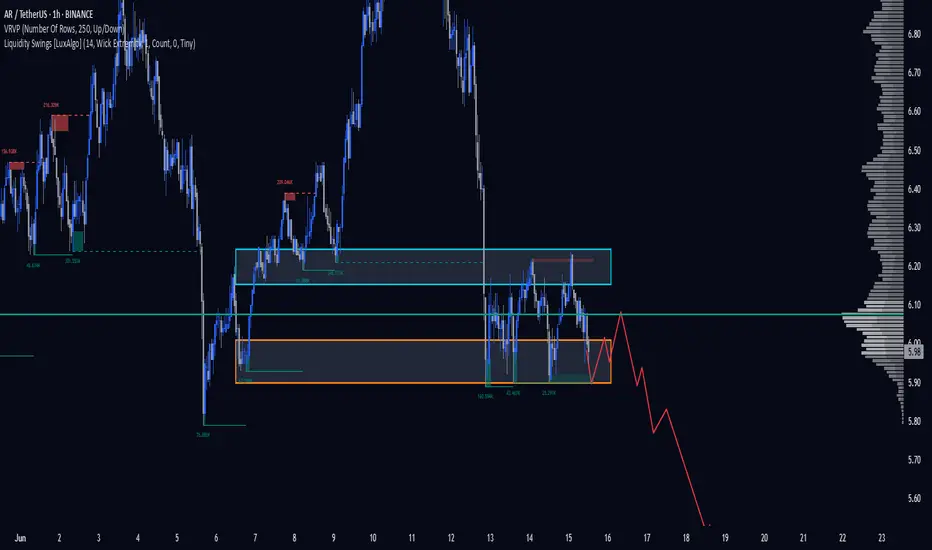
AR 1H. $5.90 Is the Last Line of Defense. 06/15/25BINANCE:ARUSDT If we fail to hold the $5.90 level, this asset could crash hard — potentially entering a deeper downtrend.
DYOR.
Futures RSII will go through why I prefer the 63 RSI to be OHLC4 or HLC3. That's because I think Volume Weighted MA is influenced by the high, low, and close price, so I use either that or OHLC4 after double smoothing it. Watch the 70-30 and oversold levels as a potential reversal play; typically, everything above 35 is bullish and everything below 65 is bearish, with 50 as TP. The most powerful aspect of the RSI lies in finding divergences from the strength of the RSI and the direction of price; that's where the largest trades I have taken were made.

SPY (S&P500) - Price Testing Support Trendline - Daily ChartSPY (S&P500 ETF) price has just closed below $600 and is currently under a support trendline.
If price cannot breakout above the $600 and $605 resistance level this month, a pullback could occur down to the support zone.
SPY price could potentially pullback to various levels of support due to:
-USA domestic conflict
-International military conflicts
-Technical chart bearish divergence
-USA federal reserve interest rate news
-Government and corporate news
Support Levels: $595, $590, $585, $580.
Resistance Levels: $600, $605, $610, $615.
The 50EMA/200EMA Golden Cross is still on-going, and support prices of $580 and $568 have yet to be tested significantly.

ETH ANALYSIS📊 #ETH Analysis : Update
✅As we said earlier, #ETH performed same. Now we can see that #ETH is trading in a bullish flag pattern and its a bullish pattern. We could expect around 10% bullish move if it sustain above its major support.
👀Current Price: $2555
🚀 Target Price: $2815
⚡️What to do ?
👀Keep an eye on #ETH price action and volume. We can trade according to the chart and make some profits⚡️⚡️
#ETH #Cryptocurrency #TechnicalAnalysis #DYOR

BTC - Update on Suspected Flash Crash ScenarioFor those of you who have been following my ideas, and I don’t think that would be many - understandably so, because these ideas seem so outrageous and out of the norm - I feel obligated to provide updated numbers per my own personal trade ideas.
I expect BTC to flash crash. In summary, here is why:
1. DXY is breaking down and retesting a major bearish trendline on the monthly. This alongside geopolitical events and sentiment, I expect the dollar to fall rapidly and store of value assets such as BTC to see a multi year bull run.
2. The market has been steadily bringing BTC up since late 2022. This leaves a trail of long position stop losses below the price, leaving a massive chain reaction of sell orders ready to set off one into the next. In other words, the orders required to make the drop are already in the chart.
3. It’s a question of when - BTC is under 3 intersecting bearish trendlines, and we can see how price breaks above and below these support / resistance levels historically. Eventually they will hold and play out, estimating when is tricky - that’s why I use DXY to predict it.
It’s difficult to pinpoint where the upper resistance is - but a pretty solid pick is around 105,200. I’ve used various numbers in the past for this idea, but it’s always refining and evolving based on what I see price doing.
I’m proposing two movements for a massive liquidation sweep of the lows prior to a 3-5 year bull run where BTC sees those quarter million dollar prices.
Scenario 1:
105,200 to 35,000
35,000 retrace to 77,000 ( although this doesn’t have to happen, I just anticipate a 3 wave corrective move)
77,000 to 10,000 (could be as low as 7,000)
7,000 and upwards of 200,000 (after all liquidity is absorbed and reclaimed)
Scenario 2:
105,200 straight down (for the most part) to 17,000 to 20,000
17-20,000 and upwards to 200,000 plus
Personally I feel scenario one is most likely. I’ve been trading this market since 2017 and the newfound “ stability “ of Bitcoin during the last 2 years cannot be trusted. This upwards move IS NOT a bull run. It’s a BEARISH RETEST.
Bearish retests typically move straight up, exactly as what’s been happening - following by a drop roughly 10 times as fast.
Same ideas on the larger time frames as smaller time frames.
WHEN DO I EXPECT THIS TO HAPPEN?
Starting any minute and spanning over the next several days to week.
Anyway - that’s my update for those of you who are interested.
Understand this stuff gets laughed at - but I experienced the same treatment when I told my group to long BTC at 16,500 in Jan 2023 to a target of 90,000. It’s not new to me and I expect it.
Doing my best to help advise and open your minds to alternative ideas.

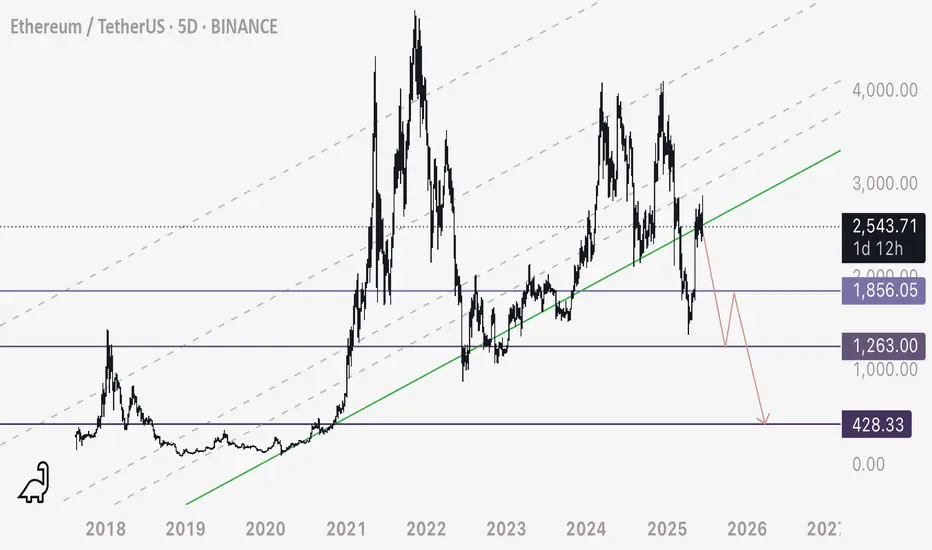
ETH - Another Take - When in Doubt, Zoom OutETH on the multi day time frame appears to have been respecting this ascending series of support / resistances since its inception.
If this resistance holds, this is a major breakdown of ETH’s last support - assuming the chart does work best on these ascending channels (certainly has historically).
Due to this I am shorting ETH at 2550 appx - and my targets are marked on the chart (3 purple levels).
I don’t see why any formation on the chart should be dismissed if it has a strong interaction historically.
Let’s see what happens.
Happy trading
#BERAUSDT #1D (Bitget Futures) Descending wedge on supportBeraChain printed a bullish hammer that may have marked a double bottom here on daily.
Reversal seems around the corner, revisiting 50MA & 100EMA resistances would make sense.
⚡️⚡️ #BERA/USDT ⚡️⚡️
Exchanges: Bitget Futures
Signal Type: Regular (Long)
Leverage: Isolated (2.0X)
Amount: 4.8%
Entry Zone:
2.798 - 2.558
Take-Profit Targets:
1) 3.345
2) 3.848
3) 4.350
Stop Targets:
1) 2.120
Published By: @Zblaba
CRYPTOCAP:BERA BITGET:BERAUSDT.P #1D #BeraChain berachain.com
Risk/Reward= 1:1.2 | 1:2.1 | 1:3.0
Expected Profit= +49.8% | +87.4% | +124.9%
Possible Loss= -41.7%
Estimated Gaintime= 1-2 months

BTC 4H. $104K or Bust — Critical BTC Moment! 06/13/25BINANCE:BTCUSDT remains in a sideways range between $110,336 – $101,297. The main trading volume is concentrated around $103,907.
Recently, the price reached the upper boundary of the range at $110,336 and sharply declined from there — confirming the strength of resistance. The drop was intensified by negative geopolitical news (Israel–Iran tensions).
As a result, BTC retraced into the $104,185 – $101,297 demand zone — a potential area where buyers might step in again.
Personally, I expect one more dip into the $104,185 – $101,297 range to test the strength of buyers.
⚠️ If negative news continues, a breakdown below $100,349 and a new local low is possible.
DYOR.

BTC - On its way down from these trendlines How low can we go? We will find out.
Three bearish intersecting trendlines above.
Short began initiating from above as per my previous post.
I personally am not ruling out a flash crash to 10,000.
DXY is breaking down a major bearish trendline on the weekly / monthly - Market has a prime opportunity to manipulate Bitcoin into all of these long stop losses and trigger a massive liquidation event.
Stay alert and safe!

2025-06-12 - priceactiontds - daily update - nasdaq
Good Evening and I hope you are well.
comment: Neutral around 21900. 21700 was the lowest I expected and we printed 21716.5. Weekly close around 21900 is the most likely outcome for me. We have no acceptance above 21900 and none below 21800 as well. A trend day tomorrow would surprise me.
current market cycle: trading range
key levels: 21700 - 22100
bull case: Bulls want to close the week above 21800 to print a green one. They had spikes above 21900 but nothing else. They are still somewhat in control because we are not making meaningful lower lows and are still at the highs but price action is neutral since last week so no side has the clear advantage. Weekly close above 22000 would be a surprise to me.
Invalidation is below 21680.
bear case: Bears have to close the gap down to 21680 if they want more downside. Until then they have to fade everything above 21900 since that has been profitable for a week now. A weekly close below 21800 would be a decent sell signal going into next week and a clear break of the wedge. Problem for the bears is the same as for bulls on the other side. On the 4h chart we have big tails above and below bars. Market is completely in balance around 21850ish and therefor I expect a weekly close around that price.
Invalidation is above 22100.
short term: Completely neutral. New high or low would surprise me tomorrow. I expect a choppy session where mean reversion will likely be king.
medium-long term - Update from 2024-05-24: Will update this section more after the coming week but in general the thesis is as for dax. Down over the summer and sideways to up into year end. I don’t think the lows for this year are in.
trade of the day: Longing 21730 because it was support all week and the obvious trade.

ATOM. Massive Liquidity Grab Incoming. 06/12/25BINANCE:ATOMUSDT At the moment, the price is in an accumulation phase.
The buyer interest zone lies between $3.806 – $3.601, which also serves as a strong support area. We may see solid spot/futures entries here and the potential start of a new upward move.
What we’re really waiting for is liquidity to be swept in this zone — where tons of stop-losses have clustered. Such a shakeout would be a perfect setup for a bullish impulse.
Spot/futures accumulation is valid within this zone.
DYOR.

BNB 1D Ready to Explode? This Chart Says YES. 06/12/25BINANCE:BNBUSDT is forming a tight consolidation right below key resistance at $710, inside a triangle structure. Every dip into the $655–$625 support zone gets quickly bought up — showing strong buyer interest and accumulation.
Price is compressing inside the triangle with higher lows, indicating bullish pressure. A breakout above $710 would likely trigger a strong move toward $770–$780, and potentially a new ATH > $800.
As long as $625 holds — I'm bullish. I expect one more sweep of support before an explosive breakout.
Spot/futures entries: $655–$625
Targets: $710 → $780 → $820+
Invalidation: Daily close below $625.

1INCH 1D. Showing Signs of Accumulation. 06/12/25BINANCE:1INCHUSDT There's growing media and social media attention around the 1INCH project, which could be a bullish sentiment trigger.
Currently, the price is trading within a descending channel and has recently bounced from the lower boundary, signaling a potential long entry or spot accumulation opportunity.
From current levels, I expect a clean 2x upside on spot. Personally, I think it's worth starting to scale in carefully on spot or futures.
However, keep in mind — even after a bounce, price could still dip slightly lower before any meaningful move up. A deeper correction remains a possibility, so always factor in risk.
📌 Key Takeaways:
• Long bias from current levels
• Potential 2x on spot
• Further dip possible — manage risk accordingly
DYOR. Stay sharp.

DOGE 1D: Missed PEPE? Don’t Miss DOGE 06/12/25BINANCE:DOGEUSDT
I’m expecting a continuation of the upward movement and a possible trend reversal.
There’s a chance we’ll revisit the 0.618 Fib level to shake out weak hands — a classic move before liftoff.
Looking at the chart, it really feels like altseason is closer than anyone expects. DOGE may lead the charge.
Entry Points (EP):
• Market
• $0.19357
• $0.18009
Take Profit (TP):
• $0.22787
• $0.25439
⚠️ My personal opinion only — not financial advice.
Do your own research and remember: all actions you take are your own responsibility. Practice solid risk management and avoid investing more than 2% of your total capital per trade.
DYOR.

ZCU25 CORN... It ALWAYS comes down to cornAND I'M BACK AND DUMBER THAN EVER
Listen up Honkies, this trade has a 93% probability based on the historical data over the last 30 years. So I bet Muhammad my 3rd ex-wife and a half of my second step child. The reason this trade works is easy! We all have felt and understand FUD (Fear, Uncertainty, and Doubt) and how the market reacts, I understood this on my second ex-wife when she got a boyfriend. So in late June pollination season occurs with corn and the yield is unknown for the next year, this is a very simple way of looking at the agricultural industry and how the market corrects. The trade is set up in two stages in order to maximize profit. The first stage, with the FUD in pollination season typically results in a 15-20% drop, I split the difference at 17% lets make it easier than my first divorce. This usually occurs around June 26th and can extend to July 17th. Around July 15th to the 20th the projected yield is shared and the market recorrects to the upside as the numbers represented due to the FUD don't represent the price action in the futures market, and because the futures market is speculatory (Adult Gambling) the degens will pump the contracts up looking for a quick buck like my third wife. Now in order to not go broke while you're trying to buy your ex wife's boyfriend's son a new car, you need to hedge the contract in a calendar spread aka intra-commodity spread, so do the opposite in combination on the march 2026 corn contract as the maintance is lower and the price action isn't there due to open interest in the market, so let that contract ride if it goes against you. SO! you short the ZCU25 while longing the ZCH26, then offset the contracts when direction changes and long ZCU25 and short ZCH26, it's as easy as 1,2,8. Had to repost this forgot the Tags my bad.
"all I need is one trade to pay all the alimony for this year."
-KewlKat

KAS-USDT (Bybit spot), 4-hour candles TA+Trade plan1. Market context & chart structure
Asset / venue / timeframe: KAS-USDT (Bybit spot), 4-hour candles, data to 12 Jun 2025 06:45 UTC (see image).
Primary pattern in play: Price has compressed into a contracting (symmetrical) triangle that began after the 28 May low. The apex is only ~1–2 candles away, so a decisive break is statistically imminent.
Preceding structure:
17-day descending channel → capitulation into a falling-wedge reversal (27–28 May).
Two-legged double-bottom (“Bottom 2”) at 0.075–0.078 USDT.
Sideways rectangle 29 May-7 Jun, now morphing into the present triangle.
Key horizontal levels (4 h closes): 0.0930 (upper triangle rail / neckline) · 0.0891 (local supply) · 0.0797 (strong demand / wedge base) · 0.0620 (monthly support)
Volume picture: Realised volume has been drying up since 31 May, a classic pre-breakout contraction. A spike on the break will confirm direction.
2. Indicator read-out
Market Cipher B - Green momentum wave printing, money-flow bars just turned positive Mildly bullish, Early bull divergence vs 28 May
RSI(14) - 46 and curling up - Neutral-to-bullish Hidden bullish divergence vs price higher-lows
Stoch RSI 26/24 and crossing up from oversold Bullish Momentum reset complete
ArTy Money-Flow Index +3.5 and rising Bullish Positive inflow after five sessions of outflow
Collectively the oscillators favour an upside resolution, provided volume confirms.
3. Scenario probability matrix
Scenario Trigger & confirmation
Option 1 – Uptrend continuation
4 h close ≥ 0.0925 USDT with volume ≥ 2× 20-period average
Measured-move 0.107 → 0.118;
extended fib 1.618 ≈ 0.125–0.128
Est. probability: 60 %
Option 2 – Downtrend resumption
4 h close ≤ 0.079 USDT with similar volume spike 0.072 (range EQ) → 0.067–0.062 structural support
Est. probability: 40 %
Weighting derives from: oscillator bias, shrinking supply above 0.092 (order-book heat-map), but tempered by external models calling for a short-term dip toward 0.067 USDT
4. Trading plan
Component Long (Option 1) Short (Option 2)
Entry Buy stop 0.0926 USDT Sell stop 0.0789 USDT
Initial stop-loss 0.0838 USDT 0.0870 USDT (back inside triangle)
Primary target-1 0.1050 (≈1R) 0.0725 (≈1R)
Secondary target-2 0.1180 (≈2.5R) 0.0670 (≈2.5R)
Position size Risk ≤ 1 % of account per trade (adjust contracts accordingly)
5. Additional catalysts & risk factors
Macro-beta: BTC dominance and broad market risk-on / risk-off could swamp pattern-based setups; monitor DXY and SPX correlations.
Protocol news: Kaspa’s DAG-based roadmap upgrades and potential exchange listings remain upside catalysts. Conversely, lack of progress or regulatory headlines could accelerate a downside break.
kaspa.org
Weekend liquidity gaps: KAS often shows slippage outside US trading hours; consider reducing size or using wide stops if breakout occurs late Friday–Sunday.
6. To sum up
Bias: I lean 60 % toward Option 1 (bullish breakout) provided we get a 4 h close above 0.092 with volume confirmation. Otherwise, a flush to the 0.07 area (Option 2) is the alternative. Trade the break, not the prediction, and keep risk tight.

2025-06-11 - priceactiontds - daily update - daxGood Evening and I hope you are well.
comment: Much more reasons to buy below 23900 than to sell. I do think bulls showed strength today by printing 24193 and this could become a lower low, major trend reversal. Long stops have to be 23750 but there is decent chance could get there as well. I still think they will fail at the gap again and market will close the week closer to 24000 than to 23800. Anything above 24200 tomorrow would be a huge bull surprise and could lead to 24500 again.
current market cycle: broad bull channel
key levels: 23700 - 24500
bull case: Bulls need to keep this a higher low if they want 24500 again. Bulls see the 4 legs down and with today’s huge bull spike, they are likely confident that buying down here is great value. R:R is on their side since the upside is 700 points but they maybe have to risk 200. They reason that what bears wants to sell down here at huge prior support, the bull trend line and the open gap to 23750. Don’t be too early and wait for strong momentum to join.
Invalidation is below 23700.
bear case: Bears outdid themselves for 3 days now, compared to the price action the weeks before. But what now? Big support below us and who wants to sell this? If they see a strong 15m or 1h bar tomorrow, they just have to give up. If they don’t it likely means opex forces institutions to keep the market below 23900 because options need to expire worthless. I would never sell down here. If it goes to 23500, so be it.
Invalidation is above 24550.
short term: Neutral but waiting only for bulls to come around. I think 24200 is much more likely than 23500.
medium-long term from 2025-05-25: My rough guess from early May was down over the summer and up into year end. POTUS certainly helped with the 50% tariffs. I need to see market reaction next week and if there is no 180° reversal until Friday, they will become reality the week after and dax should do 20-30% down over the next months. Markets were not positioned for any risk what so ever. Now we got the atomic trade bomb.
trade of the day: Buying the strong 1hm bull bar 2 hours before EU opened or selling the news spike up to 24193. Both were easy to spot and went for many points without testing above the signal bar.

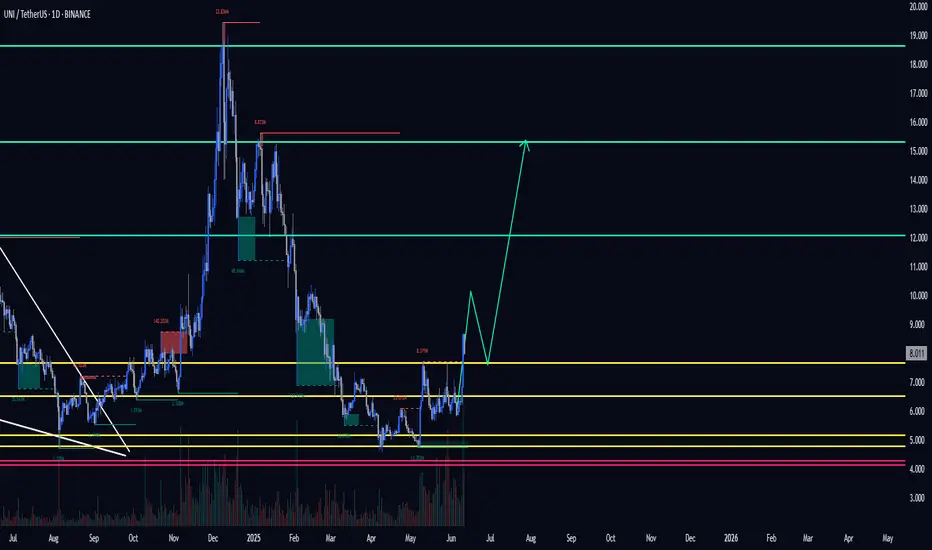
UNI 1D. Breakout Coming? Long-Term Setup Explained 06/11#UNI has been trading in a wide range between $4.072 – $18.634 for the past three years. This is known as an accumulation phase, where large players may be building positions ahead of the next major price move.
After a steep decline, the price bounced off the key support zone at $5.623 – $4.753. It then reclaimed and held above $6.325, a historically high-volume area — a bullish signal.
For short-term entries, I recommend waiting for confirmation above the 100-week moving average (MA100), which currently sits around $7.671. A break and close above that level would suggest a trend reversal.
🎯 Targets:
• $12.063
• $15.305
📥 Mid-term accumulation zone:
• $5.623 – $4.753
• If price drops to $4.072, it could be another solid buy opportunity.
DYOR.
PIXEL 1D. High-Risk, High-Reward Setup. Here's the Play. 06/11BINANCE:PIXELUSDT
Entry opportunity for the bold.
EP (Entry Point): 0.04215$ – 0.04020$
TP (Take Profit):
1️⃣ 0.14072$
2️⃣ 0.16076$
SL (Stop Loss): 0.02280$ or according to your personal risk management.
❗️No stop loss on spot — manage accordingly.
DYOR. Always know your risk.
