How to Draw Support & Resistance In TradingViewLearn how to effectively identify, draw, and utilize support and resistance levels in TradingView with this comprehensive step-by-step tutorial. Whether you're a beginner trader or looking to refine your technical analysis skills, this video covers everything you need to know about one of the most fundamental concepts in trading.
What You'll Learn:
Understanding support and resistance: the foundation of technical analysis and price action trading
Step-by-step instructions for drawing horizontal support and resistance lines in TradingView
Creating support and resistance zones for more flexible trading approaches
Practical tips for using TradingView's drawing tools effectively
This tutorial may be helpful for day traders, swing traders, and investors using TradingView who want to improve their chart analysis skills. The techniques covered could help you make more informed entry and exit decisions by understanding where price might find support or encounter resistance.
Visit Optimus Futures to learn more about trading futures with TradingView: optimusfutures.com
Disclaimer:
There is a substantial risk of loss in futures trading. Past performance is not indicative of future results. Please trade only with risk capital. We are not responsible for any third-party links, comments, or content shared on TradingView. Any opinions, links, or messages posted by users on TradingView do not represent our views or recommendations. Please exercise your own judgment and due diligence when engaging with any external content or user commentary.
This video represents the opinion of Optimus Futures and is intended for educational purposes only. Chart interpretations are presented solely to illustrate objective technical concepts and should not be viewed as predictive of future market behavior. In our opinion, charts are analytical tools—not forecasting instruments. Market conditions are constantly evolving, and all trading decisions should be made independently, with careful consideration of individual risk tolerance and financial objectives.
Futures

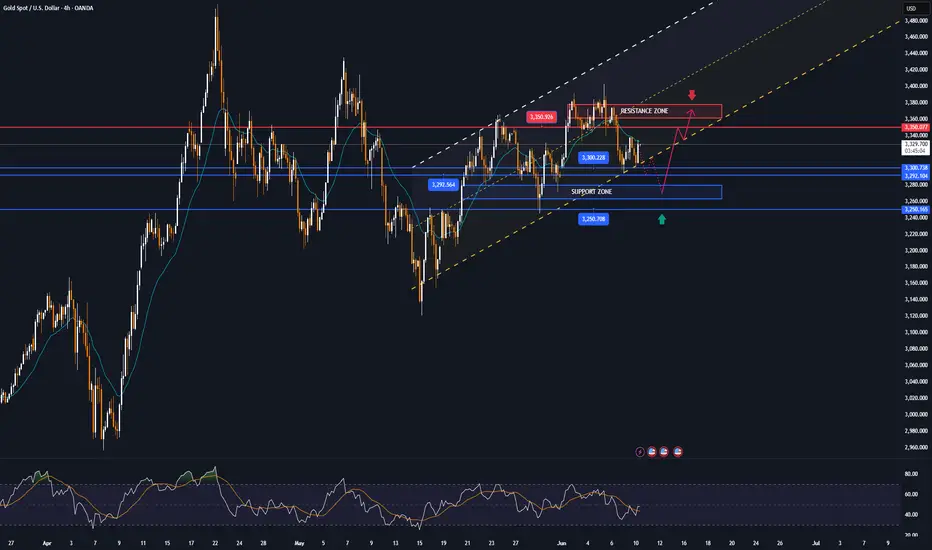
GOLD recovers strongly, market will wait for US CPI dataOANDA:XAUUSD rebounded strongly in Asian trading on Wednesday (June 11) after a sharp decline in the New York session on Tuesday. The current gold price is around $3,341/ounce, up nearly $20 on the day.
Traders are awaiting the release of the latest US Consumer Price Index (CPI) data for May. Estimates suggest that prices are likely to rise as US households feel the impact of tariffs imposed by the Trump administration. As a result, the Federal Reserve is likely to remain in a wait-and-see mode, keeping interest rates in the range of 4.25%-4.50%."
Economists expect the US CPI to rise to 2.5% year-over-year in May from 2.3%, and the core CPI to rise to 2.9% year-over-year from 2.8%.
OANDA:XAUUSD rose in Asian trade on Wednesday, even as the US and China said they had agreed on a plan to ease trade tensions during talks in London.
According to Bloomberg, easing between the world's two largest economies would be negative for safe-haven assets like gold, and the lack of a decline in gold prices suggests investors are waiting for more developments.
Gold prices have risen more than 25% this year as US President Donald Trump’s aggressive tariff policies have changed geopolitical dynamics, prompting central banks to buy gold to divest from US assets.
Bloomberg also said investors are looking ahead to Thursday’s US Treasury bond auction and weak demand could boost gold’s appeal as a safe haven.
Technical Outlook Analysis OANDA:XAUUSD
On the daily chart, after receiving support from the confluence of the EMA21 with the 0.382% Fibonacci retracement, the important support area noted by readers in the previous editions, gold has recovered once again.
The short-term upside target remains unchanged at $3,371 of the 0.236% Fibonacci retracement.
Meanwhile, the Relative Strength Index (RSI) rising from 50 is also a good signal for bullish momentum, and the large gap between the overbought area and the RSI shows that there is still a lot of room for upside ahead.
During the day, as long as gold remains above $3,292, it remains bullish in the short term with targets of $3,371 in the short term, more than the raw price point of $3,400. The positions will also be listed as follows.
Support: $3,300 – $3,292 – $3,250
Resistance: $3,371 – $3,400
SELL XAUUSD PRICE 3376 - 3374⚡️
↠↠ Stop Loss 3380
→Take Profit 1 3368
↨
→Take Profit 2 3362
BUY XAUUSD PRICE 3249 - 3251⚡️
↠↠ Stop Loss 3245
→Take Profit 1 3257
↨
→Take Profit 2 3263

BTC - Be mindful of resistance around 109,800 to 110,000Per my second last post about this red trendline - be mindful that there is a resistance located 109,800 to 110,000 zone.
Although Bitcoin can break above, that doesn’t mean the resistance is invalid. Price will weave above and below until it sticks and plays out.
Personally I watch these levels for sudden fast movement and confirmation that it’s holding as resistance.
If you see a fast drop initiate from these levels, be mindful that this could be indicative of intention to hit the lows around 20,000.
For more information see my previous posts.
Happy trading

2025-06-10 - priceactiontds - daily update - nasdaqGood Evening and I hope you are well.
comment: Range is 21500 - 22000 for a week now. Neutral but selling new highs and buying every pullback has been profitable for quite a while now. It will end some day but likely not today. Bulls finally want the 22000 print and after so many tries they still could not print it. It’s painful to watch. Fading the extremes was good for a month now and I have no bigger opinion on where we might close this week. Anything below 21700 would be a huge bear surprise and could mean the bull wedge break to the downside and next target would be 21500.
current market cycle: trading range
key levels: 21500 - 22000
bull case: Bulls expect 22000 and buy every pullback. Their problem is, that they have tried so so many times now and could still not print it. How many more times will they try? The wedge will break eventually and I highly doubt it will be to the upside. Bulls can not hold long at the highs since pullbacks are 130-500 points big. Look for longs on decent pullbacks once bears give up. Multiple times below 21800 today. When we print 22000, what are the odds of this going higher for 22500 or new ath above 22688? No idea but looking at the wedge and the structure since April, longing momentum makes sense but that’s it.
Invalidation is below 21390.
bear case: Just imagine cpi comes in hot… Bears can only dream. They are doing fine selling new highs and scalping for 100+ points. They are too weak to print lower lows, so don’t bet on them. Once we go below 21700 again, we can look for better targets and market is likely neutral again. Until then, try not to get trapped.
Invalidation is above 22100.
short term: Likely bearish around 21950-22000 for another pullback into 21750/21800. Still expecting 22k to get hit tomorrow. Rough guess: If we move strongly above 22080ish, we could see an acceleration upwards due to short covering from hell but don’t bet on it. Only go with the momentum if it happens.
medium-long term - Update from 2024-05-24: Will update this section more after the coming week but in general the thesis is as for dax. Down over the summer and sideways to up into year end. I don’t think the lows for this year are in.
trade of the day: Longing 21800 was good so many times since Friday.

GOLD drops more than 20 USD, US-China negotiationsIn the early morning trading session on Tuesday (June 10), the spot price of OANDA:XAUUSD suddenly dropped sharply from around 3,328 USD/ounce to around 3,305 USD/ounce.
Bloomberg pointed out that the price of gold fell in the early morning trading session in Asia on Tuesday as both sides in the Sino-US trade talks hinted at their willingness to make concessions.
Easing tensions between Washington and Beijing could reduce the appeal of gold
Senior officials from the United States and China launched the second round of trade talks in London, the first round since the Geneva meeting in early May.
On the afternoon of June 9, local time, the first meeting of the China-US economic and trade consultation mechanism was held in London, UK. On June 10, local time, the first meeting of the China-US economic and trade consultation mechanism will continue.
The US delegation, led by Treasury Secretary Benjamin Bessant, was also attended by Commerce Secretary Lutnick and US Trade Representative Greer. Bessant told reporters in London that they had a “good meeting,” while Lutnick called the discussions “productive.”
Bloomberg reported that the US side had hinted that it was willing to lift export controls on some technology in exchange for China easing restrictions on rare earth exports.
The easing of tensions in the US-China trade war is the main factor currently putting downward pressure on gold, which has risen more than 26% this year.
Gold traders are also looking ahead to this week’s US Consumer Price Index (CPI) data to gauge the health of the US economy and predict the trajectory of the Federal Reserve’s interest rate cuts.
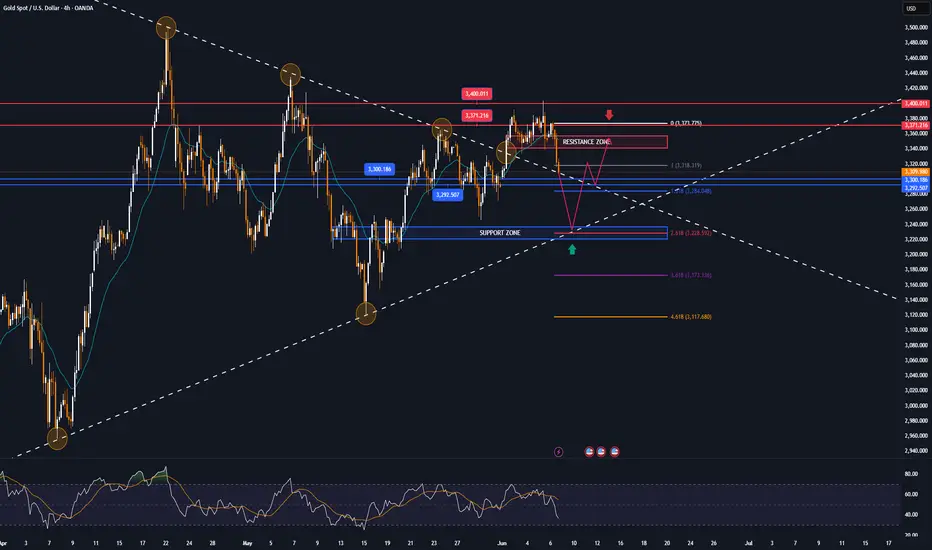
Technical Outlook Analysis OANDA:XAUUSD
After recovering in yesterday's trading session thanks to support from the confluence of EMA21 with the 0.382% Fibonacci retracement, gold has fallen back to test this area in the early trading session today. Gold may continue to face selling pressure in the short term, once the bearish momentum breaks below the 0.382% Fibonacci retracement, then the short term target will be around $3,250 followed by the 0.50% Fibonacci retracement.
However, up to now, the technical position still shows the possibility of increasing prices with the support from EMA21 with Fibonacci retracement 0.382% has not been broken, the recovery target is still at 3,350 USD in the short term, then 3,371 USD, an important resistance level which is also the price point of Fibonacci retracement 0.236%.
Based on the current position, gold still has a bullish outlook with the possible downside mentioned above, and the notable positions will be listed as follows.
Support: 3,300 – 3,292 – 3,250 USD
Resistance: 3,350 – 3,371 USD
SELL XAUUSD PRICE 3367 - 3365⚡️
↠↠ Stop Loss 3371
→Take Profit 1 3359
↨
→Take Profit 2 3353
BUY XAUUSD PRICE 3274 - 3276⚡️
↠↠ Stop Loss 3270
→Take Profit 1 3282
↨
→Take Profit 2 3288
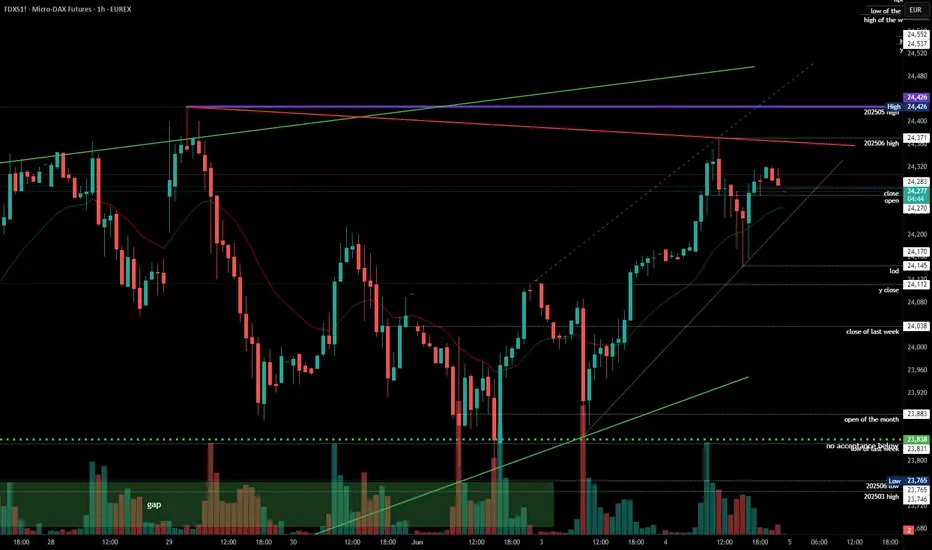
2025-06-09 - priceactiontds - daily update - daxGood Evening and I hope you are well.
comment: Wedge bull flag, I expect 24000 and 24500 to get hit this week, everything above and below those prices would be a surprise to me. We are also forming a triangle with the bull trend line and I expect bulls to get the breakout above.
current market cycle: broad bull channel
key levels: 23700 - 24500
bull case: Bulls making sure the correction is sideways and shallow. They likely want to buy closer to the trend line around 24000 for more value. They want another retest of 24500 and another higher high. Since the trend line is valid and we are comfortably above the daily 20ema, they remain in full control.
Invalidation is below 23700.
bear case: Bears printed a lower low for the past 4 trading days but does the 1h chart look bearish to you? The move down to 24112 has mostly overlapping bars and bulls even printed 5 consecutive 1h bull bars. Those things do not happen in strong bear trends. I expect bears to give up tomorrow. 1h close below 23800 would certainly change everything. This would open the possibility to test down to 23746 and the bigger trend line.
Invalidation is above 24550.
short term: Neutral but expecting bulls to come around strongly closer to 24000 for a re-test of 24500. Only below 23800 I would become bearish and even if we get there, I doubt we would go further down.
medium-long term from 2025-05-25: My rough guess from early May was down over the summer and up into year end. POTUS certainly helped with the 50% tariffs. I need to see market reaction next week and if there is no 180° reversal until Friday, they will become reality the week after and dax should do 20-30% down over the next months. Markets were not positioned for any risk what so ever. Now we got the atomic trade bomb.
trade of the day: Selling 24200 was good for many scalps today but I think the most obvious trade was the long on the EU open sell spike from 24168 up to open price 24272.

SPX500 – Volatile Week Ahead as Trade Talks and CPI LoomSPX500 | Overview
Fundamental Insight:
S&P 500 futures edged lower early Monday as traders brace for a high-impact week.
Key events include:
- US-China trade talks in London (Monday)
- U.S. inflation data (CPI) expected midweek (Wednesday)
Markets are cautious, awaiting clarity from both geopolitical developments and macroeconomic indicators, which could trigger strong directional moves.
Technical Outlook:
The price appears to be entering a correction phase, with the potential to drop toward 5966.
A confirmed break below 5966 may extend the bearish trend toward 5938 and 5902.
However, a break above 6030 would invalidate the bearish scenario and could trigger a bullish continuation toward 6098 and potentially a new all-time high (ATH).
Pivot Line: 6010
Support Levels: 5966, 5938, 5902
Resistance Levels: 6030, 6098

GBPUSD is relatively stable, main uptrendOANDA:GBPUSD performed relatively steady among major currencies. The UK's avoidance of Trump's new steel and aluminum tariffs supported the pound and market sentiment remained relatively upbeat.
The UK releases April GDP and employment data this week, and markets are paying close attention. If the unemployment rate rises, that could drag the pound down; if it shows a healthy labour market, that could push it higher.
Bank of England Governor Bailey said he would continue to adopt a “gradual and cautious” interest rate cut strategy, reflecting a cautious stance amid heightened market volatility. The statement was interpreted by the market as hawkish, which helped support the pound. Britain is not a target of Trump’s new tariff policy, and the market believes that the US-UK trade relationship is relatively friendly, which has boosted the British stock market and the pound.
The fact that the UK is not affected by Trump’s steel and aluminium tariffs is a positive for the pound, but this week’s jobs data will be key. If unemployment rises in April, it could undermine sterling’s gains. The market is positive about the Bank of England’s cautious monetary policy stance, believing that this will help the pound maintain its strength in the short term.
On the daily chart, OANDA:GBPUSD is temporarily capped by the 1.35877 price level of the 0.618% Fibonacci extension and the overall technical outlook remains overwhelmingly bullish.
Key supports are seen by the rising price channel and the EMA21, while the bullish RSI has yet to reach overbought levels, suggesting that there is still plenty of room for GBP/USD to move higher in terms of momentum. As long as GBP/USD remains within the price channel, it will remain bullish in the short term, and once GBP/USD breaks above 1.35911, which is the nearest horizontal resistance, it will be eligible to continue its technical rise towards the next target around 1.37104 in the short term.
During the day, the bullish outlook of GBP/USD will be noticed by the following technical positions.
Support: 1.35015 – 1.34441
Resistance: 1.35877 – 1.35911

Despite some difficulties, EUR is still in an uptrendThe European Central Bank cut interest rates by 25 basis points as expected and said inflation was close to its medium-term target of 2%. Trump's tariff policies have loosened financial conditions, suggesting further easing is likely.
This dovish stance has put some pressure on the euro. Preliminary eurozone CPI data for May showed that inflationary pressures slowed more than expected, dragging the euro down. Germany’s manufacturing PMI for May was weaker than expected, suggesting further contraction in the manufacturing sector; France’s services PMI was better than expected, but still in contraction territory. Eurozone economic data has been mixed. European Central Bank President Lagarde said the monetary easing cycle was coming to an end, boosting market confidence in the euro over the medium term.
But caution will still be needed about the impact of Trump’s tariff policies on the global economy. While the ECB believes trade tensions have eased, the eurozone is not completely out of the woods. If future economic data remains weak, the euro could face downward pressure.
On the daily chart of OANDA:EURUSD after receiving support from the 0.236% Fibonacci retracement level with horizontal support at 1.12038, the recovery momentum has created a significant increase. Specifically, the increase has tested the levels of 1.14744 and 1.14212, please note that in the previous publication about EUR/USD, these levels are also the nearest resistance at present.
However, in terms of the overall technical picture, EUR/USD is still in a bullish trend with a break above 1.14744 opening the door for a new bullish cycle with a short-term target of 1.15720.
Intraday, the bullish outlook for EUR/USD will be highlighted again by the following price points.
Support: 1.13788 – 1.12422
Resistance: 1.14212 – 1.14744

HOOD (Robinhood) - Price Above Bollinger Band and Shooting StarsHOOD (Robinhood) stock price has been in an uptrend since May 2025.
Recent fundamentals such as corporate earnings, EPS, Revenue, Acquisitions have been good in Q2 2025.
However currently, HOOD price has printed 2 shooting stars above the upper bollinger band and linear regression lines (blue arrow).
Potential selling and profit-taking could occur, especially if there is a significant bearish catalyst or news in the stock market.
A -4% or -8% move selloff could occur over time if the price gaps up to an overextended level too fast, such as $80 to $85.
Both the weekly and daily charts are starting to show bearish divergence so I am watching both the technicals and fundamentals this month.

SPY (S&P500 ETF) - Price Attempting Breakout Above ResistanceSPY (S&P500 ETF) price is attempting to breakout above Daily resistance levels of $594 and $597.
SPY ETF has been in an uptrend since May 2025. A Golden Cross also occured on May 19th 2025, signaling that a potential longer term bullish rally could occur.
Friday's candle closed as a Doji signaling some potential indecision after recent price volatility.
SPY price is not at any extreme level on the Daily chart.
If SPY price ever gaps up and rallies up to the $612 to $620 resistance zone, price could sell off stronger (short-term).
In June 2025, trade deal and inflation news will most likely be the catalyst for further volatility, in addition to government news announcements.

#202523 - priceactiontds - weekly update - dax futuresGood Day and I hope you are well.
comment: Last week I wrongly wrote that earnings season will start in June, sorry about that. It’s mid July. So what to do at 24300? Market finds acceptance above 24000 but we have made 500 points to the upside in the past 3 weeks. At some point bulls will let it go and reality will set in. Market is holding above the daily 20ema and until that changes, bears are not favored for anything. Be that as it may, I would rather look for some short scalps closer to 24400/24500 than longing above 24200. For next week I expect 24500 to get hit again, as well as 24000. Anything below 23800 would be a huge surprise though.
current market cycle: bull wedge and on the weekly tf it’s a broad bull channel and we are at the very top
key levels for next week: 23000 - 25000
bull case: Nothing changed so my comment remains the same.
25000 is the next big round number but I highly doubt we get there. I was wrong last week and until we leave bear gaps behind us, bulls are favored for everything because the reality is that buying every dip has been profitable for months now. Bulls have to keep printing higher lows though.
Invalidation is below 23700
bear case: We are basically where we were one week ago, so my comment from last week also applies to the bears.
I doubt we have much more upside in store but we could very well spike to 25000 before we can expect more bulls to stop buying every dip. Bears get spikes and zero follow-through, which leads to many bear traps. Scalping both sides was fine the past 2 weeks but bears have to take quick profits or they vanish quickly. Bears need a daily close below 23700 for more downside and until then, swing shorts are account destroyers. We need a big gap down which does not close to stop the BTFD crowd. So if we get a decent one next week and market only corrects sideways, that will be the trigger for more selling.
One thing that changed is that the current wedge has not a lot more room to go and I think if bulls fail to print 25000 next week (will align with all markets ripping higher), they likely won’t get it,
Invalidation is above 24550
short term: Neutral. Still scalping both sides. Best bears can get is a trading range 23500 - 24500 and anything outside of this range is a surprise. 24550 and higher would be less of a surprise though.
medium-long term from 2025-05-25: My rough guess from early May was down over the summer and up into year end. POTUS certainly helped with the 50% tariffs. Markets were not positioned for any risk what so ever. Now we got the atomic trade bomb. This view has not changed, just the time horizon which aligns better with Q2 earnings and my expectation that we will see the tariff madness coming through. Markets can ignore risks for longer than you can maintain your account but that does not change the reality and if you think this tariff war has a happy ending, you have not paid attention to anyone but the US government or their echo chamber.

#202523 - priceactiontds - weekly update - nasdaq e-mini futuresGood Day and I hope you are well.
comment: Same as last week, markets are all very similar. Nq is also in a wedge right under the big round number. I doubt bears can prevent the bulls from printing 22000 but bulls have certainly tried long enough now. Either they get it next week, or it won’t happen for couple of weeks/months.
current market cycle: trading range on the weekly tf, bull wedge on the daily tf
key levels for next week: 20700 - 22000
bull case: Can bulls find enough buyers above 21900 next week to push for 22000 or even a new ath above 22656? Right now bulls are still favored for everything but that does not mean buying above 21500 is a good trade. If you were to buy right now at 21789, your stop has to be 21720 or better 21655. You would be buying at the very top of an ascending triangle we have been in since Thursday. It’s certainly not a good short but I wouldn’t buy it either.
Invalidation is below 21300
bear case: Bears need to close the gap down to 21300 and then we can talk about the highs being in, maybe. For now they fail at making lower lows and letting the bulls make higher highs. They are selling new highs but market is still grinding higher. For couple of weeks now I have been writing that for bears to change the character of the market, they would need a strong gap down or sell spike and leave an open gap. I do think it’s not bad by the bears that we have still not printed 22000, which everyone expected on Thursday but instead bulls had to give up again and we sold for 700 points. Long story short, bears have nothing and no one would be surprised if we print 23000 next week.
Invalidation is above 22100
short term: Neutral around 21800. Longs closer to the wedge trend line 21600 are likely decent. I expect at least 22000 to get hit before we could maybe turn. Most insane thing would be to see a giant melt-up next week and continuing for 23000 over the next 2-3 weeks. Certainly much higher possibility of that happening than a weekly close below 21000.
medium-long term - Update from 2024-06-07: Market is refusing to go down but I can not see this going much more up. Maybe we hit 22000 maybe we don’t. My assumption is still that latest around mid/end of July we begin to decline over the summer.

#202523 - priceactiontds - weekly update - wti crude oilGood Day and I hope you are well.
comment: Time to be very cautious as a bear and hopeful as a bull. 3 clear legs down and the third could not make a new low. Now the market closed at the weekly high and it’s a fitting place for a reversal. 65 should be the highest bears should allow it. If bulls get follow-through beyond, this is a buy with stop 59.5. The target above 65 is obviously 70 and maybe even the bigger bear trend line around 73.
current market cycle: monthly time frame is a broad bear channel - weekly tf is a bear wedge - daily is a trading range
key levels: 59 - 65
bull case: Bulls got their first daily close above the weekly20 ema since February. Bears tried to get the market below 60 but failed to keep it below - 3 times now since April. Markets will try one thing only so much until they try something else. 65 is the next target which will likely get hit early next week but I expect a bit more sideways until one side clearly gives up. Technically this is a double bottom April/May lows and now a higher low and bulls want to get the major trend reversal.
Invalidation is below 65.5
bear case: Bears are hopeful that the bear wedge is still enough resistance that we test down to 60 but they need a strong reversal below 65 to make it happen and when a weekly bar closes at the very high, it’s probably not a good time to be a bear. Best bears can hope for here is to stay below 65 and continue inside the current range 60-65.
Invalidation is above 65.5
short term: Bullish. I think a bull breakout is much more likely than hitting 60 again. Buying 64.58 with a stop 59.5 is likely a decent trade already. Confirmation for the breakout is 65.5ish.
medium-long term - Update from 2025-06-08: Market finds no acceptance below 60 since 2021 and now we have 3 clear legs down, a higher low and a breakout above prior high with a weekly close at the highs and the weekly 20ema. This is likely as good of a swing long as you can get.

GOLD MARKET ANALYSIS AND COMMENTARY - [Jun 09 - Jun 13]OANDA:XAUUSD fell more than 1% on Friday (June 6) due to the unexpected US non-farm payrolls data for May. Spot gold closed at $3,309.84/oz, up 0.8% on the week.
Although gold failed to break above the $3,400/oz resistance and may fluctuate in the $3,300-$3,400/oz range in the short term, the market's resilience and long-term uptrend remain solid.
Meanwhile, silver and platinum outperformed, hitting 13-year and 3-year highs, respectively, on investment demand and expectations of supply shortages.
Gold prices rose significantly on Monday last week and hovered at highs ahead of the release of non-farm payrolls data from Tuesday to Friday, reaching $3,403.48 an ounce on Thursday.
The latest data showed that the US added 139,000 non-farm payrolls in May, beating market expectations of 130,000, the unemployment rate held steady at 4.2% and wage growth beat expectations.
This reduced the likelihood of the Federal Reserve cutting interest rates in the near future, pushing the US dollar and US bond yields higher and putting pressure on gold prices.
OANDA:XAUUSD received initial support above 3,300 USD/ounce, indicating that the market still has buying support, but the resistance level of 3,400 USD/ounce is difficult to overcome in the short term and 3,200 USD/ounce is the main support level, more detailed technical analysis will be sent to readers in the following part of the article. However, since the raw price points are still related to fundamental analysis, I personally think that the price declines can be seen as an opportunity for gold to hold at lower prices, the long-term uptrend is fundamentally unchanged and central bank gold buying and a weaker dollar will continue to support gold prices.
Despite the rise in risk assets such as stocks, gold has shown resilience. Central bank demand for diversified reserves and market risk appetite will continue to support gold prices, underscoring its appeal as a safe-haven asset.
Market Background and Outlook
The labor market is slowing steadily and the Federal Reserve is likely to continue to wait and see, with the likelihood of a near-term rate cut low. The May CPI data next Wednesday (June 11) will be in focus. If CPI rises, it will push the US Dollar higher and further depress gold prices. If CPI is weak, it could help push gold prices higher.
Geopolitical and trade factors: Trump's call with Xi Jinping on Thursday did not bring any clear progress on trade. If the tariff news worsens, this could boost demand for gold as a safe haven.
On the other hand, the outlook for the Middle East-US, Ukraine-Russia talks is also not getting any better, any negative signs on the geopolitical front next week will also boost gold prices to recover.
Economic data and events next week
Wednesday: US Consumer Price Index (CPI)
Thursday: US Producer Price Index (PPI), Weekly Jobless Claims
Friday: University of Michigan Consumer Sentiment Index
📌Gold prices fell sharply on Friday as it retested the $3,371 target level, which is the 0.236% Fibonacci retracement level, but failed to break it. The bearish momentum took gold towards an area where there are several important supports such as the $3,300 price point and the confluence of the 0.382% Fibonacci retracement level with the 21-day EMA.
Although gold has fallen, its current position still has enough conditions for bullish expectations in the near term. And in terms of momentum, the Relative Strength Index (RSI) is still above 50, and in this case, 50 is considered the nearest momentum support.
As long as gold remains in/above the price channel, its main long-term trend is still bullish, in the short term if gold remains above the base price of 3,300 USD, it still has an upside target at 3,371 USD followed by the base price of 3,400 USD.
Notable technical levels are listed below.
Support: 3,300 – 3,292USD
Resistance: 3,350 – 3,371 – 3,400USD
SELL XAUUSD PRICE 3345 - 3343⚡️
↠↠ Stop Loss 3449
BUY XAUUSD PRICE 3227 - 3229⚡️
↠↠ Stop Loss 3223
Corn at the Cliff Edge: Bearish Breakdown or Smart Money Trap?📉 1. Price Action & Technical Context (Weekly Chart – ZC1!)
Price is currently sitting around 439'0, after rejecting the 462'2 supply zone (gray block) and confirming rejection from the macro supply area between 472'6–480'0 (red block).
The last four weekly candles show a failed recovery attempt (three green candles trapped between two strong red ones), culminating in a bearish breakout below the intermediate demand zone (445'0–442'0).
Now, price is back inside the key demand zone between 439'0–433'4, an area with heavy volume and previous significant lows.
🔍 Technical takeaway: Bearish breakout confirmed. Price is testing the last major weekly support before opening the door toward the yearly lows (~420'0).
📊 2. Commitment of Traders (COT Report – May 27, 2025)
Non-Commercials (Speculators):
Long: 324,377 (▼ -17,952)
Short: 344,710 (▼ -9,171)
Net Position: -20,333 → Bearish, but the unwinding of both sides suggests profit-taking.
Commercials (Institutions):
Long: 766,211 (▲ +12,588)
Short: 713,647 (▼ -962)
Net Position: +52,564 → Increasing → Institutional accumulation.
🔎 Key observation: Commercials are increasing their net longs, while speculators are reducing exposure. This diverges from price action and may signal institutional accumulation under 440.
📉 3. Net Positioning vs Price (COT Chart)
The chart shows a clear decline in speculative longs since March, with a new low this week.
Meanwhile, commercials are gradually increasing their long exposure, positioning themselves against the current bearish trend.
💡 Combined view: While price keeps dropping, the "smart money" is accumulating → possible bottom forming, though not yet confirmed technically.
🌾 4. Seasonality
June Performance:
20-Year Avg: -4.25%
15-Year Avg: +12.31%
5-Year Avg: +1.15%
2-Year Avg: +28.61%
📈 Seasonal Conclusion: The seasonal bias has turned strongly bullish in the last 2–5 years. June–July is often a rally period for Corn following the late-May bottoms — likely tied to U.S. planting season dynamics.

BTC Under Major Resistance HereBitcoin has shown strength towards playing out these ideas, as unrealistic as it may seem.
The interactions at specific levels have shown these trendlines to be valid.
I see two scenarios if BTC holds below its resistance at 104,550 to 105,000
104,600 to 35,000
35,000 retrace to 75,000
75,000 to 7,000
Alternatively:
104,600 to 20,000
Up from 20,000
While these seem like macro projections, per my previous posts and explanations - it’s possible to see this occur in a very small period of time. IE flash crash, stop hunt, etc.
Happy trading.

GOLD recovers to $3,371, biggest data day of the weekOANDA:XAUUSD maintained its intraday recovery trend and the current gold price is around 3,371 USD/ounce, retesting the initial target increase sent to readers in the weekly publication. In this trading day, investors will focus on the US non-farm payroll data, which is expected to trigger major market movements.
Today (Friday), the US Bureau of Labor Statistics will release the highly anticipated non-farm payroll data for May. The market expects 130,000 new jobs and the unemployment rate to remain unchanged at 4.2%.
On Wednesday, the ADP jobs report, also known as the “mini-non-farm,” showed the smallest number of jobs created by the U.S. private sector in two years. The report could be a precursor to a negative non-farm payrolls report.
Payroll processor ADP reported on Wednesday that private sector payrolls increased by just 37,000 in May, down from a revised 60,000 in April and below the Dow Jones forecast of 110,000. It was the smallest monthly job gain since March 2023, according to ADP.
The U.S. Department of Labor reported on Thursday that initial jobless claims unexpectedly rose last week as concerns about the labor market mounted. The data showed initial jobless claims hit 247,000 in the week ended May 31, up 8,000 from the previous week and above the 236,000 expected in a Dow Jones survey.
If non-farm payrolls data released today is much worse than expected, it could weigh on the U.S. dollar and send gold prices soaring.
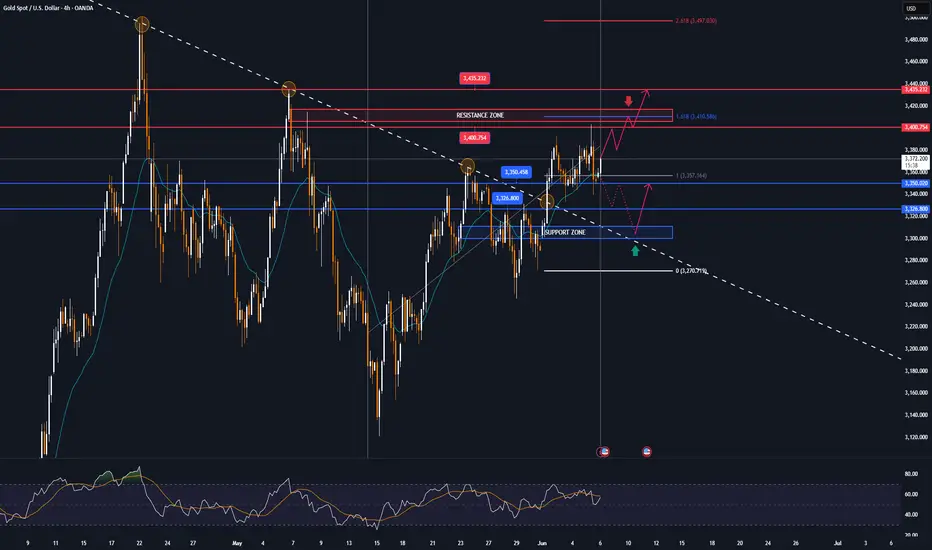
Technical Outlook Analysis OANDA:XAUUSD
On the daily chart, after making a fresh weekly high and correcting lower yesterday, gold has recovered to reach its initial target at $3,371, the price point of the 0.236% Fibonacci retracement.
Following the uptrend, gold is likely to head towards the full price point of $3,400 in the short term, rather than $3,435.
Currently, the technical structure has not changed much with the uptrend completely dominating the technical chart. And the notable price points will also be listed as follows.
Support: 3,350 – 3,326 – 3,300USD
Resistance: 3,400 – 3,435USD
SELL XAUUSD PRICE 3412 - 3410⚡️
↠↠ Stop Loss 3416
→Take Profit 1 3404
↨
→Take Profit 2 3398
BUY XAUUSD PRICE 3301 - 3303⚡️
↠↠ Stop Loss 3297
→Take Profit 1 3309
↨
→Take Profit 2 3315
2025-06-05 - priceactiontds - daily update - nasdaqGood Evening and I hope you are well.
comment: Good day for the bears but if you look at the daily or 4h chart, do you really want to sell this? Of course not. Most traders will wait and see where the bears fail to long this for another try at 22000. Technically we had at least 3 legs up in this wedge and 21936 qualifies as a top. I would still not sell this yet. Favoring the bulls for some bounce, can be higher or lower high. Below 21390 I would be neutral and we could try to test down to 21200 or 21000.
current market cycle: trading range
key levels: 20700 - 22000
bull case: Bulls will likely be eager to buy close to the bull trend line which we have not touched since early Monday. Question then is, will we get a lower high or finally the 22000 print? You never know in advance. What you can know is that selling below 21600 is most likely a bad trade.
Invalidation is below 21390.
bear case: Bears getting more confident in shorting new highs since they make decent money doing so. Until we see 21000 again, they will still likely only scalp and not hold on to positions for longer. The bull wedge is too obvious to hold short and pray for a break. If bears would stay below 21700 tomorrow, that would certainly change their outlook and more bulls would start doubting that we can get to 22000. Daily 20ema is around 21200 and the bull trend line around 21400, those are the next targets for bears.
Invalidation is above 22100.
short term: Neutral but if I had to have a position, I’d be long with stop 21050. I will sit on hands and wait for bears to give up and scalp some longs tomorrow. If bears continue down, it will be without me because I don't like getting trapped.
medium-long term - Update from 2024-05-24: Will update this section more after the coming week but in general the thesis is as for dax. Down over the summer and sideways to up into year end. I don’t think the lows for this year are in.
trade of the day: Longing 21700 was a good trade a couple of times today. You could have made decent money doing so and then getting stopped out on the break below 21630 but that would have been still a profitable day. Get comfortable losing.

GOLD trades around target of 3,371 USD, positive outlookOANDA:XAUUSD rose significantly, retesting the $3,371 target as weak US economic data and a weaker dollar were the main reasons for the rise in gold prices.
The market is also struggling to cope with growing political and economic uncertainties.
OANDA:XAUUSD recovered from yesterday's session low of $3,343/oz after ISM and ADP reports confirmed a slowdown in the US economy. Meanwhile, US President Donald Trump signed an executive order to increase tariffs on steel and aluminum from 25% to 50%, effective from June 4, escalating trade tensions.
Federal Reserve officials remain cautious on easing policy; markets await initial jobless claims and nonfarm payrolls data for further policy clues.
The first major data release on Wednesday, the ADP jobs report, dubbed the “mini-nonfarm,” showed the number of private jobs created in the United States was the lowest in two years.
Payroll processor ADP reported on Wednesday that private-sector job creation nearly stalled in May, hitting its lowest level in more than two years amid signs of labor market weakness.
Jobs increased by just 37,000 in the month, down from a revised 60,000 in April and below Dow Jones' forecast of 110,000.
This was the lowest monthly job gain since March 2023, according to ADP statistics. Following the ADP private sector jobs report, US President Trump immediately urged Federal Reserve Chairman Powell to cut interest rates in a furious manner.
Trump posted on Truth Social: "ADP data is out!!! Powell, who is 'too late', must cut interest rates now."
Trump's order to double tariffs on steel and aluminum imports has taken effect, and the White House has confirmed rumors that it has asked trading partners to submit their "best offer" by Wednesday to avoid higher tariffs.
Gold is considered a safe haven from political and economic uncertainty and typically performs well in low-interest-rate environments.
This Friday, the US Bureau of Labor Statistics will release its highly anticipated non-farm payrolls data, with markets expecting 125,000 new jobs and the unemployment rate to remain unchanged at 4.2%.
Technical Outlook Analysis OANDA:XAUUSD
Gold continues to hit the first bullish target of note to readers in the past 2 weeks at $3,371, the price point of the 0.236% Fibonacci retracement.
Currently, gold is also trading around this level, with price action above $3,371 opening the door for a new bullish outlook and the next target around $3,400 in the short term.
In terms of momentum, gold still has a lot of room to rise as the RSI is operating above 50 pointing upwards but still far from overbought territory, which should be considered a bullish signal in the coming trading session.
There are no technical factors that suggest the possibility of a decline becoming a specific trend, the declines as long as gold remains within/above the price channel should only be considered as a short-term correction or a buying opportunity. Meanwhile, the nearest support is the confluence of the EMA21 with the 0.382% Fibonacci retracement and the short-term trend is highlighted by the price channel.
Finally, the bullish outlook for gold prices during the day will be highlighted by the following positions.
Support: 3,350 – 3,326 USD
Resistance: 3,400 – 3,435 USD
SELL XAUUSD PRICE 3412 - 3410⚡️
↠↠ Stop Loss 3416
→Take Profit 1 3404
↨
→Take Profit 2 3398
BUY XAUUSD PRICE 3299 - 3301⚡️
↠↠ Stop Loss 3295
→Take Profit 1 3307
↨
→Take Profit 2 3313

2025-06-04 - priceactiontds - daily update - daxGood Evening and I hope you are well.
comment: When in doubt, zoom out. Market is leaving gaps below and daily bar closed at the high (at least for futures). Bulls will likely get another spike above 24430 to run the stops but I don’t know if they can get more. Buying above 24200 is there but lackluster but that’s still enough for the bulls because bears are not doing anything, so do not look for shorts. I think we are days away from the top but it’s a rough guess.
current market cycle: broad bull channel
key levels: 23700 - 24500
bull case: Bulls remain in control. There are making higher highs and higher lows. That’s all you need to understand about the current price action. Do not sell this unless you are really really good at reversals. The easy money is buying pullbacks. Do that until we make lower lows. Next targets are 24430 and then 24500.
Invalidation is below 24130.
bear case: Even if bears get below 24130, we have another trend line around 24000 and for now we can not expect bears to just appear. They will likely need an event or market has to spend more time building a credible top before we can reverse.
Invalidation is above 24550.
short term: Neutral. Bulls remain in full control but buying up here is just too easy to get trapped and I will rather wait. 24500 is the next obvious target. I think it’s more likely we are in a trading range 23700 -24500 than getting another strong move above 24500.
medium-long term from 2025-05-25: My rough guess from early May was down over the summer and up into year end. POTUS certainly helped with the 50% tariffs. I need to see market reaction next week and if there is no 180° reversal until Friday, they will become reality the week after and dax should do 20-30% down over the next months. Markets were not positioned for any risk what so ever. Now we got the atomic trade bomb.
trade of the day: Long overnight or EU session for 24400. The short from 24371 was not obvious nor easy to take. Also went much further than I expected it to go. Buying the double bottom 24160 was the second best trade. Market found not acceptance below the 1h 20ema and it was also the Globex low.
GOLD falls then recovers slightly, markets eye jobs dataMainly due to the strengthening of the TVC:DXY , OANDA:XAUUSD have fallen sharply from a near four-week high, with a one-day drop of nearly $30 on Tuesday and a slight recovery in today's Asian trading session on Wednesday, June 4.
DXY rebounded from its lowest level in more than a month hit earlier in the session on Tuesday and ended the day up 0.6%, which put some minor pressure on gold in yesterday's session. The U.S. Bureau of Labor Statistics' Employment and Labor Turnover Survey (JOLTS) released on Tuesday showed that total job vacancies in the United States reached 7.39 million in April, up from 7.2 million in March. Economists had expected job vacancies in the United States to be 7.1 million in April.
OANDA:XAUUSD fell on Tuesday as a surprise rise in U.S. job vacancies boosted risk appetite and helped the dollar strengthen, according to Bloomberg. The rise in job vacancies encouraged investors to believe that the U.S. economy remains resilient despite the threat of U.S. President Trump’s tariff agenda.
Looking ahead, U.S. employment data, including Friday’s May nonfarm payrolls report, could help guide the Federal Reserve’s monetary policy, Bloomberg said. Lower interest rates are generally good for non-interest-bearing gold.
Gold traders will be looking ahead to key employment data, including the ADP and nonfarm payrolls reports, to determine the Fed’s policy path.
In terms of technical structure, there are no changes to the chart or previous analysis so readers can review it in the previous publication.
SELL XAUUSD PRICE 3412 - 3410⚡️
↠↠ Stop Loss 3416
→Take Profit 1 3404
↨
→Take Profit 2 3398
BUY XAUUSD PRICE 3299 - 3301⚡️
↠↠ Stop Loss 3295
→Take Profit 1 3307
↨
→Take Profit 2 3313

Technical Analysis – HBAR/USDT + TRADE PLANTechnical Analysis – HBAR/USDT (Daily Chart as of June 4, 2025)
Chart Pattern: Falling Wedge (Bullish)
The chart indicates a classic falling wedge pattern, often interpreted as a bullish reversal signal.
This pattern is marked by descending converging trendlines, suggesting declining volatility and potential breakout.
Breakout point is illustrated just above the wedge’s resistance line, with a bullish breakout expected.
Key Support & Resistance Levels
Immediate Support Zone: $0.1625 – $0.1723 (blue zone)
Primary Resistance Targets:
Short-term: $0.1849 (top of Bollinger Band)
Mid-term: $0.2070 – $0.2200
Long-term: $0.3400 (strong historical resistance)
Indicators Summary
Bollinger Bands: Price near the lower band, indicating potential upside volatility.
Volume Profile: Slightly increasing near wedge apex, often a precursor to a breakout.
VMC Cipher_B: Multiple green dots signal bullish divergence; momentum may be reversing upward.
RSI (14): Currently recovering from oversold territory (~39.5), suggesting bullish momentum building.
Money Flow Index (ArTy): Moving back into the green, indicating capital inflow and potential accumulation.
Stochastic RSI: Crossed upward from oversold zone (currently ~23), a common signal for trend reversal.
Trading Plan
Long Position Setup (Swing Trade)
Entry Zone:
$0.1650 – $0.1725 (upon retest of breakout from wedge or candle close above wedge resistance)
Stop-Loss:
$0.1580 (below wedge support and key structure low)
Take-Profit Targets:
TP1: $0.1850 (Bollinger Band and resistance zone)
TP2: $0.2070 (resistance from March 2025)
TP3: $0.2200 – $0.2400 (target zone for full wedge breakout)
TP4: $0.3400 (macro-level resistance, if rally continues)
Risk-to-Reward:
Minimum R:R of 1:2.5 to 1:5 depending on TP level.
⚠️ Risk Management & Strategy Notes
Wait for confirmation breakout candle with strong volume above wedge resistance before entering.
Scale in gradually between $0.1650–$0.1725 if confirmed.
Trail stop-loss after reaching TP1 to lock in profits.
Monitor Bitcoin price trend and overall market sentiment—HBAR tends to follow macro market structure.
The combination of the falling wedge, bullish divergence, and oversold momentum indicators supports a strong potential for bullish continuation. However, conservative confirmation is essential before committing capital.
Outlook: Bullish bias, pending confirmation breakout above the wedge resistance.
