2025-05-28 - priceactiontds - daily update - dax
Good Evening and I hope you are well.
comment: Higher highs and higher lows. Focus on the easy trades. Can only get bearish with consecutive 15m or 1h bars below 24000 and for now that is unlikely. Bulls bought 24000 the whole week so look for longs.
current market cycle: broad bull channel
key levels: 23000 - 24500
bull case: As long as the bull gap 23700 - 23900 stays open, I would only look for longs. 24500 is the next obvious target and it’s not impossible that markets do a complete meltup tomorrow. Structure is a clear bull channel until we print below 24000.
Invalidation is below 23900.
bear case: Bears need something below 24000 again, that means lower lows. Right now bulls remain in full control and I doubt we can go from daily new ath to a big reversal down. I got nothing for the bears here.
Invalidation is above 24550.
short term: Neutral but would only trade long until we see much better selling pressure and prices below 24000.
medium-long term from 2025-05-25: My rough guess from early May was down over the summer and up into year end. POTUS certainly helped with the 50% tariffs. I need to see market reaction next week and if there is no 180° reversal until Friday, they will become reality the week after and dax should do 20-30% down over the next months. Markets were not positioned for any risk what so ever. Now we got the atomic trade bomb.
trade of the day: Short since the bull trap on the open but I did not take it. I thought chances of a reversal were too high for me. I was wrong but that’s ok.
Futures

CL Analysis – May 28, 2025Currently, I believe Crude Oil (CL) is trading within a well-defined range. My strategy is clear:
🔴 Sell only at the red supply zone above, but only after confirmed seller reactions backed by order flow.
🟢 Buy only at the green demand zone below, once buyer strength is confirmed through price action and order flow.
No trades in between — I’m staying patient and letting the market come to my levels.

Pancake swing tradePancake is getting ready to release all the pressure that was build up inside of it.
we have vast amount of liquidity above us that we need to take.
Get ready! 🚀🌕
(You have the full responsibility for each action that u take because I'm not your financial advisor)

Narrow trading range, medium and long term outlook is bullishGeopolitical tensions have pushed gold prices higher, with the medium- to long-term outlook still pointing to upside potential, and a recovery in Chinese demand could provide potential support.
OANDA:XAUUSD edged up in early Asian trade on Tuesday. Russia recently launched its largest-ever drone and missile attack on Ukraine, ignoring President Trump’s call to stop the bombing, according to Ukrainian officials.
Gold prices fell nearly 1%
On Monday, international gold prices were under pressure and fell nearly 1%. Affected by US President Trump's decision to postpone the imposition of a 50% tariff on EU goods, the market's risk-off sentiment has cooled significantly, and the appeal of gold as a traditional safe-haven asset has weakened.
The most actively traded June 2025 gold futures closed at $3,342.2/ounce, down $23.6 (-1.45%) on the day, with intraday fluctuations ranging from $3,322.9 to $3,356. Due to the Memorial Day holiday in the United States, COMEX did not announce settlement prices on that day, and the UK and US markets were closed at the same time.
Policy changes affect short-term trends, narrow-range trading is likely to bring big changes
Trump’s extension of the US-EU trade talks deadline from June 1 to July 9 has directly undermined the market’s safe-haven demand for gold. The holiday-induced liquidity crunch has further exacerbated price volatility.
The move is in stark contrast to gold’s performance last Friday, when the OANDA:XAUUSD price recorded its biggest one-day gain in six weeks as Trump threatened to impose tariffs on EU goods and Apple’s iPhones.
Geopolitical risks have not disappeared and institutions remain bullish on the outlook
Reasons include the ongoing changes in US tariff policy, the continued escalation of the Ukraine geopolitical crisis and fiscal concerns. Data shows that Russia has launched airstrikes on Ukraine for three consecutive nights, including the largest attack since the conflict began in 2022, and the intensity of the war has not abated.
With what is available in terms of trade, geopolitical and monetary policy risks, gold still has a lot of upside potential in the coming period.
China’s demand is showing signs of recovery, which could be the latest factor
The latest trade data showed that mainland China’s gold imports via Hong Kong in April hit their highest level since March last year. The recovery in physical gold purchases in Asia could support lower gold prices, especially amid increasingly volatile investment demand in the West.
Technical Outlook Analysis OANDA:XAUUSD
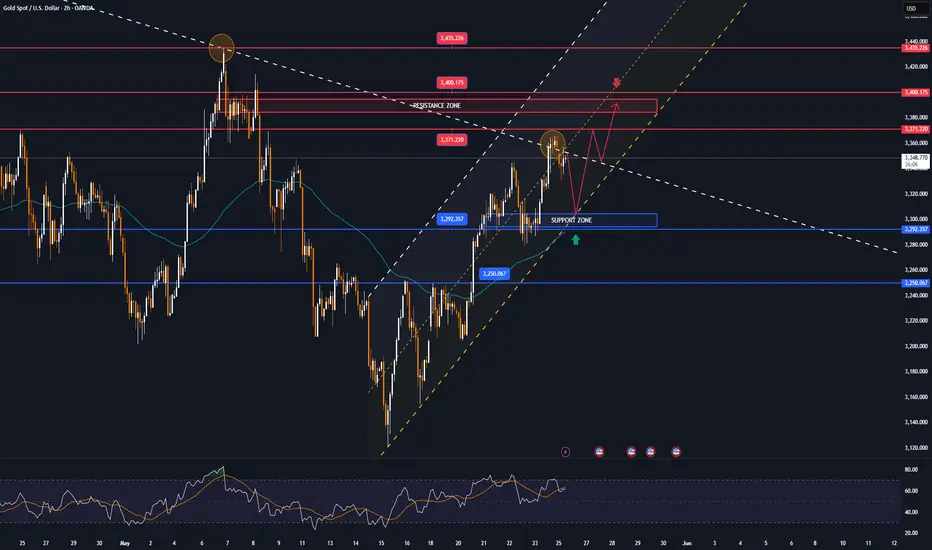
Gold traded in a fairly narrow range in the early Asian session today, Tuesday (May 27), with technical conditions still leaning towards the upside, with spot gold currently trading around $3,341/oz. After falling from $3,371, the target price point is the price point of the temporary 0.236% Fibonacci retracement. The bullish momentum of gold prices remains unaffected as the nearest support is the confluence of the (EMA21 with the 0.382% Fibonacci retracement).
On the other hand, the Relative Strength Index (RSI) remaining above 50 should be considered a positive signal as the RSI is still quite far from the overbought zone indicating that there is still room for upside ahead.
Next, if gold breaks above $3,371 it will be in a position to continue its rally towards the short-term target of $3,400, more so $3,435 and then the all-time high of $3,500.
As long as gold remains above the EMA21, it still has a short-term bullish outlook, and the long-term trend continues to be noticed by the price channel.
During the day, the gold price's bullish trend will be interested by the following technical positions.
Support: 3,300 – 3,292 – 3,250 USD
Resistance: 3,371 – 3,400 – 3,435 USD
SELL XAUUSD PRICE 3391 - 3389⚡️
↠↠ Stop Loss 3395
→Take Profit 1 3383
↨
→Take Profit 2 3377
BUY XAUUSD PRICE 3283 - 3285⚡️
↠↠ Stop Loss 3279
→Take Profit 1 3291
↨
→Take Profit 2 3297

CL Futures Outlook May 27, 2025 Compression Near Structure ZonesToday, CL is trading just above a key mid-structure zone, continuing its sideways movement between defined supply and demand levels.
🔹 Current Technical Picture:
Price remains inside a compression range
Resistance at the top red zone where price was rejected yesterday
Mid green zone acting as current structure support
Lower green zone marked by last week's strong buyer reaction
Volume profile is neutral, showing no aggressive buyer or seller dominance at the moment. A failed breakout attempt above the descending channel in the previous session keeps this structure coiled and reactive.
🔍 My Outlook:
If price retests the middle zone with strong volume + bullish reaction, it could offer a continuation toward resistance.
If price climbs into the red zone and rejects with weakness, there’s potential for a move back toward the middle zone.
A sharp drop into the lower green zone with strong buyer confirmation would create a high-reward reversal opportunity.
No trades are taken blindly. I only act when price shows clear intent at key levels. Today is a reactive environment — not one for forced setups.
📉 Analysis based on volume structure, order flow, and key S/R zones.
⚠️ This post is for educational purposes only and does not constitute financial advice. Trading futures involves risk.

Bajaj Hindusthan Sugar LtdBajaj Hindustan (Ethanol/Sugar Company)
if it sustain above 23 then I'm bullish in this for 1000% gain.
It'll going to give 13 years breakout.
Keep an eye on this.
NOTE: We are not SEBI registered. It's for knowledge purpose only. Consult to your financial adviser before take any trade.
MAY 27 , 2024
Note
entry trigged add half and more on weekly candle close above 23

2025-05-26 - priceactiontds - daily update - dax
Good Evening and I hope you are well.
comment: Back where we started on Friday and I do think one more big leg down will finally be enough for the persistent btfd crowd to scale it down a bit. So far it has been profitable and that’s why bears need a big gap that does not close or otherwise we just continue sideways to up. Bulls need to get trapped for this to end.
current market cycle: broad bull channel
key levels: 23000 - 24300
bull case: Watch the 1h 20ema tomorrow. If we stay above, we can make another ath and it’s possible we see more upside above 24200. Since all my bull targets are met and I have no interest in buying this, I won’t be your guide in looking for longs here. I think buying above 24000, while we wait for 50% tariffs to the US, qualifies for most stupid the trade of the year. I’m happy for you if you make money on any side though.
Invalidation is below 23300.
bear case: Even if tariffs won’t be 50% and only 10%, it would still mean less business for everyone. Markets are not pricing the risks right and are begging to get rug pulled. Only a couple times a year markets are so miss-aligned with reality that in hindsight you feel unwell for not risking more. Having said that, now is not the time to short. We need way more selling pressure again. Wait for big bears to appear. Below 23900 we could see a test of 23800 but it will likely be an easy trap for bears so only take it if we either move very strongly down or if we move down over a long time without any decent bounce up.
Invalidation is above 24300.
short term: Neutral. Sitting on hands until bulls run for the exits and big bears come out.
medium-long term from 2025-05-25: My rough guess from early May was down over the summer and up into year end. POTUS certainly helped with the 50% tariffs. I need to see market reaction next week and if there is no 180° reversal until Friday, they will become reality the week after and dax should do 20-30% down over the next months. Markets were not positioned for any risk what so ever. Now we got the atomic trade bomb.
trade of the day: Long since Globex open. Tough.

GOLD rises impressively after mid-May declineUS President Trump once again used tariffs and the market's risk-off sentiment suddenly heated up. OANDA:XAUUSD jumped nearly 2% on Friday and the weekly gain reached nearly 5%.
OANDA:XAUUSD has grown impressively after a sharp decline in mid-May, taking advantage of safe-haven flows, the recovery was mainly due to growing investor concerns about the sustainability of US government debt. The market will likely continue to react to headlines surrounding the difficult US fiscal situation, trade relations and geopolitics.
On Friday local time, US President Trump said on his social media platform "Real Social" that he proposed to impose a 50% tariff on the European Union from June 1. Trump wrote that the main purpose of the establishment of the European Union was to "take advantage of the United States on trade". In addition, on Friday local time, Trump posted on "Real Social" that he had long told Apple CEO Tim Cook that he expected Apple's iPhones sold in the United States to be produced and manufactured in the United States, not in India or anywhere else. Trump said that otherwise, Apple would have to pay at least a 25% tariff to the United States.
Assessing the situation surrounding Trump
"Trump has been vocal in the past 24 hours, threatening to impose 50% tariffs on the European Union starting June 1, imposing major sanctions on Apple and taking on Harvard University, all of which have weighed on stocks but boosted gold prices.
Recurrent tariff concerns, coupled with low liquidity ahead of the long weekend, could exacerbate volatility."
Technical Outlook Analysis OANDA:XAUUSD
On the daily chart, gold has achieved its initial upside target at $3,371 which is the technical confluence of the 0.236% Fibonacci retracement with the upper edge of the price channel after receiving support from the confluence of the EMA21 with the 0.382% Fibonacci retracement.
In the short term, if gold breaks $3,371 it will tend to continue its bullish trend with the next target being $3,400 in the short term, more so than the last $3,435 which is the all-time high of $3,500.
As long as gold remains within/above the channel, the overall trend outlook is bullish, and the immediate support is currently around the $3,300 raw price point area with the 0.382% Fibonacci retracement level and EMA21. In case of a sell-off below $3,292, gold could still find short-term support at the $3,250 technical point and the 0.50% Fibonacci retracement level.
In terms of momentum, the Relative Strength Index (RSI) is pointing up from around the 50 mark, with the RSI still well above the overbought zone, suggesting room for further upside.
Looking ahead, the overall technical outlook for gold is bullish, with key points to watch out for as follows.
Support: $3,300 – $3,292 – $3,250
Resistance: $3,371 – $3,400 – $3,435
SELL XAUUSD PRICE 3391 - 3389⚡️
↠↠ Stop Loss 3395
→Take Profit 1 3383
↨
→Take Profit 2 3377
BUY XAUUSD PRICE 3299 - 3301⚡️
↠↠ Stop Loss 3295
→Take Profit 1 3307
↨
→Take Profit 2 3313
GOLD MARKET ANALYSIS AND COMMENTARY - [May 26 - May 30]This week, the price of OANDA:XAUUSD increased from 3,204 USD/oz to 3,365 USD/oz, and closed the week at 3,357 USD/oz.
The reason for the increase in gold price this week is due to:
🔹Moody's downgrades US credit rating, causing USD to fall.
🔹Unsuccessful US bond auction raises concerns about economic instability.
🔹President Trump threatens to raise tariffs on European goods, raising concerns about trade war.
🔹Escalating tensions in Ukraine, Middle East, increasing demand for safe haven gold.
Gold prices next week may fluctuate in both directions, meaning they will adjust and accumulate to wait for the results of US-China trade negotiations, US economic data, and whether Mr. Trump will decide to impose tariffs on Europe or not?
Next week, the US will release many important economic data, including:
➡️Durable Goods Orders (Tuesday),
➡️Minutes of the FED's May Policy Meeting (Wednesday),
➡️PCE Inflation Index (Friday).
With the Trump administration's tariff policy, inflationary pressures in the US have been under a lot of pressure. If the core PCE index in April increases more than expected, it may cause the FED to continue to keep interest rates unchanged at its July meeting. In this scenario, the USD may increase again, causing gold prices to be under pressure to adjust next week. However, gold prices next week will hardly decrease sharply if the PCE increases, because gold prices next week are still supported by other factors such as tariffs, geopolitical conflicts, etc.
📌Technically, on the H4 chart, gold prices are starting to break the Downtrend line and tend to move closer to the resistance level of 3432. Meanwhile, support is established around the dynamic resistance level of 3300. The gold price trend next week is likely to lean towards a slight increase scenario provided that the USD does not recover strongly and geopolitical tensions continue. However, investors need to be cautious with corrections due to profit-taking or sudden changes due to macroeconomic information. Gold prices next week may fluctuate in the range of 3300-3450.
Notable technical levels are listed below.
Support: 3,300 – 3,292 – 3,250USD
Resistance: 3,371 – 3,400 – 3,435USD
SELL XAUUSD PRICE 3451 - 3449⚡️
↠↠ Stop Loss 3455
BUY XAUUSD PRICE 3299 - 3301⚡️
↠↠ Stop Loss 3295

#202521 - priceactiontds - weekly update - dax futuresGood Day and I hope you are well.
comment: tl;dr covered it. I would be really surprised if we see 24000 again over the next days, if not months. If there is no 180° reversal from orange face next week, this is a de-facto embargo and we will see new lows over the summer.
current market cycle: trading range and very broad bull channel on the weekly time frame
key levels for next week: 22000 - 24000
bull case: My base assumption is that we have started a new bear trend on Friday and any pullback will be a lower high. The higher bulls can get it, the better and weaker the trend will be. On Friday they could not hit the 50% retracement and if bears are strong, market will not trade above 23750 for the next weeks/months. If bulls can get above it, their next target would be the breakout retest 23900. Above 24000 means I am wrong about my thesis and market is doing something else, which will likely be a trading range 23000 - 243000.
Invalidation is below 22900.
bear case: Last Sunday I only wanted to short this but bears did not do enough until then. Friday changed it and I am in full bear mode if Monday goes well for the bears. Clear invalidation above 24000 and if bulls do not get it, shorts with stop new ath are reasonable. Donald gave the gift to bears, now I want to see some carnage. Market held above the daily 20ema but likely only due to the climactic selling, bears happy for any profit for such a long time and algos buying the first touch of the ema. Next targets for bears are the obvious round number 23000 and then closing the big gap down to 22600 and yes, I absolutely think we can get there next week.
Invalidation is above 24000.
short term: Neutral until bears show me some follow-through and not letting the bulls out with anything above 23800/23900. We need a big open bear gap and then we can see some bull slaughter.
medium-long term from 2025-05-25: My rough guess from early May was down over the summer and up into year end. POTUS certainly helped with the 50% tariffs. I need to see market reaction next week and if there is no 180° reversal until Friday, they will become reality the week after and dax should do 20-30% down over the next months. Markets were not positioned for any risk what so ever. Now we got the atomic trade bomb.

#202521 - priceactiontds - weekly update - nasdaq futuresGood Day and I hope you are well.
comment: Not as bearish as I am on dax but I think market should not go above 21200 again and continue down. For that to happen, bears need to leave a strong bear gap somewhere. Gap down on Monday or Tuesday will likely do the trick. If the bull trend line holds and the current bear trend line breaks, There is the small possibility of another leg up but for now I can’t see that happening.
current market cycle: trading range
key levels for next week: 19000 - 21000
bull case: Bulls need to stop the selling and reverse to above 21000 fast or bears will push this much lower. If they manage to stay around 21000, more bears could doubt the strength of this selling but it’s a weak argument as of now. If bulls go only sideways around 21000 and close Monday above it, that would change a lot to the better for them. They have support from the daily 20ema until clearly broken.
Invalidation is below 20600.
bear case: Bears see a clear topping pattern with at least 3 decent tries of going above 21350 and now we have the strong selling on Friday with a total escalation of the trade war with the EU. Bears were given a gift and they need follow-through and leave a big gap that has to stay open, like the bulls did with the 3 current open gaps. Targets for the bears in order are the breakout retest 20277, 20000 and then the prior support around 19300/19400 which is around the 50% retracement.
Invalidation is above 21200.
short term: Neutral until we clearly have follow-through selling by the bears. I want to lean max bearish but need more confirmation.
medium-long term - Update from 2024-05-24: Will update this section more after the coming week but in general the thesis is as for dax. Down over the summer and sideways to up into year end. I don’t think the lows for this year are in.

#202521 - priceactiontds - weekly update - wti crude oil futuresGood Day and I hope you are well.
comment: The past week we saw 3 tries by the bulls to push above 63 and they found no acceptance. I got trapped once because the spike looked so strong but it got zero follow-through. Markets will only try one direction so many times before they try the other one.
current market cycle: monthly time frame is a broad bear channel - weekly tf is a bear wedge - daily is a trading range
key levels: 55 - 63
bull case: Bulls need to stay above 60 or risk that the market tries back down to 56 or lower. If they can go sideways inside the given range, the better and if we hit 63 enough, it will break. Problem for them is, they tried couple of times now and the odds that 60 breaks are bigger than the breakout above 63. Friday was strong enough to expect not a big bear day on Monday but I am not eager to buy this.
Invalidation is below 59.8.
bear case: Bears need a stronger break below 59.8 for more downside and they need to make a lower high below 62. That’s the whole story. They are slightly favored since we are at the top of the current range that has been going on for almost 2 months now. They have defended the bear gap up to 64.5 more than 5 times.
Invalidation is above 64.4
short term: Neutral. Shorts closer to 63 are good or on a clear break below 59.8. No interest in buying up here unless bulls do something big above 64.4 and break the bear trend line.
medium-long term - Update from 2025-05-25: Need a clear break of the trading range 54 - 64 before we can come up with new targets. Bear trend is valid until the trend line breaks.

Market Analysis For DXY: Week of May 26thFurther downside momentum looks like a strong possibility this week with liquidity and imbalances resting in short-term zones.

GOLD ends 3 consecutive days of increase, still positiveOANDA:XAUUSD fell on Thursday (May 22), ending a three-day winning streak and continued to decline slightly in early Asian trading today (May 23), mainly due to a recovery in the US dollar and profit-taking by investors after gold prices hit a two-week high.
However, the outlook for gold prices remains positive due to geopolitical conflicts. Sources revealed that Israel is preparing to attack Iran's nuclear facilities if negotiations between Iran and the United States fail. Readers can review these specific news in previous editions or regular short updates.
Data released by S&P Global on Thursday showed that the preliminary reading of the U.S. manufacturing Purchasing Managers' Index (PMI) rose to 52.3 in May from 50.2 in April, beating expectations of 50.1. The preliminary U.S. services PMI rose to 52.3 in May, compared to both the previous and expected readings of 50.8. Initial jobless claims in the United States were 227,000 in the week ending May 17, down from 229,000 in the previous week and below expectations of 230,000, suggesting the labor market remains solid.
The US House of Representatives passed President Trump's "big and beautiful" tax reform proposal on Thursday. According to the Congressional Budget Office (CBO), the proposal would increase US debt by $3.8 trillion over the next decade to $36.2 trillion.
Gold is often seen as a store of value during times of political and financial uncertainty.
Technical Outlook Analysis OANDA:XAUUSD
Although gold fell yesterday, its current position still has enough conditions to increase towards the target at $3,371, which is the price point of the 0.236% Fibonacci retracement.
The nearest support to watch is the confluence of the 0.382% Fibonacci retracement with the 21-day moving average (EMA21), and even if gold falls short-term below this confluence, it can still increase with the following supports at $3,250, followed by the 0.50% Fibonacci retracement.
The relative strength index (RSI) remains above 50, which is a positive signal for the bullish momentum.
For the day, the technical outlook for gold is tilted to the upside and the points to watch are listed as follows.
Support: $3,300 – $3,292
Resistance: $3,371
SELL XAUUSD PRICE 3367 - 3365⚡️
↠↠ Stop Loss 3371
→Take Profit 1 3359
↨
→Take Profit 2 3353
BUY XAUUSD PRICE 3274 - 3276⚡️
↠↠ Stop Loss 3270
→Take Profit 1 3282
↨
→Take Profit 2 3288

2025-05-22 - priceactiontds - daily update - nasdaqGood Evening and I hope you are well.
comment: Bears get nothing going. Everything is bought. This notion slightly changed today. We saw an increase in selling pressure and market made a decent lower high but problem for the bears is, the bull trend line held and so far we have only seen big tails below 21100. We have formed a triangle and we could see a bigger trend day tomorrow. Until the trend line breaks, I don’t think bigger shorts make sense.
current market cycle: trading range
key levels: 21000 - 22000
bull case: Bulls defended the trend line and if bears step aside enough, we could do a new ath over the next 2 weeks. For now they are buying the dips but are too weak to push for new highs. Still most arguments are on their side as long as we are in this clear channel.
Invalidation is below 20800.
bear case: Bears need a weekly close below 20800. What are the odds of that happening? Meh. Betting on a trend line break is almost never a good strategy. It needs to happen and you have to follow. So if bears can get a strong move and consecutive 1h bars below 20900, it would increase the odds greatly of more downside. Bears still have many problems given the daily chart. The gap down is to 20300 and the daily 20ema is around 20600. So even if we break the trend line, I doubt bears will just melt through the daily ema after such a squeeze.
Invalidation is above 21600.
short term: Neutral. For now I expect more chop until one side clearly gives up again and if I had to guess, bears are more likely to step aside since we have big obvious targets above and the trend line is still valid.
medium-long term - Update from 2024-04-20: My most bearish target for 2025 was 17500ish, given in my year-end special. We are +18% from the lows and I do think, once this turns again, it will easily be the short trade of the year.
trade of the day: Buy low, sell high and scalp. 21400 - 21460 was the main range and both sides made money today. Only real bad trade was shorting below 21400 or buying the Globex high.

Weak USD and renewed safe-haven demand support GOLD surgeOANDA:XAUUSD surged to a one-week high. A weak US dollar and safe-haven demand amid economic and geopolitical uncertainty boosted gold prices.
Gold prices rose and held above $3,300 an ounce as traders grew increasingly concerned about the US tax reform vote and escalating tensions in the Middle East. In addition, Moody's downgrade of the US credit rating and the depreciation of the US dollar also boosted safe-haven demand for gold.
CNN reported Tuesday, citing multiple sources, that the latest intelligence suggests Israel is preparing to launch airstrikes on Iranian nuclear facilities, even as negotiations between the Trump administration and Iran over the country's uranium enrichment program continue. Axios, a prominent U.S. news website, reported Wednesday local time that two Israeli sources with knowledge of the negotiations told Axios that Israel is preparing to strike Iran's nuclear facilities quickly if negotiations between the United States and Iran fall apart.
Israeli intelligence has shifted in recent days from believing a nuclear deal was imminent to believing that talks could soon collapse, sources said.
Gold, considered a safe investment amid economic and geopolitical uncertainty, hit a record high of $3,500.05 an ounce last month.
US stocks plunged on Wednesday and US Treasury yields jumped as investors focused on congressional debate over President Trump’s proposed tax reform, raising concerns that the country’s massive debt will continue to rise.
Technical Outlook Analysis OANDA:XAUUSD
After gold broke the technical confluence of the 21-day moving average (EMA21) with the 0.382% Fibonacci retracement, it has qualified for further upside to the next target expected at $3,371, the price point of the 0.236% Fibonacci retracement.
Looking ahead, in the short term, gold has qualified for a new bullish cycle with the nearest support at the raw price point of $3,300 followed by $3,292. A bullish breakout of $3,371 would open the door to a new target at the raw price point of $3,400 in the short term, followed by $3,435.
As noted to readers throughout the publications since the beginning of the year, the trend of gold prices is fixed by the rising price channel, corrections can still take place negatively but the trend has not changed. "In fact, I have also encountered many failures when the market fluctuated too much recently, causing me to not believe in the rising price structure at times."
Trading is not just about fundamentals or technicals, it depends more on trading psychology. With the current market, experienced traders will still often encounter psychological problems, such as me, who is writing this article to you.
Finally, the short-term uptrend of gold prices in the main uptrend will be noted by the following notable levels.
Support: 3,300 – 3,292 – 3,250 USD
Resistance: 3,371 – 3,435 USD
SELL XAUUSD PRICE 3367 - 3365⚡️
↠↠ Stop Loss 3371
→Take Profit 1 3359
↨
→Take Profit 2 3353
BUY XAUUSD PRICE 3265 - 3267⚡️
↠↠ Stop Loss 3261
→Take Profit 1 3273
↨
→Take Profit 2 3279

2025-05-21 - priceactiontds - daily update - daxGood Evening and I hope you are well.
comment: Quick stuff. Daily new ath means bulls are doing more than bears so don’t look for shorts. Today’s selling was a start but we need a clean lower high before one can look for decent short setups. I think anything above 24300 would make me physically sick.
current market cycle: broad bull channel
key levels: 23000 - 24300
bull case: Sideways above 24000 is peak bullishness and as long as we stay above 23750, bulls are fine. Below we test down to the bull trend line which is not far below that and only below 23400 things are getting more spicy for bulls.
Invalidation is below 23300.
bear case: I will spend more time in this section once we have a daily close below 23400. Before that, it’s most likely a pullback that bulls will buy. Odds are heavily against bears so don’t make your life tough. Long term shorts if you can hold through 24500 or higher are fine. Next 10-20% will be made to the downside, zero doubt about it. Only matter is timing.
Invalidation is above 24300.
short term: Neutral. Pullbacks will likely be good long opportunities until we see bigger selling pressure. Bulls in full control but I will not buy the highs. Nothing changed.
medium-long term from 2025-05-11: So here is my very rough guess about the next months. This short squeeze is clearly overdone and global macro stuff has most likely already deteriorated a great deal. Down to 20000 over the next weeks and form a big trading range. Up through October-Year end. Zero thought about a new bull trend above 24000 or that we have seen the lows for either 2025 or 2026. Good question is always, “How would you allocate 100k right now?”. 50% short dax, 25% of it levered/options and with the rest I would scalp.
trade of the day: Buying the bear trap below yesterday’s low was amazing and so was short 24200. Both buying and selling pressure were so great that market did not run stops above or below the extremes.

GOLD spikes on geopolitics, not enough for new bull runIn the early trading session this morning (May 21), the spot OANDA:XAUUSD suddenly skyrocketed in the short term, surpassing the $3,300/ounce mark for the first time since May 9. In addition, the price of WTI crude oil also skyrocketed, at one point increasing by 3%. US media reported that US intelligence agencies had detected that Israel was preparing to attack Iran's nuclear facilities.
After the price increase on the previous trading day, the gold price continued to skyrocket to $3,304.18/ounce in the early trading session on Wednesday in Asia. Because gold is considered a safe asset in times of geopolitical and economic uncertainty, new signs of geopolitical instability once again supported the increase in gold prices.
CNN reported Tuesday local time that several US officials told CNN that new information obtained by the US shows that Israel is preparing to attack Iran's nuclear facilities even as the Trump administration seeks a diplomatic deal with Tehran.
Such an attack would be a clear break with President Donald Trump, U.S. officials said. It could also spark a broader conflict in the Middle East, something the United States has tried to avoid since the 2023 Gaza war ratcheted up tensions.
The growing concern stems not only from messages from senior Israeli officials, both public and private, that Israel is considering such a move, but also from intercepted Israeli communications and observations of Israeli military activity that could indicate an Israeli strike is imminent, multiple sources familiar with the intelligence said.
Geopolitical factors also played a role in pushing gold higher, as the failure to reach a ceasefire between Russia and Ukraine and rising tensions in the Middle East could prompt investors to hold onto gold.
The dollar weakened on Tuesday after Moody's downgraded the United States' top triple-A credit rating. Fed officials were also cautious about the economic outlook, hurt by the downgrade. A weaker US dollar means gold becomes more attractive.
Analysis of the technical outlook for OANDA:XAUUSD
On the daily chart, gold surged to a technical confluence of key resistance formed by the location of the 0.382% Fibonacci retracement and the 21-day EMA. At this point, gold has not completely broken out of the price action around the $3,300 base point. If gold breaks above and sustains above the $3,300 base point, it will be in a position to continue to rise with a target of around $3,371 in the short term.
On the other hand, a sell-off below the 0.382% Fibonacci retracement would open the door for a retest of the $3,250 technical level followed by the 0.50% Fibonacci retracement.
Currently, the active position is not yet in line for a new bullish cycle. Therefore, the technical outlook for gold for the day is a retest of $3,250 in the short term, followed by $3,228.
The notable positions for intraday downside correction expectations are listed below.
Support: $3,250 – $3,228
Resistance: $3,331 – $3,345
SELL XAUUSD PRICE 3356 - 3354⚡️
↠↠ Stop Loss 3360
→Take Profit 1 3348
↨
→Take Profit 2 3342
BUY XAUUSD PRICE 3270 - 3272⚡️
↠↠ Stop Loss 3266
→Take Profit 1 3278
↨
→Take Profit 2 3284

2025-05-20 - priceactiontds - daily update - nasdaq
Good Evening and I hope you are well.
comment: Bears get nothing going. Everything is bought. Do not look for shorts unless you can scalp really well. We have room for 1 more day of chop but ultimately I think we will print 22000, like sp500 wants the 6000+. Bull channel is valid until broken, so look for longs.
current market cycle: trading range
key levels: 21000 - 22000
bull case: Bulls want a new ath and we are high enough, that they could easily get it. As long as we stay above 21200, the bull channel is alive and well and we are making higher highs and higher lows. Don’t need to write more for bulls because they have all the arguments on their side.
Invalidation is below 20100.
bear case: Bears can only join the chat again, once we have a daily close below 21000. This channel upwards is tight. Do not look for shorts.
Invalidation is above 21200ish but real confirmation is only below 21000.
short term: Neutral for another day but when the breakout happens, obviously bullish for 22000 and maybe some more. We have room for one more chop day.
medium-long term - Update from 2024-04-20: My most bearish target for 2025 was 17500ish, given in my year-end special. We are +18% from the lows and I do think, once this turns again, it will easily be the short trade of the year.
trade of the day: Buy low, sell high and scalp. 21400 - 21460 was the main range and both sides made money today. Only real bad trade was shorting below 21400 or buying the Globex high.

Positive market, GOLD drops to 3,220 USD in short termOANDA:XAUUSD fell to $3,220/oz, down 0.61% on the day at press time, resuming a bearish trend and cooling demand for safe-haven assets. US President Trump spoke by phone with Russian President Vladimir Putin, with Trump saying Russia wants to reach a major trade deal with the United States and will immediately begin ceasefire negotiations with Ukraine. Ahead of Federal Reserve Chairman Powell's speech, central bank officials remained on the sidelines, with the likelihood of a rate cut in the summer very low.
Trump said Russia wants to make a “big” trade deal with the United States. Trump posted on his Truth Social account that he spoke with Putin on Monday to discuss the deal. “I just had a two hour phone call with Putin and I think it went very well.”
Trump said he discussed a number of issues with Putin, primarily the ceasefire agreement between Putin and Ukraine. “Russia and Ukraine will immediately begin negotiations to achieve a ceasefire and, more importantly, an end to the war,” Trump wrote. “Both sides will negotiate the terms of this agreement, which is only possible because they have details of the negotiations that others do not. The tone and atmosphere of the talks were very good.”
After announcing the ceasefire, Trump also wrote that Putin was looking for a trade deal with the United States. “Russia wants to engage in massive trade with the United States after this disastrous ‘bloodbath’ is over, and I agree. Russia has a tremendous opportunity to create many jobs and wealth. The potential is limitless.” Trump also said that Ukraine could also benefit from a potential trade deal with the United States. He even added that the Vatican, represented by the new pope, would be willing to hold trade/ceasefire talks.
Recent cooperative initiatives between Putin and Trump, including the US President receiving a painting from Putin, have raised questions about how the US-Russia axis will affect trade dynamics between the two countries. The two countries have maintained active communication since Trump took office in January. Given the current global tensions, a new US-Russia trade deal would be a significant step forward.
Trump discussed peace in Ukraine with Putin on Monday after the US said it may have to pull out of a stalemate over ending Europe’s bloodiest conflict since World War II.
Looking ahead, markets are focused on a speech by Federal Reserve Chairman Powell, with traders now betting that the chances of a rate cut in the summer are extremely low.
The more positive news the market gets, the more pressure gold will face as cooling safe-haven demand will send investors looking for riskier assets.
Technical Outlook Analysis OANDA:XAUUSD
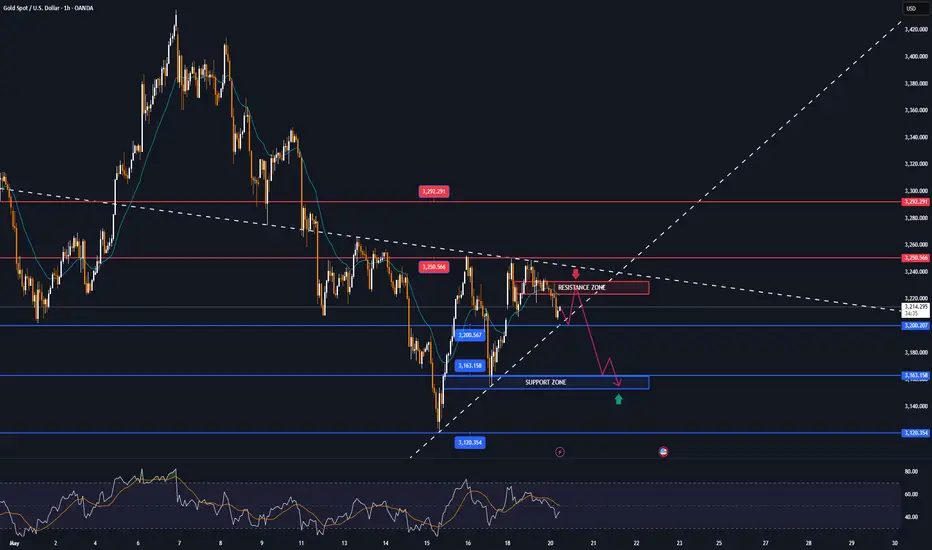
As noted to readers in previous publications since gold was sold below EMA21, up to now, it still has a short-term technical trend leaning towards the downside. Specifically, gold has repeatedly failed to overcome the resistance level of 3,250 USD and has decreased in price every time it approaches this level. And in terms of momentum, the Relative Strength Index (RSI) remains below 50, far from the oversold zone, indicating that there is still room for momentum to decline ahead.
For gold to be in a position to enter a new bullish cycle, the most important condition is that it needs to break above the $3,300 base level then target around $3,371 in the short term.
On the other hand, once gold breaks below the $3,200 support point it could continue to decline with the target then around the 0.618% Fibonacci retracement in the short term.
For the rest of the day, the technical outlook for gold is bearish with notable positions listed as follows.
Support: $3,200 – $3,163 – $3,120
Resistance: $3,250 – $3,292
SELL XAUUSD PRICE 3226 - 3224⚡️
↠↠ Stop Loss 3230
→Take Profit 1 3218
↨
→Take Profit 2 3212
BUY XAUUSD PRICE 3150 - 3152⚡️
↠↠ Stop Loss 3146
→Take Profit 1 3158
↨
→Take Profit 2 3164
2025-05-19 - priceactiontds - daily update - daxGood Evening and I hope you are well.
comment: Bulls finally got their retest and a higher high. Now is decision time. Can we do another leg up or is this a bull trap and we finally reverse for a deeper pullback over the next days? I heavily favor the latter but for now bears are nowhere to be seen and until then, looking for shorts is suicide. 24300 could be the potential next target if we continue in the bull channel on the 1h chart.
current market cycle: broad bull channel
key levels: 23000 - 24300
bull case: Bulls got 24000 and we are in a perfect channel upwards. Trade it until broken. I will only scalp this and if we break above this channel or go beyond 24300, it will be without me.
Invalidation is below 23300.
bear case: I see the odds of this becoming a late bull trap greater than another leg up but so far, bears are doing nothing, so do not look for shorts. Only below 23700 is the current channel broken and we test 23600 next. Below that, 23400 would be next but we closed at the highs and thinking about anything below 23700 is senseless for now.
Invalidation is above 24130.
short term: Neutral. Pullbacks will likely be good long opportunities until we see bigger selling pressure. Bulls in full control but I will not buy the highs.
medium-long term from 2025-05-11: So here is my very rough guess about the next months. This short squeeze is clearly overdone and global macro stuff has most likely already deteriorated a great deal. Down to 20000 over the next weeks and form a big trading range. Up through October-Year end. Zero thought about a new bull trend above 24000 or that we have seen the lows for either 2025 or 2026. Good question is always, “How would you allocate 100k right now?”. 50% short dax, 25% of it levered/options and with the rest I would scalp.
trade of the day: Buying Friday’s low at 23788 and hold at least for gap close. The move up was strong enough to continue to hold and market has printed 6 consecutive 1h bull bars.

Gold - Follow The Macro Trend!Hello TradingView Family / Fellow Traders. This is Richard, also known as theSignalyst.
📈 GOLD has been overall bullish from a macro perspective trading within the rising wedge pattern in orange.
After rejecting the $3,500 round number and upper bound of the wedge, XAUUSD signaled the start of the correction phase as marked by the red falling channel.
Moreover, the $3,100 - $3,150 zone is a strong support.
🏹 Thus, the highlighted blue circle is a strong area to look for buy setups as it is the intersection of support and lower orange trendline acting non-horizontal support.
📚 As per my trading style:
As #XAUUSD approaches the blue circle zone, I will be looking for bullish reversal setups (like a double bottom pattern, trendline break , and so on...)
📚 Always follow your trading plan regarding entry, risk management, and trade management.
Good luck!
All Strategies Are Good; If Managed Properly!
~Rich
Disclosure: I am part of Trade Nation's Influencer program and receive a monthly fee for using their TradingView charts in my analysis.

ES1! (S&P500 Mini Futures) - Support Trendline Price Test -DailyES1! (S&P500 Mini Futures) price is currently testing a support trendline around $5900.
If several daily Price candles close below $5865 this month, a pullback in the price can occur (rising wedge pattern).
Volume has been decreasing in May 2025, compared to March and April.
Finance and Technology corporate earnings season has passed. The U.S. government 90-day tariff pause is set to expire in early July (pending trade deal negotiations with other countries).
Tariff and trade deal news, breaking news, corporate earnings, government law changes, consumer sentiment, inflation data, the FOMC, and presidential announcements can all affect the prices of stocks and ETFs.
