Soybeans: The Global Protein Powerhouse🟡 1. Introduction
Soybeans might not look like much at first glance — small, round, unassuming. But behind every bean lies a global story of protein demand, export flows, and economic policy.
They feed livestock, fuel vehicles, nourish entire populations, and move markets. In fact, soybeans sit at the intersection of agriculture, industry, and geopolitics — making them one of the most actively traded and strategically watched commodities in the world.
If you’re looking to understand how soybeans move markets — and how you can trade them effectively — this article is your starting point.
🌍 2. Why the World Cares About Soybeans
Few agricultural commodities carry the weight soybeans do. Their importance spans both the food and energy sectors — and their global footprint is enormous.
Here’s why they matter:
Protein Meal: After processing, about 80% of the soybean becomes high-protein meal used to feed poultry, pigs, and cattle.
Soybean Oil: Roughly 20% is extracted as oil — a key ingredient in cooking, industrial products, and increasingly, biodiesel.
Biofuels: As the push for renewable energy grows, soybean oil plays a major role in sustainable fuel strategies.
Top producers:
United States — historically the world’s largest producer.
Brazil — now rivals or exceeds U.S. production in some years.
Argentina — a dominant player in soybean meal and oil exports.
Top importers:
China — imports over 60% of globally traded soybeans.
EU, Mexico, Japan — also large buyers.
Soybeans are a bridge commodity — connecting livestock feed, food manufacturing, and renewable energy. That’s why traders from Chicago to Shanghai watch every yield forecast and export announcement closely.
💹 3. CME Group Soybean Contracts
Soybeans trade on the CME Group’s CBOT platform, with two main futures products:
o Standard Soybeans
Ticker: ZS
Size = 5,000 bushels
Tick = 0.0025 = $12.50
Margin = ~$2,150
o Micro Soybeans
Ticker: MZS
Size = 500 bushels
Tick = 0.0050 = $2.50
Margin = ~$215
Soybean futures are among the most actively traded agricultural contracts, offering deep liquidity, tight spreads, and excellent volatility for strategic traders. Keep in mind that margins are subject to change — always confirm with your broker. Micro contracts are ideal for scaling in/out of trades or learning market structure without large capital risk.
📅 4. The Soybean Calendar
Soybeans follow a seasonal cycle that creates rhythm in the market — and a potential edge for informed traders.
In the United States:
🌱 Planting: Late April to early June
☀️ Pod development / blooming: July and early August (weather-sensitive)
🌾 Harvest: September through November
In Brazil:
🌱 Planting: October to December
🌾 Harvest: February through April
This staggered calendar means that soybean markets have multiple weather risk windows each year. It also means the export flows and global pricing dynamics shift between the Northern and Southern Hemispheres throughout the calendar year.
That’s why soybeans tend to have two major volatility windows — mid-summer (U.S. crop concerns) and early Q1 (South American weather). Traders often build seasonal strategies around these patterns — buying weakness before key USDA reports, fading rallies during overbought harvests, or trading futures spreads between U.S. and Brazilian supply flows.
🔄 5. How Soybeans Are Traded Globally
Soybeans move through a complex international web of growers, crushers, exporters, and consumers. As a trader, understanding this flow is essential — because each node introduces price risk, opportunity, and reaction points.
Key players:
o Hedgers:
U.S. and Brazilian farmers hedge production risk using futures or options on futures.
Exporters hedge shipping schedules against fluctuating basis and FX risk.
o Crushers:
Companies like Cargill or Bunge buy soybeans to crush into meal and oil.
Crush margin (aka “board crush”) affects demand and influences futures spreads.
o Speculators:
Institutional funds trade soybeans as a macro or relative value play.
Retail traders use micro contracts (MZS) to capture directional or seasonal moves.
o China:
Its purchasing pace (or sudden cancellations) can move markets dramatically.
Announcements of bulk U.S. purchases could trigger short-covering rallies.
Additionally, soybeans are sometimes traded indirectly via their by-products:
Soybean Meal (ZM)
Soybean Oil (ZL)
These contracts often lead or lag ZS based on demand shifts in feed or fuel.
📈 6. What Makes Soybeans Unique to Trade
Compared to wheat and corn, soybeans are:
More weather-sensitive during July and August (especially to drought and heat).
More globally integrated, thanks to China’s dominant import role.
More complex, due to crush dynamics and multiple end-use markets.
This multifaceted nature is why many professional traders monitor soybeans, even if they aren’t actively trading them every week.
📌 7. Summary / Takeaway
Soybeans are one of the most important — and most tradable — commodities in the world. They feed livestock, fuel industry, and anchor the agricultural markets across two hemispheres.
Their unique role in food, fuel, and feed makes them more than just another contract — they’re a barometer for global health, demand, and policy.
Whether you’re trading the standard ZS contract or getting started with MZS, mastering soybeans means understanding weather, trade flows, product demand, and seasonality.
🧭 This article is part of our agricultural futures trading series.
📅 Watch for the next release: “Weather and Corn: A Deep Dive into Temperature Impact”
When charting futures, the data provided could be delayed. Traders working with the ticker symbols discussed in this idea may prefer to use CME Group real-time data plan on TradingView: www.tradingview.com - This consideration is particularly important for shorter-term traders, whereas it may be less critical for those focused on longer-term trading strategies.
General Disclaimer:
The trade ideas presented herein are solely for illustrative purposes forming a part of a case study intended to demonstrate key principles in risk management within the context of the specific market scenarios discussed. These ideas are not to be interpreted as investment recommendations or financial advice. They do not endorse or promote any specific trading strategies, financial products, or services. The information provided is based on data believed to be reliable; however, its accuracy or completeness cannot be guaranteed. Trading in financial markets involves risks, including the potential loss of principal. Each individual should conduct their own research and consult with professional financial advisors before making any investment decisions. The author or publisher of this content bears no responsibility for any actions taken based on the information provided or for any resultant financial or other losses.
Futurestrading

Nifty back to bull controllhi Traders,
Weekly the swing had a correction of 38%.
The daily time frame's Inverted H&S pattern is a confirmation of the trend change(from correction to impulse wave)
Nifty 50 will make a move from 500 to 1500 points till the previous high of the weekly swing.
The targets are mentioned in the chat.
As we have 14days to expiry, there is enough time to hit target 1. Interested traders buy ATM CALL option or FUTURES
sbull.co

ENS ANALYSIS📊 #ENS Analysis
✅There is a formation of Falling Wedge Pattern on 12 hr chart and currently trading around its major support zone🧐
Pattern signals potential bullish movement incoming after the breakout of resistance 1
👀Current Price: $22.58
🚀 Target Price: $31.29
⚡️What to do ?
👀Keep an eye on #ENS price action and volume. We can trade according to the chart and make some profits⚡️⚡️
#ENS #Cryptocurrency #TechnicalAnalysis #DYOR

TWT ANALYSIS🚀#TWT Analysis :
🔮As we can see in the chart of #TWT that there is a formation of "Falling Wedge Pattern". Some time ago the same structure was made and it performed well and this time also the same is happening with a perfect breakout
🔰Current Price: $0.8464
🎯 Target Price: $1.0865
⚡️What to do ?
👀Keep an eye on #TWT price action. We can trade according to the chart and make some profits⚡️⚡️
#TWT #Cryptocurrency #TechnicalAnalysis #DYOR

Wheat Trade ideaWheat has been in a downtrend for the past two years, but right now it’s sitting in a strong demand zone on the weekly chart for the year. Both the technicals and fundamentals are starting to look bullish, so this could be a solid setup for a long trade even if the overall trend is still down.
On Thursday, April 24, there was a nice daily rejection between the 545’00 and 539’00 levels. That would’ve been a good entry based on my strategy.
Most traders would avoid this kind of trade because of the strong downtrend, but I see everything lining up here: demand zone, fundamentals, and rejection. It doesn’t mean the market will reverse, but the risk is worth the potential reward.
I’m not expecting a huge move just taking what the market gives me. If fundamentals keep supporting the move, I’ll hold longer. If not, I’ll take profit earlier. It’s about staying realistic and disciplined.

Bank Nifty Futures Simple AnalysisKey Support & Resistance Zones:
Resistance Zone (Top of range): Around 55,400.
Support Zone (Bottom of range): Around 55,000.
Next Major Support below the range:
54,500 ( Immediate Support)
52,700 ( Trenline Support)
52,129 (Horizontal Trenline Support)
Trendlines:
The chart shows a strong ascending trendline from earlier lows.(yellow coloured trendline)
But Looking at Recent Highs bulls are loosing momentum at 55800 to 55900 tried 4 time to break but failed to break range which shows weakness on bull side
What to Look :
If range break from 54900 with high volume and bar candle we can move down towards the immediate support then we can expect a bounce at range support at 54500
Or If Gap up or Gap Down can shift the momentum

Breadbasket Basics: Trading Wheat Futures🟡 1. Introduction
Wheat may be a breakfast-table staple, but for traders, it’s a globally sensitive asset — a commodity that reacts to geopolitics, climate patterns, and shifting demand from dozens of countries.
Despite its critical role in food security and its status as one of the most traded agricultural commodities, wheat is often overlooked by traders who focus on corn or soybeans. Yet wheat offers a unique combination of liquidity, volatility, and macro sensitivity that makes it highly attractive for both hedgers and speculators.
If you’re new to trading wheat, this guide gives you a solid foundation: how the wheat market works, who the key players are, and what makes wheat such a dynamic futures product.
🌍 2. Types of Wheat and Where It Grows
One of the first things traders need to understand is that wheat is not a single, uniform product. It’s a diverse group of grain types, each with its own characteristics, end uses, and pricing dynamics.
The major classes of wheat include:
Hard Red Winter (HRW): High-protein wheat grown in the central U.S. — used in bread and baking.
Soft Red Winter (SRW): Lower protein, used for pastries and crackers.
Hard Red Spring (HRS): Grown in the Northern Plains; prized for high gluten content.
Durum Wheat: Used for pasta, grown mainly in North Dakota and Canada.
White Wheat: Grown in the Pacific Northwest; used for noodles and cereals.
Each class responds differently to weather, demand, and regional risks — giving traders multiple ways to diversify or hedge.
Major global producers include:
United States
Russia
Canada
Ukraine
European Union
Australia
India
These regions experience different planting and harvesting calendars — and their weather cycles are often out of sync. This creates trading opportunities year-round.
🛠️ 3. CME Group Wheat Contracts
Wheat futures are traded on the Chicago Board of Trade (CBOT), part of the CME Group.
Here are the two key contracts:
o Standard Wheat
Ticker: ZW
Size = 5,000 bushels
Tick = 0.0025 = $12.50
Margin = ~$1,750
o Micro Wheat
Ticker: MZW
Size = 500 bushels
Tick = 0.0050 = $2.50
Margin = ~$175
Keep in mind that margins are subject to change — always confirm with your broker. Micro contracts are ideal for scaling in/out of trades or learning market structure without large capital risk.
📅 4. Wheat’s Seasonality and Supply Chain
Unlike corn or soybeans, wheat is planted and harvested across multiple seasons depending on the variety and geography.
In the U.S., winter wheat (HRW and SRW) is planted in the fall (September–November) and harvested in early summer (May–July). Spring wheat (HRS) is planted in spring (April–May) and harvested late summer.
Globally, things get even more staggered:
Australia’s wheat is harvested in November–December
Ukraine and Russia harvest in June–August
Argentina’s crop comes off the fields in December–January
This scattered global schedule means news headlines about one country’s weather or war (think Ukraine in 2022) can quickly shift sentiment across the entire futures curve.
📈 5. Who Trades Wheat and Why
Wheat is traded by a wide range of participants — each with their own objectives and strategies. Understanding their behavior can give you an edge in anticipating market moves.
Commercial hedgers:
Farmers lock in prices to protect against adverse weather or market crashes.
Grain elevators and exporters use futures to manage inventory risk.
Flour mills hedge their input costs to protect profit margins.
Speculators:
Hedge funds and CTAs trade wheat based on global macro trends, weather anomalies, or technical setups.
Retail traders increasingly use micro contracts to gain exposure to agricultural markets with lower capital risk.
Spread traders bet on pricing differences between wheat classes or harvest years.
🔍 For retail traders especially, micro contracts like XW open the door to professional markets without oversized exposure.
🧠 6. What Makes Wheat Unique in Futures Markets
Wheat is often considered the most geopolitically sensitive of the major grains. Here’s why:
Price can spike fast — even on rumor alone (e.g., export bans or missile strikes near ports).
Production risks are global — the market reacts not just to the U.S. crop, but to conditions in Russia, Ukraine, and Australia.
Storage and quality matter — protein levels and moisture content affect milling demand.
Unlike corn, wheat doesn’t have a single dominant industrial use (like ethanol). This means food demand is king, and food security often drives policy decisions that affect futures pricing.
📌 7. Summary / Takeaway
Wheat may not get as much media attention as corn or soybeans, but it’s a deeply important — and deeply tradable — market. Its global footprint, class differences, and sensitivity to weather and politics make it a must-know for serious agricultural futures traders.
Whether you're just starting out or looking to diversify your trading playbook, understanding wheat is an essential step. Learn its rhythms, follow its news, and respect the fact that every crop cycle brings a new story to the market.
🧭 This article is part of an ongoing educational series exploring futures trading in agricultural commodities.
📅 Watch for the next release: “Soybeans: The Global Protein Powerhouse.”
When charting futures, the data provided could be delayed. Traders working with the ticker symbols discussed in this idea may prefer to use CME Group real-time data plan on TradingView: www.tradingview.com - This consideration is particularly important for shorter-term traders, whereas it may be less critical for those focused on longer-term trading strategies.
General Disclaimer:
The trade ideas presented herein are solely for illustrative purposes forming a part of a case study intended to demonstrate key principles in risk management within the context of the specific market scenarios discussed. These ideas are not to be interpreted as investment recommendations or financial advice. They do not endorse or promote any specific trading strategies, financial products, or services. The information provided is based on data believed to be reliable; however, its accuracy or completeness cannot be guaranteed. Trading in financial markets involves risks, including the potential loss of principal. Each individual should conduct their own research and consult with professional financial advisors before making any investment decisions. The author or publisher of this content bears no responsibility for any actions taken based on the information provided or for any resultant financial or other losses.

Looking to short CL to continue lowerCL is making a corrective move higher before moving down to the ultimate target of last Daily structure leg down. It retraced to Daily bearish Fair Value Gaps (internal range liquidity zones) which should act as resistance. 15M bearish structure is in Extreme premium.
I'm looking for CL to break down bullish corrective structure on 5M chart and start a final move down.

SPY Day Trade Plan for 05/01/2025SPY Day Trade Plan for 05/01/2025
📈 562.70 565.60
📉 557 554.30
Thanks to all my followers! Truly appreciate the support!
Please like and share for more ES/NQ levels Tues & Thurs 🤓📈📉🎯💰
*These levels are derived from comprehensive backtesting and research and a quantitative system demonstrating high accuracy. This statistical foundation suggests that price movements are likely to exceed initial estimates.*

MNQ1!/NQ1! Day Trade Plan for 05/01/2025MNQ1!/NQ1! Day Trade Plan for 05/01/2025
📈 20130 20219
📉 19770 19700
Thanks to all my followers! Truly appreciate the support!
Please like and share for more ES/NQ levels Tues & Thurs 🤓📈📉🎯💰
*These levels are derived from comprehensive backtesting and research and a quantitative system demonstrating high accuracy. This statistical foundation suggests that price movements are likely to exceed initial estimates.*

MNQ1!/NQ1! Day Trade Plan for 04/29/2025MNQ1!/NQ1! Day Trade Plan for 04/29/2025
📈 19560 19685
📉 19185 19060
Thanks to all my followers! Truly appreciate the support!
Please like and share for more ES/NQ levels Tues & Thurs 🤓📈📉🎯💰
*These levels are derived from comprehensive backtesting and research and a quantitative system demonstrating high accuracy. This statistical foundation suggests that price movements are likely to exceed initial estimates.*

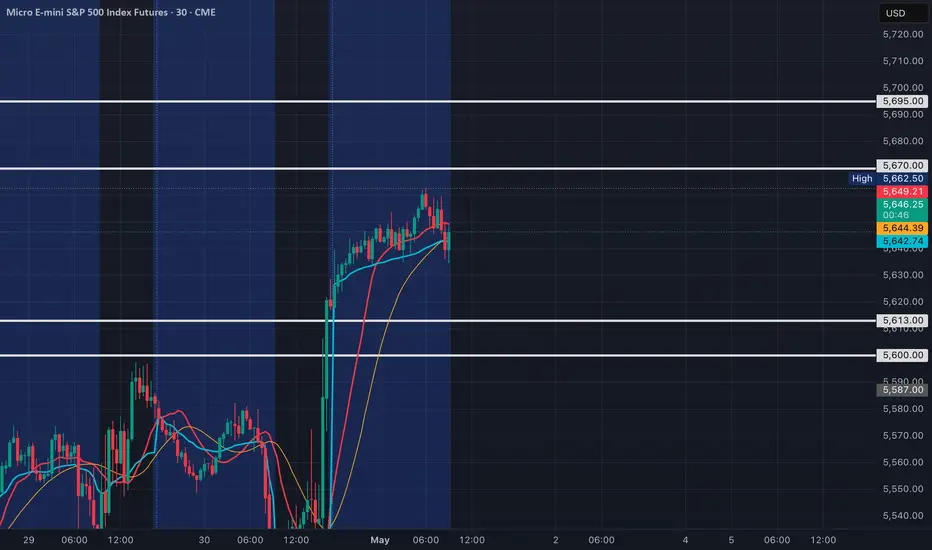
MES1!/ES1! Day Trade Plan for 05/01/2025MES1!/ES1! Day Trade Plan for 05/01/2025
📈 5670 5695
📉 5613 5600
Thanks to all my followers! Truly appreciate the support!
Please like and share for more ES/NQ levels Tues & Thurs 🤓📈📉🎯💰
*These levels are derived from comprehensive backtesting and research and a quantitative system demonstrating high accuracy. This statistical foundation suggests that price movements are likely to exceed initial estimates.*
MES!/ES1! Day Trade Plan for 04/29/2025MES!/ES1! Day Trade Plan for 04/29/2025
📈 5555 5580
📉 5500 5475
Thanks to all my followers! Truly appreciate the support!
Please like and share for more ES/NQ levels Tues & Thurs 🤓📈📉🎯💰
*These levels are derived from comprehensive backtesting and research and a quantitative system demonstrating high accuracy. This statistical foundation suggests that price movements are likely to exceed initial estimates.*

BAT ANALYSIS🚀#BAT Analysis :
🔮As we can see in the chart of #BAT that there is a formation of "Falling Wedge Pattern". In a daily timeframe #BAT broke out the pattern. Expecting a bullish move in few days if #BAT retest the levels
⚡️What to do ?
👀Keep an eye on #BAT price action. We can trade according to the chart and make some profits⚡️⚡️
#BAT #Cryptocurrency #TechnicalAnalysis #DYOR

TAO ANALYSIS📊 #TAOAnalysis
✅There is a formation of Descending Channel Pattern in daily time frame in #TAO .
Also there is a perfect breakout and retest. Now we can expect a bullish move. If the price sustains the major resistance zone then we will see more bullish move
👀Current Price: $349
🎯 Target Price : $460
⚡️What to do ?
👀Keep an eye on #TAO price action and volume. We can trade according to the chart and make some profits⚡️⚡️
#TAO #Cryptocurrency #Breakout #TechnicalAnalysis #DYOR

MES!/ES1! Day Trade Plan for 04/25/2025MES!/ES1! Day Trade Plan for 04/25/2025
📈 5530 5560
📉 5475 5445
Thanks to all my followers! Truly appreciate the support!
Please like and share for more NQ levels Tues & Thurs 🤓📈📉🎯💰
*These levels are derived from comprehensive backtesting and research and a quantitative system demonstrating high accuracy. This statistical foundation suggests that price movements are likely to exceed initial estimates.*

MNQ1!/NQ1! Day Trade Plan for 04/25/2025MNQ1!/NQ1! Day Trade Plan for 04/25/2025
📈 19430 19580
📉 19140 18980
Thanks to all my followers! Truly appreciate the support!
Please like and share for more NQ levels Tues & Thurs 🤓📈📉🎯💰
*These levels are derived from comprehensive backtesting and research and a quantitative system demonstrating high accuracy. This statistical foundation suggests that price movements are likely to exceed initial estimates.*

ETHFI Breakout Loading? Targets Up to $1.67!$ETHFI/USDT Analysis
Price is currently trading around a key resistance zone after a strong recovery from recent lows. While momentum looks bullish, the resistance has not been broken yet — making this a crucial level to watch.
A clean breakout and candle close above this zone could confirm a potential rally toward the next targets.
🎯 Upside Targets (if breakout confirms):
TP1: $0.881
TP2: $1.291
TP3: $1.677
📌 For now, stay patient. Let the price action confirm before entering — this zone could act as a rejection point if bulls fail to push through.
DYOR, NFA

MES1!/ES1! Day Trade Plan for 04/23/2025MES1!/ES1! Day Trade Plan for 04/23/2025
📈 5512
📉 5440
Thanks to all my followers! Truly appreciate the support!
Please like and share for more NQ levels Tues & Thurs 🤓📈📉🎯💰
*These levels are derived from comprehensive backtesting and research and a quantitative system demonstrating high accuracy. This statistical foundation suggests that price movements are likely to exceed initial estimates.*

MNQ!/NQ1! Day Trade Plan for 04/22/2025MNQ!/NQ1! Day Trade Plan for 04/22/2025
📈18210 18365
📉17910 17760
Thanks to all my followers! Truly appreciate the support!
Please like and share for more NQ levels Tues & Thurs 🤓📈📉🎯💰
*These levels are derived from comprehensive backtesting and research and a quantitative system demonstrating high accuracy. This statistical foundation suggests that price movements are likely to exceed initial estimates.*

SOYBEAN, Weekly Supply/Demand+fundamentals we are kicking of the year with a clear technical rejection from $1050 to $1112 weekly supply zone. Price pushed agressively into this area and has now printed multiple rejection candles on the daily, confirming the zones strength.
fundamentals are showing bearish positioning aligned with the technical setup.
entry wil be at market open. first target is at break of recent support and if fundamentals stil support the bias by then we wil also aim for target two.
simple structure, clean confirmation. lets see if price delivers.

MNQ!/NQ1! Day Trade Plan for 04/15/2025MNQ!/NQ1! Day Trade Plan for 04/15/2025
📈19130 19280
📉18670 18520
Thanks to all my followers! Truly appreciate the support!
Please like and share for more NQ levels Tues & Thurs 🤓📈📉🎯💰
*These levels are derived from comprehensive backtesting and research and a quantitative system demonstrating high accuracy. This statistical foundation suggests that price movements are likely to exceed initial estimates.*

ETH ANALYSIS🔮 #ETH Analysis
🌟🚀 #ETH is trading in an Ascending Triangle Pattern in 1hr timefram and there is a breakdown of the pattern. Ascending trendline works as a resistance line and #ETH is moving towards the ascending trendline. There are 2 scenario in #ETH; either it will again come in the pattern and move upward and it will retest the major support zone first.
🔖 Current Price: $1589
⁉️ What to do?
- We have marked crucial levels in the chart . We can trade according to the chart and make some profits. 🚀
#ETH #Cryptocurrency #Breakout #DYOR
