Gold - Why a drop to 3250 could be the perfect buy!Gold has been in a strong and sustained uptrend, showing impressive momentum with minimal pullbacks along the way. At the moment, Gold is forming a rising wedge pattern, which could indicate potential short-term downside price action. If we see a retracement from current levels, I’ll be watching closely for a long opportunity.
A break below this rising wedge would suggest possible short-term downside movement. This would actually be healthy for the overall trend, as small pullbacks are a natural and necessary part of a strong uptrend. It helps shake out weak hands, reset indicators, and build stronger support for the next leg higher.
Why a drop to around 3250?
If the wedge breaks, there’s an imbalance zone (4h FVG) sitting just below the current price level that has yet to be filled. These imbalance zones are created when price moves sharply in one direction, leaving gaps in the market structure. These areas often act as magnets, drawing price back to fill them before the trend resumes.
This particular imbalance zone lines up perfectly with the golden pocket Fibonacci retracement, adding further significance to the level as a strong area of support for the bulls. When technical confluences align like this, they tend to become high-probability reaction zones.
It’s also worth noting that this was the last major high that was broken before Gold made its most recent move upward. That makes this level even more likely to be defended by buyers. Bulls who missed the initial breakout will be watching this level closely for entries.
What are we watching for?
If Gold fails to hold the structure of the rising wedge, it opens the door for a sharper pullback towards the 3250 zone. This level aligns with multiple key confluences: the support zone, the 4h FVG, and the golden pocket. All of these factors together make it a prime level to look for bullish setups.
Conclusion
Gold remains in a strong uptrend but is starting to show early signs of a potential short-term pullback if it loses the rising wedge structure. Should that happen, the primary target for downside would be the 3250 level. This is where I’ll be looking for long opportunities, as it aligns with major support, the 4h imbalance zone, and the golden pocket retracement.
While this pullback would be short-term in nature, the broader trend remains bullish. As long as key levels hold and market structure stays intact, the bigger picture favors further upside. A healthy retracement here could set the stage for a more sustainable and explosive next leg up.
Thanks for your support.
- Make sure to follow me so you don't miss out on the next analysis!
- Drop a like and leave a comment!
Fvg

Bitcoin – Testing Major Resistance: 95k next target?Bitcoin is currently trading inside a significant resistance zone between $88,000 and $89,000. This area has acted as a strong supply zone in the past, evidenced by multiple rejections that led to notable sell-offs. The recent upward momentum that brought price back into this area was backed by a strong rally off the April lows, pushing through local structure and recovering critical levels. However, despite the strength of this move, price is now approaching a decision point where bulls need to prove continuation capacity or risk triggering another corrective leg.
Consolidation Structure
The current structure reflects a potential accumulation base forming below resistance, marked by a series of higher lows and a compression of volatility. This typically precedes a breakout, though it also heightens the risk of a sharp rejection should buyers fail to sustain pressure. The local trend remains bullish on the 4H timeframe, but the lack of follow-through above resistance so far suggests hesitation. Price is essentially coiling beneath a ceiling, building pressure for a breakout or breakdown move in the coming sessions.
Bullish Scenario
If Bitcoin is able to cleanly break above the $89,000 resistance level, the key confirmation will be a successful retest of this zone from above. This area, once flipped into support, would offer a strong launchpad for continuation toward the next key target at $95,000. This target aligns with the measured move projection from the recent range and also represents a psychological milestone that may attract momentum buyers. A confirmed breakout and retest would signal strength from bulls and invalidate the prior resistance structure, transitioning it into new support.
Bearish Scenario
Alternatively, if price fails to break above the resistance zone and prints another rejection, I expect a retracement to follow. The first major area of interest on the downside is the imbalance zone between approximately $84,000 and $85,500. This level also aligns with the 0.236 Fibonacci retracement, and given the inefficiency left behind from the recent rally, it serves as a logical short-term support area. A bounce here would not be surprising, particularly on the first touch. However, should price break below and close beneath this zone, it would indicate weakness and open the door for a deeper corrective move.
The next major downside target in that case would be the golden pocket between $79,500 and $80,500. This zone carries strong confluence: it’s formed by the 0.618–0.65 Fibonacci retracement, a previously unfilled price void (PVG), and the base of the recent rally. Price reaching this area would likely attract interest from both buyers looking for re-entry and shorts looking to cover. A reaction from this level could set the stage for a medium-term bounce or even a new accumulation phase.
Current Stance
At the moment, my stance is neutral-to-bullish while price remains within the resistance zone. I'm closely monitoring for a clean breakout and retest, which would trigger a long setup targeting the $95K area. Until that breakout occurs, caution is warranted due to the risk of rejection and retracement. If price breaks down from the current level, I will shift my focus to lower support zones, particularly the imbalance region and the golden pocket, for potential long opportunities or further confirmation of bearish momentum.
Conclusion
Bitcoin is at a pivotal point technically. The structure and momentum suggest the possibility of a bullish continuation, but confirmation through breakout and retest is essential. A failure to break and hold above resistance will likely initiate a retracement, with the imbalance zone serving as the first major test. If that zone fails, a trip toward the golden pocket at $80K becomes increasingly probable. This is a reactive zone-to-zone environment, and both breakout and breakdown scenarios offer actionable setups based on confirmation.
__________________________________________
Thanks for your support!
If you found this idea helpful or learned something new, drop a like 👍 and leave a comment, I’d love to hear your thoughts! 🚀
Make sure to follow me for more price action insights, free indicators, and trading strategies. Let’s grow and trade smarter together! 📈

DXY - soon to the longWe are currently withdrawing liquidity that has accumulated over a couple of years and will go to close the gaps at the top
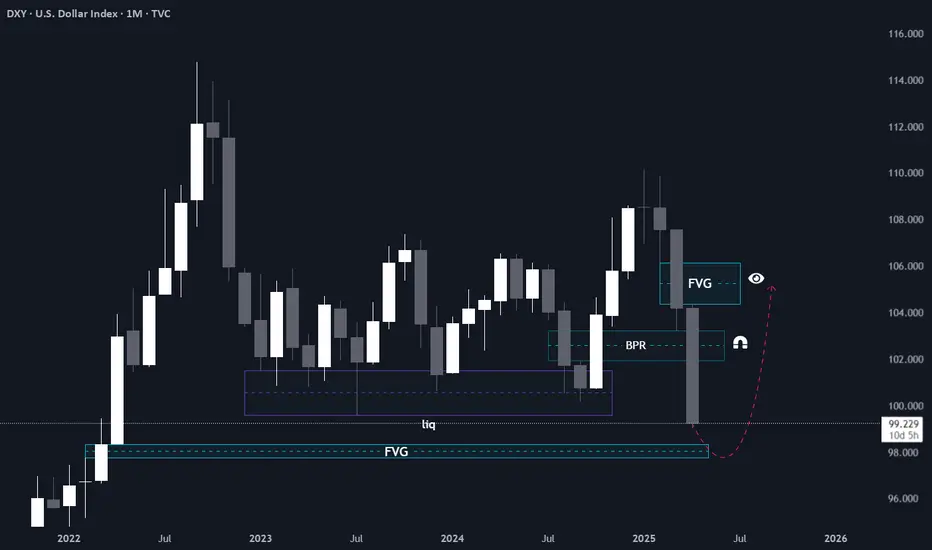
DXY - Monthly - ShortWe have reached the FVG Monthly, which we have been striving for more than two years.

Bitcoin - Who Will Take Control: Bulls or Bears?Bitcoin is currently exhibiting a prolonged phase of sideways movement, trading within a clearly defined consolidation range. After a sharp move to the upside earlier this month, price has stalled and started to range between the resistance zone near $86,000 and support around $82,000. This type of price action typically suggests indecision in the market, where neither buyers nor sellers are in full control.
The candles within this range are relatively choppy, with many wicks on both sides, further reinforcing the idea that this is a low-conviction environment. It reflects a battle between opposing market participants, and historically, such consolidations often precede strong directional moves. Until this range is broken, price is likely to continue moving sideways with potential for false breakouts and low-probability trade setups.
The Consolidation Range
The current consolidation is outlined with clear visual zones. The upper boundary acts as resistance and is highlighted in red, while the lower boundary, acting as support, is marked in green. The range itself is filled in blue, representing the broader area of indecision and price balance.
This consolidation is not minor—it has held for several days with multiple rejections from both the resistance and support levels. The more time price spends within a range like this, the more significant the breakout is likely to be. Liquidity builds up at the highs and lows of these ranges, and eventually one side will be taken out, leading to an expansion move.
Bullish Breakout Scenario
If Bitcoin manages to break and close decisively above the resistance zone, this would signal a potential shift in market sentiment toward the upside. A breakout above this level is likely to trigger stop-loss orders from short-sellers and attract breakout traders entering long positions.
The chart suggests that if this bullish breakout occurs, price will likely target the liquidity resting above recent swing highs, which are marked by the black horizontal lines. These levels represent areas where traders may have placed their stop orders, making them attractive targets for a price sweep. Following this, Bitcoin could enter a new trend phase, potentially setting up a continuation of the larger bullish structure that preceded the consolidation.
It is important, however, to wait for confirmation. A clean breakout followed by a retest or strong follow-through volume would provide greater confidence in a bullish continuation. Entering prematurely could result in being caught in a false breakout, especially in a ranging market like this.
Bearish Breakdown Scenario
Alternatively, if price breaks below the support zone with conviction, this would be a clear bearish signal. A move below the lower boundary of the range would imply that the buyers have been exhausted and that sellers have regained control.
In this scenario, the expectation is that price will seek out the inefficiencies and untested price action below, particularly the yellow zone marked on the chart. This area likely represents a previous gap or imbalance—zones where price moved rapidly in the past and did not spend much time. Such zones often act as magnets for price once a breakdown occurs, as the market seeks to fill in that inefficiency.
This bearish move could lead to a significant drop, potentially targeting levels as low as the upper $70,000s or even lower, depending on how strong the selling pressure becomes. Much like the bullish scenario, it's critical to watch for confirmation. A candle close below support with strong volume would be an ideal trigger for this bearish thesis.
No-Trade Zone and Strategy
Until Bitcoin breaks out of this range in either direction, there are no clear high-probability trades. Entering within the range is inherently risky due to the lack of momentum and high chance of reversals. Whipsawing price action can easily trigger stop-losses and create frustration for traders trying to anticipate moves before confirmation.
The most prudent approach in this situation is patience. Let the market show its hand. Once a breakout occurs, whether to the upside or downside, the path forward becomes more defined and trade setups with favorable risk-to-reward ratios will emerge. For now, this is a textbook no-trade zone—ideal for observing and planning, not for forcing entries.
Conclusion
Bitcoin is currently at a critical juncture. The ongoing consolidation is a precursor to a larger move, and while the direction is not yet confirmed, the zones of interest are clearly mapped out. A breakout above resistance will suggest a bullish continuation, targeting liquidity above recent highs. A breakdown below support will imply a bearish move toward the inefficiencies and untested price areas below.
In markets like this, discipline is key. The goal is to avoid getting chopped up in the range and instead position yourself on the right side once momentum returns. The next breakout will likely set the tone for the coming days or even weeks—so patience now could lead to greater reward later.
__________________________________________
Thanks for your support!
If you found this idea helpful or learned something new, drop a like 👍 and leave a comment, I’d love to hear your thoughts! 🚀
Make sure to follow me for more price action insights, free indicators, and trading strategies. Let’s grow and trade smarter together! 📈

Trading AUDUSD | Judas Swing Strategy 15/04/2025Tuesday's price action on FX:AUDUSD , we got a textbook Judas Swing play and for those still getting used to spotting these setups in real-time, let’s break this one down and talk through what happened and more importantly, why it happened.
Going into the session open, we had a relatively tight consolidation, with the 00:00 - 08:30est range acting as a container for liquidity. Price had built up liquidity at the high and low of the zone. Whichever side gets swept first will determine our directional bias for the session
Just after the session began, we saw price aggressively push up taking out the buy side liquidity resting above those early highs. This is what is called the "Judas move", a false breakout meant to trap breakout buyers and entice liquidity into the market. This move is not random. It’s designed to induce traders into the wrong side of the market before the real direction reveals itself
As soon as that liquidity grab was complete, we noticed price begin to stall and form a shift in market structure. This is critical. Once you see a break of structure to the downside, followed by a lower high into a FVG, that’s your confirmation that the real move, the sell-off is in play. We then saw clean displacement to the downside, confirming the manipulation phase was over
Now we wait for a retracement into the Fair Value Gap (FVG). We'll only look to execute a trade once a candle enters the FVG and closes. After a few minutes of waiting, price finally retraced into the FVG, giving us the green light to execute the trade.
Entry: 0.63749
Stop loss: 0.63849
Take profit: 0.63549
This FX:AUDUSD trade gave us a smooth ride with minimal drawdown. Right after entry price moved swiftly into profit. Although there was a brief retrace back to our entry point, it quickly corrected, and we were back in the green. With just a 1% risk, the trade delivered a solid 2% return all within 1 hour and 20 minutes
This setup is an excellent example of why you don’t want to chase early session breakouts blindly. The Judas Swing strategy teaches us to look for the trap, wait for confirmation, and then trade in alignment with the real intention behind price. Beginners often get caught up in the initial move, thinking it’s the real trend. But if you can slow down, understand the time of day, the draw on liquidity, and the reaction around key highs/lows, you’ll start to see how often price manipulates before delivering.

What Is a Balanced Price Range, and How Can You Use ItWhat Is a Balanced Price Range, and How Can You Use It in Trading?
Balanced Price Ranges (BPRs) offer traders insight into areas where market forces temporarily balance. Understanding how BPRs form and how to use them can help traders identify key zones of interest on the chart. This article explores the details of BPRs, their applications in trading, and how combining them with other tools can refine your market analysis.
What Is a Balanced Price Range (BPR)?
A Balanced Price Range (BPR) is an Inner Circle Trader (ICT) concept used to pinpoint areas on a price chart where market activity reflects a temporary equilibrium between buyers and sellers. These zones, often identified through overlapping Fair Value Gaps (FVGs), highlight price levels where buying and selling pressures have offset each other, creating a balance.
Here’s how it works in a bullish scenario: a rapid price move downward leaves a bearish Fair Value Gap—a price range the market skips over due to strong selling momentum. If the price rises with equal intensity shortly, creating a bullish Fair Value Gap in the opposite direction, the overlapping region between these gaps becomes the BPR. This overlap represents a zone of temporary balance, where the market has effectively “corrected” the earlier imbalance.
BPR zones are not random. They often form in areas of high market interest—perhaps near key support or resistance levels, or after significant news events that cause sharp price movements. Traders look at these ranges because they frequently act as reference points for future price reactions.
The boundaries of an ICT BPR—its high and low—serve as critical levels. These edges often function as dynamic support and resistance, helping traders gauge potential turning points. Furthermore, BPRs can appear across various timeframes, from minute-by-minute to weekly charts.
How Does a Balanced Price Range Form?
Now that we know the idea of the ICT Balanced Price Range, let’s look at how it forms step by step.
1. An Initial Price Imbalance
A BPR begins with a strong price movement in one direction—either up or down. For example, in an overall bearish scenario, buyers initially drive the price up rapidly and leave behind a bullish FVG. This gap reflects an area where the market didn’t fully engage, often skipping over price levels due to overwhelming demand.
2. A Counter-Move Creates an Opposing Gap
After the initial move, the market can shift in the opposite direction with equal momentum. In our example, sellers step in, pushing the price downward. This creates a bearish FVG that partially overlaps with the earlier bullish FVG. These rapid shifts often occur around key events, such as news releases or liquidity grabs, which ignite temporary market imbalances.
3. Overlapping Fair Value Gaps Define the Range
The overlapping portion of the bullish and bearish FVGs is what forms the BPR. This zone represents the price levels where buying and selling forces are temporarily balanced, neutralising the earlier imbalances.
4. Market Consolidation and Testing
Once the BPR is established, the price often consolidates near this range. This zone acts as a magnet for future price action because it’s seen as an area of high market interest, where traders may take note of previous balance. In the example given, a test may precede a bearish reaction.
Combining BPRs With Other ICT Concepts
Balanced Price Ranges in the ICT methodology become even more powerful when combined with other related concepts. By layering multiple tools, traders can refine their analysis and pinpoint high-probability areas for market activity. Here’s how BPRs work with key ICT concepts:
Fair Value Gaps
Since BPRs are defined by overlapping fair value gaps, understanding how to read these gaps adds depth to BPR analysis. FVGs outside the BPR can act as supplementary zones of interest.
Order Blocks
Traders often spot BPRs forming near significant order blocks. When these zones overlap, they highlight areas where institutional activity may have left a footprint, increasing their importance for analysis.
Liquidity Pools
BPRs often align with liquidity zones where stop orders are clustered. Price may gravitate toward these areas before reacting, offering traders insight into potential price reversals or continuations.
Market Structure Shifts
BPRs can reinforce insights gained from market structure shifts. For example, a BPR forming after a break in structure might signal consolidation before the next major move.
Higher Timeframe Confluence
When a BPR aligns with key levels on higher timeframes, it can provide added confidence in the zone’s relevance for price reactions.
How to Use a Balanced Price Range
The Balanced Price Range can provide traders with valuable insights into price behaviour, acting as a reference point for analysing potential market movements. By understanding how these zones function, traders often use them to refine their strategies and enhance their market analysis.
Identifying High-Interest Zones
As BPRs highlight areas where the market found an equilibrium between buyers and sellers, traders typically monitor how the price reacts when revisiting a BPR. For example, if the price approaches the upper or lower boundary of a BPR, it may indicate a potential turning point or a continuation, depending on the market context.
Support and Resistance Dynamics
One common approach is to view BPRs as dynamic support or resistance zones. When the price tests the range, traders often anticipate a reaction. For instance, a rejection from a BPR in a bearish trend may suggest continued downward momentum, while a breach might signal weakening selling pressure.
Contextualising Larger Market Structures
BPRs don’t exist in isolation; they often align with broader market structures. Traders may use them in combination with tools like liquidity zones or order blocks to build a more complete market picture. For instance, if a BPR forms near a major resistance level on a higher timeframe, this confluence could strengthen its importance as a reference point.
Adjusting for Timeframe and Strategy
The relevance of a BPR often depends on the timeframe being analysed. Day traders might focus on intraday BPRs to find potential trading opportunities, while swing traders could look for these zones on higher timeframes, considering them significant levels for long-term moves. Either trader can use lower and higher timeframe BPRs to inform their analysis and entries.
Managing Risk Around BPRs
Traders may incorporate BPRs into their risk management plans, such as by using the boundaries of the range to set stop-loss or take-profit levels. A breach of these levels can indicate a shift in market sentiment, helping traders refine their analysis.
Risks and Considerations When Using BPRs
While BPRs can be a useful tool for analysing price behaviour, they aren’t without limitations. Traders need to approach BPRs with a clear understanding of their potential pitfalls. Here are some key considerations:
- Not Predictive: BPRs don’t guarantee future price movement. While they highlight zones of interest, traders must combine them with broader market analysis to avoid over-reliance.
- Subjectivity: Identifying BPRs can sometimes be subjective. What one trader sees as a balanced range might not align with another’s interpretation, especially on different timeframes.
- Timeframe Sensitivity: A BPR on a lower timeframe may lose significance in the broader market context. Conversely, higher timeframe BPRs may lag behind fast-moving markets.
- False Breakouts: Price can move beyond a BPR briefly before reversing, creating potential traps for traders relying solely on breakout strategies.
- Market Context Matters: BPRs are analysed alongside market conditions like volatility, news events, or broader trends. Ignoring these factors can reduce their reliability.
The Bottom Line
Understanding Balanced Price Ranges can help traders interpret key market zones and improve their analysis. By combining BPRs with other tools and strategies, traders gain deeper insights into price movements.
FAQ
What Is the ICT Price Range?
The ICT price range refers to specific price levels or zones highlighted in the Inner Circle Trader (ICT) methodology. These ranges often represent areas of interest in the market, such as liquidity pools, fair value gaps, or balanced price ranges. Traders use ICT price ranges to analyse price movement, identify potential reaction points, and refine their trading strategies.
What Is the Meaning of a Balanced Price?
Balanced price describes a market state where buying and selling pressures are in equilibrium. It typically forms in areas where overlapping fair value gaps exist, reflecting zones where previous imbalances have corrected. These areas can act as key levels for future price reactions.
What Is an Optimal Trade Entry in a Balanced Price Range?
Optimal trade entry in a balanced price range refers to identifying high-probability entry points within or near a BPR. Traders often look for price reactions at the range’s boundaries, combining BPR analysis with other ICT tools, such as order blocks or liquidity zones, to refine their approach.
This article represents the opinion of the Companies operating under the FXOpen brand only. It is not to be construed as an offer, solicitation, or recommendation with respect to products and services provided by the Companies operating under the FXOpen brand, nor is it to be considered financial advice.

EURUSD – Pullback before a new move?EURUSD has been consolidating for several sessions now after making a strong impulsive move to the upside earlier this month. Since breaking above the 1.1150 level, momentum has started to slow down and price is beginning to range near the recent highs. That alone isn’t surprising strong impulsive moves are almost always followed by periods of consolidation or retracement as the market pauses, takes profits, and reevaluates.
What catches my attention now is how weak the price action looks during this consolidation. The candles are getting smaller, wicks are getting longer, and there’s not much follow-through on the bullish side anymore. This kind of price behavior typically shows indecision or exhaustion buyers are no longer driving price with the same force and sellers are starting to creep back in.
So instead of chasing this move higher, I’m positioning myself for a pullback into a key demand zone that I think will offer a much higher probability long setup.
The Level I’m Watching – Golden Pocket with Imbalance Confluence
The zone I’m targeting for a potential entry sits in the 1.1070 to 1.1170 area. This range covers the golden pocket retracement zone, between the 61.8% and 65% Fibonacci levels measured from the recent impulse low to high, and overlaps with multiple technical factors that make it extremely attractive.
First off, this zone contains three separate unfilled imbalance areas (or fair value gaps), created by aggressive bullish candles on the way up. These are areas where price moved too quickly to fill all orders on both sides, which leaves inefficiencies in the market. The market tends to revisit these areas to rebalance before continuing in the prevailing direction. So from a pure price action perspective, the unfilled imbalances create a natural magnet for price to retrace into.
Second, we’ve got historical resistance right in this same zone. If you look back a few sessions, price rejected this level multiple times before finally breaking through. Now that we’re above it, there’s a strong chance this area flips into support. This concept resistance turning into support is a classic and reliable price action behavior, especially when it lines up with other tools like fibs and imbalances.
Trend Structure Still Intact
What’s crucial to me here is that a pullback into this zone will not break the overall bullish market structure. We’re still printing higher highs and higher lows, and a retracement into the golden pocket would simply be another higher low within the current uptrend.
There’s also a clean ascending trendline from early April that hasn’t been breached. If price respects that trendline again while dipping into this demand zone, that would add further confluence to the setup. It would mean the trendline, golden pocket, unfilled imbalances, and historical support are all lining up at the same point that’s a textbook area where I want to be a buyer.
Entry Triggers and Execution Plan
I’m not looking to blindly set a limit order in this zone. I want confirmation that buyers are stepping in and that we’re getting a shift in momentum. Ideally, I’ll drop to a lower timeframe like the 1H or even the 15M and wait for a clear change of character — something like:
A break of a local lower high
A bullish engulfing candle at the base
A sweep of liquidity below recent lows followed by a strong push back above structure
Once I see that kind of reaction, I’ll consider entering a long position. My stop will go just below the structure low or the lowest point of the zone, depending on the entry signal. I’ll give it enough room to avoid getting wicked out on a false break.
As for targets the first obvious one is the current range high around 1.1350. If we get a strong reaction, I’ll trail part of the position and look for continuation into new highs. This pullback could set the stage for the next leg of the broader bullish trend, especially if DXY starts showing weakness again.
Why I’m Not Shorting Here
Even though price looks weak and a retracement seems likely, I’m not interested in shorting this setup. We’re still firmly in bullish structure and shorting into a healthy uptrend just doesn’t make sense to me unless I’m scalping. The risk to reward just isn’t favorable on the short side right now I’d rather wait for price to come to my zone and then look for confirmation to go with the trend.
Final Thoughts
EURUSD is consolidating after a strong move up and I’m expecting a pullback. The golden pocket zone, stacked with unfilled imbalances and previous resistance, looks like the ideal place for a bullish reaction. As long as we stay above that zone, structure stays bullish and I’ll be looking for long opportunities once price confirms the bounce.
Patience is key here. I’m not rushing into anything, but if price gives me the reaction I’m looking for in that zone, I’ll be ready to execute. The setup aligns well with both technical structure and market behavior and I’ll continue to monitor price action closely over the next few sessions.
__________________________________________
Thanks for your support!
If you found this idea helpful or learned something new, drop a like 👍 and leave a comment, I’d love to hear your thoughts! 🚀
Make sure to follow me for more price action insights, free indicators, and trading strategies. Let’s grow and trade smarter together! 📈

GBPUSD: Buy Entry Win. HOW LOL
SO I was able to win this. idk how. but..
oh wait I know.
Here's what I did right.
0. I checked the Levels (W>D>HR>KEY LEVELS) of the Forex Market pairs on Saturday.
-I plan to keep re-assessing this every week, as practice, and to see how price is moving.
1. I assessed day bias & market intention. I guess I hit the nail on the head here.
2. Saw price trending up, so I plotted my fib and frvp. Confluenced with FVG.
3. Instead of entering on the OTE Zone, I waited to see if it would be respected. It did.
4. Instead of putting a limit entry, I set an alarm on my intended entry zone. So when it got hit, I setup my buy limit.
-I think I can improve this by putting a buy stop limit on the OTE ZONE as entry trigger, and the actual buy stop at the intended entry zone. So, if OTE is HIT, then activate LIMIT ENTRY @ price breakout(the choch line)
5. I looked farther to the left to see what's a probable target. I found one, so I targeted it. It was the weekly & daily FVGs above.
It's more or less lucky that I hit it? Price really just had a strong momentum... and before the momentum, it hit a bullish fvg below.
What happens after price rebalances an FVG? It seeks liquidity on the opposite side. This is what happened. And I caught it right this time.

USD/JPY - What to expect as price consolidates above support?Introduction
The USD/JPY pair has been in a clear daily downtrend, marked by a bearish market structure and strong downside momentum. Sellers remain firmly in control, consistently driving prices lower as the pair respects the prevailing trend. Each failed recovery attempt only reinforces the bearish structure, suggesting that the path of least resistance continues to be to the downside.
FVG
Following the most recent drop, the pair is now consolidating just above a key support level. A short-term relief bounce toward the 4-hour Fair Value Gap (FVG) wouldn't be unexpected. This particular FVG, formed during the last leg down, remains unfilled — and such gaps are often revisited before the trend resumes.
Confluences
Notably, this FVG aligns with the Golden Pocket Fibonacci retracement zone (0.618–0.65), adding further confluence and making it a potentially strong resistance area. If price does retrace into this zone, it could face significant selling pressure and resume its move back toward the daily support zone.
Conclusion
While a bounce from daily support is possible, I expect USD/JPY to encounter resistance at the 4H FVG level. This could cap any recovery attempts and signal a continuation of the broader bearish trend.
Thanks for your support.
- Make sure to follow me so you don't miss out on the next analysis!
- Drop a like and leave a comment!

Bitcoin - Rejection at Resistance: Watching $80K and BelowBitcoin is currently trading within a tight range between $84,000 and $85,000, a region that has acted as a strong resistance multiple times in the recent past. Bulls have tried to break through this level, but we’re starting to see some clear signs of exhaustion. Price is struggling to create a new higher high, and unless we see a clean breakout above this resistance, this could be the early signs of a lower high formation.
A failure to break out here would indicate that bullish momentum is starting to fade, and that sellers are gaining control again in this zone. This could open the door for a short-term pullback before we see any renewed upside.
Major Resistance Holding Price Down
The red zone on the chart marks a key supply area, where sellers continue to step in aggressively. Multiple rejections have formed here, which gives this level more weight. Unless Bitcoin sees a strong breakout above $85,000 with volume, this area will likely hold price down.
What we want to watch now is whether price can push through this resistance or whether it will roll over and confirm the rejection.
Short-Term Bearish Bias – Eyes on Imbalance Zone
If Bitcoin fails to break above this resistance, the most logical target on the downside becomes the $80,000 range. This level is interesting for two reasons:
It lines up with an unfilled imbalance zone on the 4H chart.
There’s also the 0.5 Fibonacci retracement level in the same area.
This imbalance acts like a magnet for price, pulling price back into it to rebalance the inefficiency in the market. If momentum shifts to the downside, this is a very likely level for price to revisit. I’ll be watching this area closely for potential bullish reactions or continuation setups depending on how price behaves once we tap into it.
Strong Support and Golden Pocket Below
If the $80K zone doesn’t hold, I’ll be turning my attention towards the next major area of interest — the $78,500 level. This is where we have two very strong factors aligning:
The 0.618 Fibonacci retracement level (also known as the golden pocket).
A key historical support zone that has held well in previous pullbacks.
This level has a lot of confluence, which increases the chances of seeing a reaction or reversal from here if we drop that far. In my opinion, this is one of the strongest zones currently sitting below us. If price gets here, I’ll be watching closely for a solid long setup.
What Comes Next?
For now, I remain cautiously bearish in the short term. Price has been rejected at resistance and hasn’t shown the strength to break out just yet. If we start forming more lower highs and lose the support structure at $84K, I think we’ll make our way back down toward $80K.
What happens at that point will be key:
Bounce from $80K? We could get a short-term relief rally and retest the resistance.
Fail to hold $80K? Then I’m expecting price to dig deeper into the golden pocket and potentially find strong support at $78.5K.
At this stage, I’m not looking for longs unless price gives a clear reaction from one of the key levels below. The risk-to-reward on shorts looks more attractive while we remain under resistance.
Summary
Resistance at $85K–$84K is still holding strong.
If rejected here, I’m targeting $80K (imbalance zone).
Below that, $78.5K is a major support with golden pocket confluence.
Short-term bias is bearish unless we break above resistance with volume.
Watching for clean setups around these levels before taking action.
__________________________________________
Thanks for your support!
If you found this idea helpful or learned something new, drop a like 👍 and leave a comment, I’d love to hear your thoughts! 🚀
Make sure to follow me for more price action insights, free indicators, and trading strategies. Let’s grow and trade smarter together! 📈

SUI: Into the Trap — or Out of It?Looks like smart money just left breadcrumbs. We’ve got a clean structure break followed by a classic Fair Value Gap — price wicked into it and held. This kind of move often signals reaccumulation before expansion.
If this is a trap, it's beautifully laid. If it's a setup — it's surgical.
Expecting a bounce from the FVG zone back toward the recent highs around 2.36.
Entry: $2.21-2.23
Stop-loss: $2.19
Target: $2.36
Risk/Reward: 2.89
More thoughts in my profile @93balaclava
Personally I trade on a platform that offers low fees and strong execution. DM me if you're interested.

CADJPY possible Bullish My analysis for CADJPY expect that price will move down to take liquidity at Point A. Following this liquidity grab, I will be looking for confirmation signals of bullish momentum. If confirmed, the first profit target would be within the Fair Value Gap (FVG) at Point B, second profit target would be the liquidity level at Point C.

BTC is exhibiting a bullish trend and pushing upwards!BTC Market Update:
Currently, BTC is exhibiting a bullish trend, having broken through its previous resistance levels and pushing upwards from its pivot demand arrays. This upward momentum is further validated by the formation of a bullish order block (BOS), indicating a strong potential for continued growth.
On higher time frames, BTC's price action is aligning with its pivot demand arrays, reinforcing the bullish outlook. Additionally, the recent SMT (Smart Money Technique) formation suggests a potential for further upside movement.
We are anticipating a pullback to the marked inverse FVG (Fair Value Gap) zone, which will likely provide confirmation for the next leg up. If confirmed, BTC could potentially surge towards its daily or range high levels.
We will continue to monitor the market closely and await confirmation before making further assessments.

Bitcoin - Bulls Took Control: 85k Next?Bitcoin continues to show signs of strength as the previously formed double bottom structure remains valid. This pattern, commonly associated with a bullish reversal, suggests that buyers have successfully defended a key support area and are now regaining control. The second bottom reinforced the significance of this level, confirming the presence of demand and a potential shift in momentum.
Unlike the previous scenario where bearish pressure threatened to invalidate the pattern, this time the market has respected the formation. The double bottom is holding firm, and price has begun to move higher, offering further confirmation of short-term bullish intent.
Support Found Within the 4-Hour Imbalance
A critical turning point in the current price action came as Bitcoin dipped into a 4-hour imbalance zone and found strong support. This area, marked by a sharp displacement in price, often acts as a magnet for liquidity before the market continues in its intended direction. The bounce from this imbalance not only held but was followed by a decisive move above the zone.
This development is important because it confirms that buyers were waiting in this inefficiency to accumulate, and the resulting upward movement reinforces the idea that this was a high-probability support level. The break above the imbalance now positions Bitcoin to potentially pursue higher liquidity areas.
Potential Move Toward the 4-Hour Fair Value Gap
With the imbalance zone now acting as support, price appears poised to push higher into the next key area: the 4-hour fair value gap located above. This FVG has not yet been fully filled, and Bitcoin has historically shown sensitivity to this zone, rejecting multiple times from it without managing to reclaim or fill even 50% of the gap.
Given the current bullish structure and momentum, there is now a real possibility that price could seek to fill this fair value gap more substantially—potentially up to the 85,000 region. This would align with the typical behavior of price returning to inefficiencies in the market, especially when backed by a valid reversal pattern such as the double bottom.
The 85,000 area also overlaps with a previously defined resistance, so while this presents a logical target for bulls, it may also be where sellers attempt to reassert themselves. Watching price behavior as it approaches this zone will be crucial for managing risk and spotting any early signs of reversal.
Conclusion
Bitcoin is currently respecting the double bottom structure and has found renewed strength after bouncing from the 4-hour imbalance zone. With price now above this key support, the path of least resistance appears to be to the upside, targeting the fair value gap near 85,000. This zone remains unfilled and represents a likely draw for price in the short term.
Unless we see a strong rejection or sudden weakness, the current setup supports a bullish continuation scenario, with eyes on a partial or full fill of the FVG. Traders should continue to monitor the strength of this move and look for reactions near the 85,000 level to determine whether momentum will sustain or fade.
__________________________________________
Thanks for your support!
If you found this idea helpful or learned something new, drop a like 👍 and leave a comment, I’d love to hear your thoughts! 🚀
Make sure to follow me for more price action insights, free indicators, and trading strategies. Let’s grow and trade smarter together! 📈

BTC - breakout or bull trap in progress?Yesterday, Bitcoin broke out of the descending trendline it had been respecting for several days, forming a clear double bottom in the process — a classic reversal pattern suggesting bullish intent. Since then, price action has shifted into a consolidation phase, hovering just beneath a key liquidity zone filled with stop-loss orders from prior short positions.
This area aligns closely with the previous 4H lower high, above which lies a fair value gap (FVG) that hasn't yet been fully filled. A move into this region seems likely, especially with liquidity resting above the prior high. We could see BTC targeting a partial fill — around the 50% mark — of that 4H FVG before any significant reaction occurs.
On the way up, BTC also created another 4H FVG. It’s likely that price could revisit and partially fill this imbalance before continuing its move higher. This zone could serve as an ideal retracement area for bulls to re-enter, especially if the market seeks to rebalance before making a stronger push.
Looking ahead, the $85.5K level stands out as a highly probable target. It marks a key psychological and technical resistance zone and is a magnet for liquidity. With momentum building and the current structure leaning bullish in the short term, a sweep of that level in the coming days is entirely plausible.
However, it's important to zoom out. Despite this bullish momentum, the broader market structure remains bearish. Unless BTC breaks above and holds above this larger structure convincingly, rallies are more likely to be liquidity grabs rather than true trend reversals. Once $85.5K is tagged, there's a real possibility of a sharp rejection — potentially sending price back toward local lows or even printing new ones.

Bitcoin – Double Bottom at Risk as Fair Value Gap Rejects PriceBitcoin recently formed a potential double bottom pattern, a classical bullish reversal formation that often signals a shift in market sentiment from bearish to bullish. This pattern is typically interpreted as a sign that the market has found a significant support level, where buying interest is strong enough to halt the prior downtrend. The structure is generally confirmed when price breaks above the neckline, leading to a continuation move to the upside.
In this case, the double bottom suggests buyers are attempting to establish control and potentially drive price higher. However, while this pattern often results in upward movement, it should not be taken in isolation. The context surrounding this pattern is critical, especially when factoring in additional technical elements currently influencing Bitcoin’s price action.
Fair Value Gap on the 1-Hour and 4-Hour Timeframes
Despite the bullish implications of the double bottom, Bitcoin is currently trading within a fair value gap (FVG) on both the 1-hour and 4-hour charts. Fair value gaps represent zones of inefficiency created when price moves too quickly in one direction, leaving behind an unbalanced area in the market. These gaps often act as magnets for price to return and rebalance before a continuation or reversal.
As of now, Bitcoin has not demonstrated strong acceptance above this fair value gap. Instead, price is consolidating or slightly pulling back within this region, signaling that the move higher might be losing momentum. If the current candle closes below this FVG zone, especially on the 4-hour timeframe, it could indicate that bulls are running out of steam. Such a development would weaken the bullish case and suggest that the earlier double bottom may be invalidated.
This would shift the narrative toward a more bearish outlook, potentially opening the door for a deeper retracement or even a new leg down. It’s crucial to watch how price behaves around the FVG, as a decisive close below it would highlight weak demand and the possible presence of distribution rather than accumulation.
Rejection from a Key Resistance Level
Adding further weight to the bearish risk is the recent strong rejection from a significant resistance level. This area has acted as resistance in the past and once again proved formidable as Bitcoin failed to break through with conviction. The rejection was sharp and occurred precisely as price entered the fair value gap, reinforcing the idea that this zone may be acting as a trap for longs rather than a springboard for further gains.
This resistance area may now serve as a local high. Unless bulls can reclaim this level with strong momentum and volume, the path of least resistance appears to be to the downside. The inability to break through this resistance while trading within a fair value gap further suggests that current market strength may be overstated.
Critical Levels to Watch
The lower boundary of the fair value gap is the most immediate level of interest. A 1-hour or 4-hour close below this area would be a clear sign of weakness.
The support zone formed by the double bottom must hold to keep the bullish thesis intact. A break below this level would fully invalidate the pattern.
On the upside, the resistance that caused the recent rejection needs to be reclaimed decisively to confirm renewed bullish strength.
Conclusion
In summary, while Bitcoin initially showed signs of bullish reversal via a double bottom formation, the surrounding market context introduces significant doubt. Price is currently stalled within a fair value gap on the 1H and 4H timeframes, and the failure to maintain strength within this zone could invalidate the double bottom entirely. Furthermore, a strong rejection from key resistance suggests that sellers are still present and actively defending higher levels.
A close below the FVG zone would signal that bulls are losing control, and downside continuation becomes more likely. Traders should remain cautious here, avoiding premature bullish entries unless there is clear evidence of strength, such as a reclaim of the FVG and a strong move above resistance. Until then, the risk of a deeper drop remains very real.
__________________________________________
Thanks for your support!
If you found this idea helpful or learned something new, drop a like 👍 and leave a comment, I’d love to hear your thoughts! 🚀
Make sure to follow me for more price action insights, free indicators, and trading strategies. Let’s grow and trade smarter together! 📈

SOL — Clean Liquidity Grab & FVG Flip. Mid-Term Setup in PlayClassic move on SOL — liquidity sweep, inverted the FVG, and pushed higher. Textbook stuff.
Not expecting an instant pump, this one looks more like a mid-term play… although, with SOL, you never know.
Stay sharp. And follow to catch the next ones early.
Entry: 109
TP: 123-148

AUDUSD Long – Fair Value Gap + Macro Confluence + Bullish LEI AUDUSD Swing Long Setup – Technical + Macro Confluence
✅ Bias: Long AUD/SD
Based on a multi-factor thesis:
Macro: RBA steady; AUD LEI rising steadily (87 → 96), Endogenous improving
USD Weakness: Fed dovish + GDP downgraded = downside pressure
Seasonality: USD historically weak entire April

Examples of invalid setups | Judas Swing Strategy 07/04/2025As traders, it's crucial to spend time in the lab backtesting your strategy and exploring ways to optimize it for better performance in live markets. You’ll start to notice recurring patterns, some that work in your favor, and others that consistently lead to unnecessary losses. It might take time to spot these patterns and even longer to refine them to fit your trading system, but going through this process is what helps you evolve. In the long run, this is what you need to do to become a better trader.
We spent a considerable amount of time refining our entry technique for the Judas Swing strategy after noticing a recurring issue where entering with a limit order sometimes gets us stopped out on the very same candle. After testing a few alternative entry methods and making some key adjustments, we finally found an approach that worked consistently for us. On Monday, April 7th, 2025, this refinement proved its worth by saving us from two potentially painful losses. In this post, we’ll walk you through exactly what happened and how the improved entry made all the difference.
We got to our trading desks ready to scout for setups and were drawn to promising setups forming on both FX:AUDUSD and $NZDUSD. This was exciting since the previous week offered no solid trading opportunities. As price swept the liquidity resting above the highs of the zone our bias quickly shifted toward potential selling setups for the session. But before taking any trade, we always ensure every item on our entry checklist is met. Here’s what we look for:
1. A break of structure to the sell side
2. The formation of a Fair Value Gap (FVG)
3. A retracement into the FVG
4. Entry only after a confirmed candle close
With the first two requirements on our checklist confirmed, all that remained were the final two and at this stage, patience is key. As price began retracing toward the FVG on both FX:AUDUSD and OANDA:NZDUSD , things got interesting. Price came into the Fair Value Gap on both pairs, checking off the third requirement. Now, all that was left was to wait for the current candle to close.
But that’s where things will be clear to you now.
Had we jumped in early with a limit order, we would’ve been stopped out on the same candle. This moment served as a perfect reminder of why we now wait for a confirmed candle close before taking any trade. It’s this extra step that helps us avoid unnecessary losses and stick to high-quality setups.
This entry technique like any other, comes with its own set of pros and cons. At times a limit order might offer a more favorable entry price compared to waiting for a candle close and that can influence both your stop-loss and take-profit placements. On the flip side, there are also instances where waiting for the candle close gives you a better entry than the limit order would have. That’s why it’s so important to backtest.
Your job as a trader is to put in the time to study and test what works best for your system. We chose this candle close entry method because we did the work. After extensive backtesting and data analysis, we found this approach aligns best with the results we aim for in the long run.

NZDUSD Long Setup – FVG + Order Block + Macro Bullish BiasI'm looking to go long on NZDUSD based on a strong confluence of fundamentals, seasonal trends, and technical structure.
🔹 Macro bias: USD weakening as Fed leans dovish, while NZD is gaining momentum from rate cuts and improving LEI.
🔹 Seasonality: Historically, NZD shows strength in the first half of April, while USD tends to weaken mid-to-late April.
🔹 Technical setup:
Price left a Fair Value Gap (FVG) on the 4H chart
Pullback into a bullish Order Block (OB)
Entry within imbalance

Ultimate Guide to Smart Money ConceptsWhat Are Smart Money Concepts?
Introduction:
If you’ve been trading for a while, you’ve probably noticed that sometimes the market moves in ways that just don’t make sense. You’ve got your technical analysis all set, but the market seems to go in the opposite direction. That’s where Smart Money Concepts (SMC) come in.
At its core, SMC is all about understanding how big players in the market (think hedge funds, institutions, and banks) move prices. These players have massive amounts of capital and information, and they don’t trade like the average retail trader. Understanding their behavior can help you see where the market is going next before it happens.
What is Smart Money?
In the world of trading, smart money refers to the institutional investors who move markets with their huge orders. Unlike retail traders, who might be relying on indicators or patterns, smart money trades based on liquidity, market structure, and order flow.
While retail traders are typically reacting to price movements, smart money is the one causing those moves. They’re out there seeking out places where they can accumulate positions or distribute them. The tricky part is that they’ll often make the market go in one direction just to trap retail traders and get them to take positions before flipping it back to where they wanted it to go in the first place.
Key Concepts in Smart Money Trading
1. Market Structure
Market structure refers to the way price moves in a trend. It’s essentially a pattern of higher highs and higher lows for an uptrend, or lower highs and lower lows for a downtrend.
Smart money uses these patterns to their advantage. When they see the market creating a series of higher highs and higher lows, they’ll take advantage of that momentum to push prices further, knowing retail traders will follow along.
But when they want to reverse the market, they’ll push it in the opposite direction, creating a market structure shift or a break of structure, which signals that the trend is over and a new one is starting.
2. Liquidity
Liquidity refers to the amount of orders available to be filled at different price levels. Smart money knows exactly where retail traders are likely to place their stops or buy orders.
They’ll often push the price to these levels, triggering those stops and collecting the liquidity. Once that liquidity is grabbed, they’ll reverse the price and move it in the intended direction.
A common way to spot liquidity is by looking for equal highs or equal lows, where traders often place their stop-loss orders. These are often areas smart money will target.
3. Order Blocks
Order blocks are areas on the chart where institutions have placed big orders. These are key levels that represent where price might return to later, and they can act as areas of support or resistance.
Order blocks are usually found after big price moves. Institutions place these orders to either accumulate positions or offload them, and price often comes back to these levels to fill orders that were left behind.
4. Fair Value Gaps (FVG)
Fair value gaps, or imbalances, are price areas where the market moves quickly, leaving gaps between candlesticks. These gaps represent areas where the market has moved too fast for regular orders to fill, and price tends to return to these levels to fill the gaps.
Smart money knows that these imbalances are critical areas for future price action, and they’ll use them to re-enter the market after a move has been completed.
Why Does Smart Money Matter?
Understanding smart money concepts is like learning to think like an institution. Instead of chasing after price based on typical retail indicators, you start looking for the big moves that smart money is making. You begin to notice when the market is setting traps for retail traders, and how these large players accumulate positions before pushing price in a big way.
With SMC, you stop guessing and start anticipating. By looking for liquidity zones, order blocks, and market structure shifts, you can get in sync with the big players and follow their moves, not fight them.
Conclusion
Smart Money Concepts are all about shifting your perspective. Instead of thinking like a retail trader looking for quick breakouts, oversold/overbought conditions, or chasing trends — start looking at the market as the big players do. Pay attention to where the liquidity is, identify key order blocks, and use market structure shifts to guide your trades.
By learning to spot these key signs, you’ll stop being the one who’s trapped and start being the one who’s in sync with the smart money.
Ready to trade smarter? Keep an eye on those order blocks and liquidity zones — they’re where the real money is made.
Next Steps
- Start practicing by reviewing charts through the SMC lens.
- Keep refining your understanding of market structure, liquidity, and order blocks.
- Stay patient, smart money trades aren’t about quick wins, but about positioning yourself for big moves.
__________________________________________
Thanks for your support!
If you found this guide helpful or learned something new, drop a like 👍 and leave a comment, I’d love to hear your thoughts! 🚀
Make sure to follow me for more price action insights, free indicators, and trading strategies. Let’s grow and trade smarter together! 📈

USDJPY = Win. Finally? I have shit winrate, but at least this trade is "logical", and has followed the trading plan lol.
TRADING SPECS:
BIAS = DOWNTREND
NARRATIVE = 4HR BEARISH PD ARRAY(S/R FLIP+FVG)
CONTEXT = RESPECTED PREMIUM ARRAY + A Wave
ENTRY = SELL STOP ORDER @ A WAVE LOW (RUN ON LIQUIDITY). Nearly got SL'd. OPTIMAL ENTRY WOULD HAVE BEEN THE BEARISH FVG AFTER THE "4HR PREMIUM ARRAY REBALANCE" INSIDE CONTEXT AREA. THERE WAS A SHARP TURN IN THERE SOMEWHERE BUT I DIDN'T WAIT FOR THAT.
RISK MANAGEMENT = N/A(?) JUST LET TRADE PLAY OUT. BUT SL WAS INSIDE THE ORDERFLOW LEG(?)
Here's how it went:
1. Assessed Day Bias - price was downtrending. checked orderflow and candle science for this shit
2. Assessed Current Price "Intention" - price only does two things: seek liquidity, and rebalance fair value.
When I plotted my Key Levels, price was at a point where it was just done seeking liquidity(support + poc was swept) and it was reversing.
I see an S/R Flip + FVG area. If price goes here, that means price has rebalanced fair value.. so, logic dictates that it will reverse again to SEEK LIQUIDITY.
When I came back to this chart again, price has already rebalanced fair value, has respected the S/R Flip + FVG, and has started reversing down.
3. Picked Out a Target - I picked out something realistic. Here is where indicators/tools come in.
Instead of using my confluence mix(POC+FVG+OTE pd array) as entry points,
"I just used it as a target since... price has already rebalanced fair value at the higher TF, and it's already going down, so it's probably going to seek liquidity on the other side. It's most probable target before price may or may not do something else is the FVG+POC+OTE AREA."
My choice of liquidity category was the Previous Day Session nPOC. Along with the FVG and OTE, it was a strong "magnet", especially considering that price has finished seeking buy side liquidity and therefore the price's next target are the liquidities below.
Wow, this makes so much sense to me now.
Price always intend to bounce from opposite liquidities, from higher timeframe to lower timeframe... so...
4. Waited for PA that will Deliver Towards Target - I think my entry here was sloppy, the weakest part of this trade. But it made sense, and it still worked anyway.
I just found a sting candle down(the A wave) after tapping the (S/R Flip+FVG).. I set a sell stop limit on the exact low of that candle.
LOGIC was, if price pushed down below that sting, especially with a strong fvg, it would validate the RESPECT of the (SR FLIP+FVG), and it would continue going down(an invalidation of a long continuation idea)... probably to, again, seek liquidity below.
Reason why I think my entry was sloppy, is because I did not validate the trade idea first. I didn't wait for that sting candle to get "run on(liquidity)" first. I think in order to validate it, I would have waited for the sting to become a run on liquidity area first, and then a second bearish fvg candle close to confirm downtrend. It would have been too late and the profit would have been too small at that point.
5. Put SL at the Orderflow Leg Swing High - If price was really not intending to continue going up, it wouldn't have gone here, which it didn't. I nearly got stopped out, like the other trades I had on sunday and monday.
-------------
Here's the pattern that I keep seeing though, when price makes a valid HIGH(like in this case, the SRFLIP+FVG rebalance), price will attempt to go here atleast twice with a WICK, but will still make lower highs. Usually, those second and third wicks will form as if it's going to take the liquidities at those wicks, but it will just take out the CANDLE BODY HIGHS... So take note of these next time.
When price sweeps a higher timeframe FVG/LIQUIDITY, mark out the candle body closes as TARGET LIQUIDITIES, not the wicks. If a downtrend is valid, it will only take out the body close liquidities. I will make a diagram to help make this make sense lmfao.
-------------
I feel like a mad scientist at this point... endlessly trying to see the actual logic in the market. Not the probabilities of patterns playing out, but the CAUSES and EFFECTS.
I think I'm close to finding the pattern within the pattern... or the message hidden in the patterns(Arcane reference, anyone?).
But I think the two things I have found thanks to Arjo is...
"Price only does two things: 1. Seeking Liquidity 2. Rebalancing Fair Value
and Higher TF = Rebalancing Fair Value <-> Lower TF = Seeking Liquidity"
and
"The Higher the Timeframe, The Stronger the Timeframe"
Like... the market isn't random. I think these two things are the core principles of trading.
Because with these two ideas, you don't need a strategy. You need to UNDERSTAND this. And the strategy can be adapted to whatever you see on the chart.
You open EURUSD, and you see that price is on a downtrend, and it has recently rebalanced the bearish fair value gap on the 4HR? You know what price will do next. It will continue going down to seek liquidity below. So, with that information, what will you look for? How will you enter? Where will you set your entry point, your stoploss, and where is your target?
You open USDCAD, and you see that price is on an uptrend, it has already rebalanced fair value below, has made a bullish choch+FVG, and has respected that choch+FVG on a lower timeframe. You know it will seek buy side liquidity next. So how will you enter? Where will you place your stoploss? Where's your exit?
-------
Now, if only I can translate this knowledge into actual consistency in trading, I can finally make money.
But I guess doing the journal is great. I'm consistently at the 25-30% winrate. So with this understanding.. Maybe I can slowly push that winrate up over time.
I think mechanically, the trade entries i had a year ago and now was the same(choch+POC+FVG+OTE), but now I have the understanding of why it may work or why it won't work, and when do I apply it so I increase the odds of winning. So that's something.
Before, I didn't know why it did or did not work. But now, I know.
I can use this info moving forward to increase my odds.
-------
OH WAIT YEAH, IF I KNOW WHAT THE MARKET DOES AND WHY IT DOES WHAT IT DOES, THEN I WILL BE ABLE TO REFINE MY ENTRIES, BECAUSE NOW I KNOW WHY AND HOW I'M MAKING MY MISTAKES. HELL YEAH.
-------
I'm just not sure about whether I can stick to one entry strategy now, or if I should, or I won't trade something that looks doable under my principles... because I've studied everything, and it makes sense now. lmfao.
-------
if people are reading this(up to this point lol that was a long ash read), then thank you. Reply with your thoughts if ever.
Alright thanks bye
