Fair Value Gaps vs Liquidity Voids in TradingFair Value Gaps vs Liquidity Voids in Trading
Understanding fair value gaps and liquidity voids is essential for traders seeking to navigate the complexities of the financial markets. These concepts, deeply rooted in the Smart Money Concept (SMC), provide valuable insights into the dynamics of supply and demand, helping to identify potential price movements. In this article, we’ll delve into both ideas, exploring their characteristics, differences, and use in trading.
Fair Value Gap (FVG) Meaning in Trading
A fair value gap, also known as an imbalance or FVG, is a crucial idea in Smart Money Concept that sheds light on the dynamics of supply and demand for a particular asset. This phenomenon occurs when there is a significant disparity between the number of buy and sell orders for an asset. They occur across all asset types, from forex and commodities to stocks and crypto*.
Essentially, a fair value gap in trading highlights a moment where the market consensus leans heavily towards either buying or selling but finds insufficient counter orders to match this enthusiasm. On a chart, this typically looks like a large candle that hasn’t yet been traded back through.
Specifically, a fair value gap is a three-candle pattern; the middle candle, or second candle, features a strong move in a given direction and is the most important, while the first and third candles represent the boundaries of the pattern. Once the third candle closes, the fair value gap is formed. There should be a distance between the wicks of the first and third candles.
Fair value gaps, like gaps in stocks, are often “filled” or traded back through at some point in the future. They represent areas of minimal resistance; there is little trading activity in these areas (compared to a horizontal range). Therefore, they are likely to be traded through with relative ease as price gravitates towards an area of support or resistance.
Liquidity Void Meaning in Trading
Liquidity voids in trading represent significant, abrupt price movements between two levels on a chart without the usual gradual trading activity in between. These are essentially larger and more substantial versions of fair value gaps, often encompassing multiple candles and FVGs, indicating a more pronounced imbalance between buy and sell orders.
While FVGs occur frequently and reflect the day-to-day shifts in market sentiment, liquidity voids signal a rapid repricing of an asset, typically following significant market events (though not always).
These voids are visual representations of moments when the market experiences a temporary absence of balance between buyers and sellers. This imbalance leads to a sharp move as the market seeks a new equilibrium price level. Such occurrences are not limited to specific times; they can happen after major news releases, during off-market hours, or following large institutional trades that significantly move the market with a single order.
Liquidity voids are especially noteworthy on trading charts due to their appearance as particularly sharp moves. Though they appear across all timeframes, they’re most obvious following major news events when the market rapidly adjusts to new information, creating opportunities and challenges for traders navigating these shifts.
Fair Value Gap vs Liquidity Void
Fair value gaps and liquidity voids are effectively the same thing in practice; a fair value gap is simply a shorter-term liquidity void. Both indicate moments of significant imbalance between supply and demand. At the heart of both phenomena is a situation where one significantly outweighs the other, leading to strong market movements with minimal consolidation. The distinction between them often comes down to scale and timeframe.
An FVG is typically identified by a specific three-candle pattern on a chart, signalling a discrete imbalance in order volume that prompts a quick price adjustment. These gaps reflect moments where the market sentiment strongly leans towards buying or selling yet lacks the opposite orders to maintain price stability.
Liquidity voids, on the other hand, represent more pronounced movements in a given direction, often visible as substantial price jumps or drops. They can encompass multiple FVGs and extend over larger portions of the chart, showcasing a significant repricing of an asset.
This distinction becomes particularly relevant when considering the timeframe of analysis; what appears as a series of FVGs on a lower timeframe can be interpreted as a liquidity void. On a higher timeframe, this liquidity void may appear as a singular fair value gap. This can be seen in the fair value gap example above.
For traders, it’s more practical to realise that both FVGs and liquidity voids highlight a key market phenomenon: when a notable supply and demand imbalance occurs, it tends to create a vacuum that the market is likely to fill at some future point. Therefore, it’s important to recognise that both these types of imbalances can act as potential indicators of future price movement back towards these unfilled spaces.
Trading Fair Value Gaps and Liquidity Voids
Trading strategies that leverage fair value gaps and liquidity voids require a nuanced approach, as these concepts alone may not suffice for a robust trading strategy. However, when integrated with other aspects of the Smart Money Concept, such as order blocks and breaks of structure, they can contribute significantly to a comprehensive market analysis framework.
Primarily, both FVGs and liquidity voids signal potential areas through which the price is likely to move rapidly to reach more significant zones of trading activity, such as order blocks or key levels of support and resistance.
This insight suggests that initiating positions directly within an FVG or a liquidity void may not be effective due to the high likelihood of the price moving swiftly through these areas. Instead, traders might find it more strategic to wait for the price to reach areas where historical trading activity reflects stronger levels of buy or sell interest.
Additionally, these market phenomena can inform the setting of price targets. If there is an FVG or liquidity void situated before a key area of interest, targeting the zone beyond the gap—where substantial trading activity is expected—could prove more effective than aiming for a point within the gap itself.
It's also useful to note the relative significance of these features when they appear on the same timeframe. An FVG, being generally smaller and indicating a discrete order imbalance, is more likely to be filled before a liquidity void. This is because liquidity voids represent more considerable and pronounced market movements that can set market direction, marking them as less likely to be filled within a short space of time.
Limitations of Fair Value Gaps and Liquidity Voids
While fair value gap trading strategies and the analysis of liquidity voids offer insightful approaches to understanding market dynamics, they come with inherent limitations that traders need to consider:
- Market Volatility: High volatility can unpredictably affect the filling of fair value gaps and liquidity voids, sometimes leading to incorrect analysis or false signals.
- Timeframe Relativity: The significance and potential impact of gaps and voids can vary greatly across different timeframes, complicating analysis.
- Incomplete Picture: Relying solely on these phenomena for trading decisions may result in an incomplete market analysis, as they do not account for all influencing factors.
- Expectations: There is no guarantee that a FVG/void will be filled soon or at any point in the near future.
The Bottom Line
As we conclude, it's essential to remember that while fair value gap and liquidity void strategies provide valuable insights, they’re part of a broader spectrum of SMC tools available to traders. They’re best combined with other analytical techniques to form a comprehensive approach to trading.
For those looking to delve deeper into trading strategies and enhance their market understanding, opening an FXOpen account can be a step toward accessing a wide array of resources and tools designed to support your trading journey.
FAQs
What Is a Fair Value Gap?
A fair value gap occurs when there's a significant difference between the buy and sell orders for an asset, indicating an imbalance that can influence market prices.
What Are Fair Value Gaps in Trading?
In trading, fair value gaps reflect moments where market sentiment strongly favours either buying or selling, creating potential price movement opportunities.
What Is the Difference Between a Fair Value Gap and a Liquidity Void?
The main difference lies in their scale: a fair value gap is typically a smaller, discrete occurrence, while a liquidity void represents a larger, more pronounced price movement.
How to Find Fair Value Gaps?
Traders identify fair value gaps by analysing trading charts for areas where rapid price movements have occurred. A FVG consists of three candles, where the second one is the largest and the first and third serve as barriers. The idea of the FVG is that it leads to a potential retracement to fill the gap in the future.
Is a Fair Value Gap the Same as an Imbalance?
Yes, a fair value gap is the same as an imbalance in the Smart Money Concept.
*Important: At FXOpen UK, Cryptocurrency trading via CFDs is only available to our Professional clients. They are not available for trading by Retail clients. To find out more information about how this may affect you, please get in touch with our team.
This article represents the opinion of the Companies operating under the FXOpen brand only. It is not to be construed as an offer, solicitation, or recommendation with respect to products and services provided by the Companies operating under the FXOpen brand, nor is it to be considered financial advice.
Fvg

EURUSD - Bulls vs Bears – Price levels to watch out for!🌍 Market Overview:
Currently, EURUSD is showing strength as the US dollar is experiencing bearish pressure, influenced by the recent news regarding tariffs imposed on certain goods. The new tariffs, aimed at curbing certain imports, have created uncertainty around the dollar's stability. This macroeconomic development is creating a favorable environment for the euro, pushing the pair higher as investors seek alternatives to the weakening USD.
Additionally, the broader economic landscape supports euro strength, with improving Eurozone economic data and a more stable inflation outlook compared to the US. These factors have contributed to the recent bullish momentum seen on EURUSD.
📈 Technical Overview:
After a significant bullish move, the market appears to be overextended, signaling that a cooldown might be imminent. The rapid price increase left behind several imbalances that need to be filled for the market to maintain a healthy structure. When price moves in one direction without much pullback, it often creates inefficiencies or gaps in the order flow that the market tends to fill before continuing the primary trend.
Looking at the Fibonacci retracement levels, the 0.382 level aligns with a minor zone of interest, but the more significant confluence lies between the 0.618 - 0.65 Fibonacci retracement levels. This zone is often referred to as the golden pocket, where price typically reacts during corrections in trending markets. Furthermore, this retracement zone perfectly overlaps with the strong past resistance zone that is now expected to act as support.
🔍 Expected Move:
The expectation is that EURUSD will first tap into the higher supply zone marked in the chart before initiating a corrective move to the downside. The supply zone represents an area where institutional selling pressure could be present, causing a rejection to the downside. The corrective move is anticipated to fill the imbalances left behind during the bullish rally, making the price action healthier and more sustainable in the long run.
The anticipated pullback is likely to target the 1.05000 - 1.06000 area, aligning with the golden pocket and strong support level. This zone offers a high probability for a bullish reaction, making it an ideal point for potential buy entries.
🔑 Key Confluences for the Target Zone:
Golden Pocket Level: This Fibonacci retracement area is a high-probability zone for price reversals in trending markets.
Past Resistance Turned Support: The strong resistance zone that was broken during the bullish rally is expected to act as a support on the way down, offering further confluence for buy entries.
Imbalance Filling: The fast price movement left inefficiencies in the market that are likely to be filled during the retracement, contributing to a healthier market structure.
Psychological Levels: The 1.05000 level is a round number that often acts as psychological support in the market, further increasing the likelihood of a bullish reaction.
Market Sentiment: Bearish USD sentiment caused by recent tariffs and economic uncertainty provides a supportive backdrop for the euro, aligning with the technical setup.
📝 Trade Idea Summary:
Wait for a tap into the higher imbalance zone before considering short positions.
Target the 1.05400 - 1.05000 zone for partial profits.
Watch price action around the golden pocket and past resistance level for potential bullish reactions.
Confirm the trade idea with lower time frame structure shifts before entering.
Monitor economic news related to US tariffs and Eurozone economic releases to align with the technical analysis.
Better overview:
⚠️ Risk Management:
Use a stop loss above the imbalance zone for short entries to limit risk.
Consider scaling into long positions at the golden pocket zone with a tight stop below the 1.04800 level.
Aim for a 2:1 or 3:1 risk-to-reward ratio to maintain a favorable trade setup.
This trade idea combines technical analysis with market fundamentals to anticipate the next potential EURUSD move. By aligning multiple confluences, the setup offers a high-probability opportunity for both short-term and medium-term traders.
__________________________________________
Thanks for your support!
If you found this idea helpful or learned something new, drop a like 👍 and leave a comment, I’d love to hear your thoughts! 🚀
Make sure to follow me for more price action insights, free indicators, and trading strategies. Let’s grow and trade smarter together! 📈

NCKL ProjectionNCKL (IDX Composite)
Projection of the NCKL with 2 turning point
1. 740 (Market Structure Shift) from Bearish to Bullish
2. 855 (Market Structure Shift) from Bearish to Bullish

Possible NQ Bounce Starting Monday 3/10/25Monday and the rest of the coming week could be the start of the NQ making a bounce. If not, it's look out below with a break of 20,000 going to 19,000 rather quickly. Price will dictate how we go but a good bounce is not out of the question. Watch the video for more details.
Feel free to leave your comments.
Thanks for watching.

Bears in Control – Is This the Start of a Major Market Crash?The BTC chart shows a clear break in market structure where the bullish trend was invalidated after failing to maintain higher highs. The red zone represents a key support level that previously held price multiple times, showing strong buying interest. However, once this level was decisively broken to the downside, the market structure shifted bearish, confirming that sellers are in control.
When price returned to this zone, it retested the broken support and rejected sharply, flipping the area into a resistance zone. This rejection further validated the bearish sentiment and set the stage for a continuation to the downside.
Order Flow and Liquidity Grab
The current price action suggests that the market is targeting liquidity pools resting below the previous lows. The black line on the chart marks a key swing low, where liquidity is likely building up from stop-loss orders of retail traders. The market tends to gravitate towards these liquidity zones before reversing or continuing its trend.
The sharp rejection from the resistance level signals that the market is still heavily bearish and hunting for sell-side liquidity.
Fair Value Gap (FVG) and Retracement Zone
The green zone highlights a fair value gap (FVG) – an imbalance in price action where the market moved rapidly without leaving sufficient trading activity. These gaps often act as magnets, drawing price back to fill the imbalance before continuing in the original direction.
A retracement into this zone would not only fill the imbalance but also allow the market to mitigate unfilled orders left behind by institutions. This would create an ideal area for short re-entries before the next leg lower.
Fundamental Influence
Despite the recent bullish news event, which temporarily pushed the price higher, the impact lasted only a few hours. This indicates that the news failed to shift the overall market sentiment, and the bears quickly regained control. The market's reaction highlights the underlying weakness in bullish momentum.
Additionally, the recent tariff announcements by Donald Trump have created a more bearish macroeconomic environment, adding extra selling pressure. Increased tariffs could negatively impact global market sentiment, which aligns with the technical bearish outlook.
Trade Plan and Confirmation
The most likely scenario would be a retracement into the FVG zone (green area), followed by bearish price action confirmation (such as a bearish engulfing candle or lower timeframe structure break).
Key confirmation points:
Price taps into the green zone without breaking above it.
Bearish candle patterns or lower timeframe structure shifts.
Volume increase during rejection.
Target Areas
The primary target for this trade setup would be the liquidity pool resting below the black line. This level represents a clear liquidity grab zone, where the market could look to sweep lows before any potential reversal.
Invalidation Level
The trade idea would be invalidated if price breaks above the red resistance zone with strong momentum, signaling a possible shift back to bullish market structure.
Conclusion
This trade setup combines technical analysis with fundamental factors, creating a confluence-based bearish outlook. The rejection from the resistance zone, the presence of an FVG imbalance, and the overall bearish macro sentiment support the continuation of the downtrend. Waiting for price to fill the imbalance before entering could provide a high-probability entry for a short position targeting the liquidity grab at the lows.
__________________________________________
Thanks for your support!
If you found this idea helpful or learned something new, drop a like 👍 and leave a comment, I’d love to hear your thoughts! 🚀
Make sure to follow me for more price action insights, free indicators, and trading strategies. Let’s grow and trade smarter together! 📈

EURUSD Short Idea. Last week there were 3 strong bearish days on OANDA:EURUSD , leaving an imbalance behind and a Weekly bearish candle. Today, as I find it with a strong bullish movement from the open and London, I keep my eyes on shorts. This move might just end up being the weekly top wick, as nothing goes up or down in a straight line.
I found an imbalance with, what I perceive as, liquidity nearby. With a red folder news coming up at 10:00am NY time, it might reach it. Let's wait and see. This is my thought and move for today. For now.


XRP- Golden Pocket or Death Drop? Critical XRP Decision ImminentCurrent market structure shows XRPUSD consolidating at a critical support zone around 2.17, where a confluence of factors could drive the next significant move.
📌 Key Zone:
The 2.17 price range aligns with the Golden Pocket (61.8%-65% Fibonacci retracement) and a Fair Value Gap (FVG), creating a strong liquidity zone. This area has been tested several times, showing signs of demand and accumulation 🔍.
🟢 Bullish Scenario:
If the Golden Pocket holds and price shows bullish confirmation with a Market Structure Shift (MSS) or an inverted FVG, the probability for a reversal increases.
🎯 Target:
The first upside target would be the unfilled imbalance (FVG) between 2.36 and 2.39, offering a clean liquidity grab and potential continuation to higher levels.
Entry Confirmation:
✅ MSS on lower timeframes (5M/15M)
✅ Inversion of bearish FVG
✅ Bullish candlestick patterns
🔴 Bearish Scenario:
If the price breaks below the Golden Pocket without bullish confirmation, the next liquidity target lies at the 2.06 price range — a level where the market could sweep lows before a possible reversal.
Entry Confirmation:
❌ Clean break and close below 2.17
❌ Retest of the broken level as resistance
❌ Bearish order block formation
⚙️ Trade Plan:
Wait for bullish or bearish confirmation
Set alerts at 2.17 and 2.06
Always follow risk management 📊
This setup offers high R:R potential if executed with patience. Let price action dictate the move!
What do YOU think? 👇
Will XRP hold this strong support or are we heading lower?
__________________________________________
Thanks for your support!
If you found this idea helpful or learned something new, drop a like 👍 and leave a comment—I’d love to hear your thoughts! 🚀
Make sure to follow me for more price action insights, free indicators, and trading strategies. Let’s grow and trade smarter together! 📈

Bitcoin Breaks Key Support: Is $72K the Next Target?Bitcoin has officially broken below the $91,000 support level, a key structural low that previously acted as a strong base for price action. This breakdown is significant, as it signals a shift in market sentiment and opens the door for a potential retest of lower price levels.
The first major area of interest now lies in the green Fair Value Gap (FVG) at the $80,000 level. This region represents an imbalance that has yet to be fully filled, making it a likely point of support where buyers could step in. However, the strength of this level will be critical to monitor
if bulls fail to defend it, we could see an even deeper correction.
🚨 Why Is $72K an Important Level?
If Bitcoin fails to hold above the $80,000 FVG, the next major target would be the red Fair Value Gap around $72,000, which also aligns with the golden pocket retracement zone (between the 0.618-0.65 Fibonacci levels). This area is a strong draw on liquidity, meaning that large players in the market could be targeting this level to accumulate Bitcoin at a discount.
Historically, golden pocket regions often act as high-probability reversal zones, but if sentiment remains weak, we could even see a deeper correction towards lower Fibonacci retracement levels, such as the 0.786 zone at around $64,000.
🔥 Key Factors Driving Bitcoin’s Recent Drop
Several major events and macroeconomic factors are currently weighing on Bitcoin’s price action:
📉 Loss of Trump-Driven Crypto Euphoria
Bitcoin and the broader crypto market initially surged on speculation that Donald Trump’s return to the political spotlight would lead to favorable regulations for the industry. However, recent developments have dampened this optimism. Policy details remain unclear, and investors are beginning to question whether the market got ahead of itself.
🔓 Major Crypto Security Concerns
A recent record-breaking $1.5 billion hack on crypto exchange Bybit has raised security fears across the industry. This has led to increased outflows from centralized exchanges as investors rush to secure their assets, adding sell pressure to the market.
⚖️ Regulatory Uncertainty & SEC Scrutiny
The SEC has formed a new task force focused on digital assets, signaling more regulatory oversight in the near future. While some see this as a step toward legitimizing crypto, others fear it could bring stricter enforcement actions, particularly against DeFi platforms and stablecoins.
📊 Declining On-Chain Metrics & Miner Sell-offs
On-chain data suggests that miners have been selling Bitcoin at an increased rate, likely to cover operational costs as mining difficulty continues to rise. This has added additional downward pressure on price.
🔍 Key Levels to Watch Moving Forward
✅ $80,000 (Green FVG) → First major support zone
✅ $72,000 (Red FVG & Golden Pocket) → Strong liquidity draw if $80K fails
🚨 Below $72,000 → Potential retracement toward the 64K-65K region
📢 Final Thoughts: What’s Next for Bitcoin?
Bitcoin is at a critical inflection point whether we hold $80K or drop toward $72K will determine the next major trend. The current breakdown suggests more downside in the short term, but these lower levels could offer an excellent buying opportunity for long-term investors.
With upcoming regulatory decisions, macroeconomic uncertainty, and potential geopolitical factors, traders should remain cautious and watch key support levels closely.
👉 Are you buying the dip, or do you think Bitcoin has further to fall? Let me know your thoughts in the comments! 🚀📉

Trading AUDUSD | Judas Swing Strategy 26/02/2025Last week the Judas Swing strategy had another action-packed week! As we took four trades across our selected currency pairs ( FX:GBPUSD , FX:AUDUSD , FX:EURUSD , OANDA:NZDUSD ), securing two wins and two losses, but still closing the week with a solid 2% gain.
Given the strategy’s consistency over the past few weeks and months, we were eager to see how it would perform this week. On Monday, we waited for a setup on FX:EURUSD , but it fell just a few pipettes short of meeting all the criteria on our checklist. Since one key requirement wasn’t met, we stayed disciplined and skipped the trade. Now, here’s the important part—although that trade ended up being a winner, it didn’t bother us. Why? Because it didn’t align with our strategy, and we don’t risk our hard-earned money on trades that don’t check all the boxes. If you find yourself entering random trades, it’s time to create a checklist and stick to it. Discipline is what separates consistent traders from gamblers.
Fast forward to Wednesday, we spotted a promising setup on FX:AUDUSD and we were eager to see how the session would unfold. After a sweep of liquidity at the lows, our focus immediately shifted to potential buying opportunities. Once we got a break of structure to the upside, all that was left was a retrace into the FVG before executing the trade. But patience was key—we reminded ourselves of Monday’s setup, where a similar scenario played out, yet the retrace never came. That trade had to be left behind, and we weren’t about to force an entry this time either
Finally, price retraced into the FVG, and as soon as that candle closed, we were ready to execute the trade. We risk 1% per trade with the goal of securing a 2% return ensuring our wins outweigh our losses over time. With this strategy’s win rate hovering around 50%, sticking to our rules keeps us on the path to long-term profitability
After entering the trade, we experienced a slight drawdown for less than five minutes, dipping just 2 pips nothing out of the ordinary. Our entry candle had closed in our intended direction, so we stayed patient. Soon after, price moved decisively in our favor, hitting our target in just 1 hour and 10 minutes. Our patience paid off this time with a solid 2% return on a trade where we had only risked 1%.

EUR/USD UPDATE: Still Following the Plan! EUR/USD continues to respect our bullish structure, maintaining higher highs and higher lows within the ascending channel. The Fair Value Gap (FVG) remains a strong support, and price has been consolidating within this zone, showing signs of bullish intent.
🔹 Key Updates:
✅ Price is still holding above the FVG, confirming strong demand.
✅ Higher lows are forming, reinforcing the bullish trend.
✅ Still facing strong resistance—a break above could signal further upside.
🚨 What to Watch For:
📈 Bullish case: A breakout above the resistance could trigger a strong rally.
📉 Bearish case: Losing the FVG support may invalidate the bullish setup.
Make sure to check the main analysis in the related publications.
For now, the structure remains intact, and we are still respecting the channel. Are we about to see a breakout? Let me know your thoughts in the comments! ⬇️
__________________________________________
Thanks for your support!
If you found this idea helpful or learned something new, drop a like 👍 and leave a comment—I’d love to hear your thoughts! 🚀
Make sure to follow me for more price action insights, free indicators, and trading strategies. Let’s grow and trade smarter together! 📈✨

HIGH TIMEFRAME FVG STRIKES AGAINThey say look to the left right? Here we can clearly see the benefits of plotting previous level FVG's on higher timeframes, as well as basic daily liquidity. When plotting like this, it helps in contract selection. As options traders we're looking to make the most out of the market right? Whats sexier than a contract going from like .10 to $200!? By plotting liquidity and FVG's, we are aided in contract selection and it takes a lot of the hoping and wishing out of the trade. Are we sweeping liquidity or not? Are we on track to reach a higher timeframe FVG or not? Make sure you have your contract levels planned prior to market open so you can take advantage of these life changing moves!
My ideal entries. This doesn't always happen but its nice when it does!
- Break of 30m PMKT ORB (initial entry)
- Break of 15m ORB (add)
- Break of 30M ORB (add)
- Break of FVG (SELL!!!)
Just look to the left! Draw the lines, draw the boxes. and don't panic, you got this!
The blue shaded box at the bottom is a previous FVG plotted from the 6HR timeframe

EUR/USD - Ready for a Massive Breakout?The EUR/USD pair is currently respecting a well-defined ascending channel, displaying clear bullish market structure with higher highs and higher lows. After testing the bottom of the channel three times, price has only made higher lows, indicating a shift in momentum and a strong demand zone. This suggests that buyers are stepping in aggressively at lower levels, reinforcing the bullish outlook.
🔹 Key Levels & Observations 🔹
🔸 Fair Value Gap (FVG) as Strong Support.
One of the most significant technical factors in this setup is the fair value gap (FVG), which has consistently acted as a strong support level. Price has been creating higher highs after bouncing from this zone, making it a crucial area of interest. This FVG has been filled, and price is showing signs of respecting it, further solidifying the bullish sentiment.
🔸 Bottom of the Channel Successfully Defended.
The market has tested the bottom of the ascending channel three times, and after each test, price has only made higher lows. This kind of price action is a strong indication that buyers are in control, absorbing selling pressure and pushing price higher.
🔸 Strong Resistance at the top.
The black horizontal resistance line represents a key level where price has struggled to break above in the past. It has been tested multiple times, confirming its significance. A clean breakout above this level would serve as confirmation that bulls have full control, potentially leading to a strong continuation to the upside.
🔸 Bullish Structure Confirmed?
As price continues forming higher highs and higher lows, the overall market structure remains bullish. As long as price respects the fair value gap and the ascending channel, the expectation is for a continuation of the uptrend.
📌 Trading Plan & Potential Scenarios 📌
✅ Bullish Scenario:
If price holds above the fair value gap (green support zone) and continues to form higher lows, the bias remains bullish.
A break and close above the strong resistance level (black line) would be the ideal confirmation for further upside movement.
If a breakout occurs, we could see a strong rally as trapped sellers get liquidated and momentum builds.
❌ Bearish Scenario (Invalidation Level):
If price fails to hold the FVG support zone and starts forming lower highs, we may see a deeper correction towards the lower boundary of the channel.
A confirmed break below the channel could signal a trend reversal.
📉 What to Watch for Confirmation 📈
🔹 Break and close above the strong resistance (black line) for a bullish breakout confirmation.
🔹 Continuation of higher lows & higher highs within the ascending channel.
🔹 Strong buying pressure at the fair value gap to maintain the bullish bias.
Final Thoughts:
At this stage, the EUR/USD pair is looking bullish, with the market structure aligning with a continued upward move. The fair value gap is a key support level, and as long as price holds above it, the trend remains intact. A breakout above resistance could signal a strong move to the upside, potentially triggering more buying interest.
What are your thoughts on this setup? Do you think we’ll see a breakout above resistance soon? Let me know in the comments! 🚀📈
__________________________________________
Thanks for your support!
If you found this idea helpful or learned something new, drop a like 👍 and leave a comment—I’d love to hear your thoughts! 🚀
Make sure to follow me for more price action insights, free indicators, and trading strategies. Let’s grow and trade smarter together! 📈✨

XRP price at a crucial decision point – massive breakout coming?XRP is currently trading at a critical support level, sitting within a 4-hour Fair Value Gap (FVG) around the $2.50 mark. This zone has proven to be a strong demand area, with price reacting and bouncing from it multiple times. However, XRP is now approaching a major trendline resistance, meaning a huge move is coming whether bullish or bearish depends on what happens next!
🔥 The Key Levels You Need to Watch Right Now
🟢 Bullish Scenario – A Breakout Could Send XRP Soaring!
The black descending trendline has been a strong resistance for XRP, capping price movement to the upside.
If price breaks above this trendline and successfully retests it as support, this would confirm a bullish breakout, likely leading to a surge in price.
A successful breakout could see XRP rally towards $2.70, $2.80, and possibly even higher, as there is less resistance above these levels.
🔴 Bearish Scenario – FVG Breakdown Could Spell Trouble!
The 4-hour Fair Value Gap (FVG) around $2.50 is a major support level, and price has already shown significant reactions here.
However, if XRP fails to break above the trendline and instead falls below the FVG zone, this could lead to further downside pressure.
A clean break below $2.50 could send XRP tumbling toward lower support levels, potentially $2.40 or even lower.
🚀 What’s Next for XRP? A Big Move is Coming!
With price consolidating between these key levels, a breakout is inevitable. The bullish momentum will be confirmed if price breaks and retests the descending trendline as support. However, if XRP loses the FVG zone, then we could be looking at a shift in trend toward bearish continuation.
Final Thoughts – Get Ready for Volatility!
Right now, XRP is at a make-or-break moment. The next move will likely set the tone for the coming days. Keep an eye on how price interacts with these levels—whichever side breaks first will determine XRP’s next big move!
__________________________________________
Thanks for your support!
If you found this idea helpful or learned something new, drop a like 👍 and leave a comment—I’d love to hear your thoughts! 🚀
Make sure to follow me for more price action insights, free indicators, and trading strategies. Let’s grow and trade smarter together! 📈✨

XAU/USD SellClarification : If the price forms an accumulation below an OB/FVG, it could be a potential selling area. Ensure that the price makes lower lows for confirmation before entering the trade. Also, manage your money wisely.

Bitcoin's Next Big Move? Critical $103K Resistance Ahead!Bitcoin has broken out of its recent consolidation range after a classic liquidity sweep at the lows. As marked on the chart (red line), we saw a significant stop-loss hunt below the previous support level, triggering a cascade of liquidations before BTC swiftly rebounded. This move confirmed bullish intent, allowing Bitcoin to reclaim momentum and push back toward the critical psychological level of $100K.
Now, all eyes are on the $103K resistance zone, which is a major confluence area for multiple reasons:
📌 Fair Value Gap (FVG) – This imbalance in price action suggests that liquidity is resting in this region, making it a key level for market reactions.
📌 Fibonacci Golden Pocket (0.618 - 0.65 retracement) – One of the strongest retracement levels in trading, often acting as a magnet for price action before a decisive move.
📌 Historical Resistance – This area has already been tested twice (marked as "First Hit" and "Second Hit" on the chart) and resulted in strong rejections both times.
What’s Next for Bitcoin?
🔹 Bullish Scenario: If BTC can break through $103K with strong volume, we could see a continuation towards $105K - $107K, with a potential extension toward $110K in the mid-term.
🔹 Bearish Scenario: A rejection from this resistance could lead to another pullback, possibly back to the $96K support level or even lower before another attempt to push higher.
Why This Level Matters:
The liquidity structure here is key. Many traders will have short positions stacked at this resistance, and a breakout could trigger a short squeeze, fueling a rapid move higher. However, if sellers overpower buyers in this zone, BTC could struggle to sustain its gains and might need another accumulation phase before making a decisive breakout.
Final Thoughts
This is a critical moment for Bitcoin. Will the bulls break through $103K and continue the rally, or will this level act as a major roadblock once again? Watch this level closely, and let me know your thoughts in the comments!

EUR/USD - High-Probability Short Setup! Are we going lower?EUR/USD - This trade is based on a bearish retracement rejection from a key Fair Value Gap (FVG), targeting a strong confluence area where Fibonacci levels and volume profile data align.
🔹 Entry Criteria:
Price has tapped into a Fair Value Gap (FVG) twice, showing signs of rejection.
The green zone represents an imbalance where sellers previously stepped in, making it an ideal short entry area.
Look for bearish confirmation, such as wicks, bearish engulfing candles, or lower timeframe breakdowns before executing the trade.
🔹 Target (Take Profit - TP):
The primary target is the 0.618 - 0.65 Fibonacci retracement zone (Golden Pocket), a strong level where price often reverses.
This level aligns with the Point of Control (POC) from the volume profile tool, adding further confluence.
🔹 Stop-Loss & Invalidation:
Stop-loss should be placed above the last high near the FVG zone to protect against invalidation.
If price closes above the FVG zone, the trade setup becomes invalid, as it would indicate bullish strength and a possible continuation higher.
🔹 Additional Considerations:
Price is likely seeking sell-side liquidity below previous lows, supporting the downside move.
Market conditions and potential fundamental catalysts (news events) should be monitored before entry.
📌 Summary:
This trade idea involves shorting from a key imbalance zone (FVG), expecting price to fill the gap and move toward a high-probability support area at the Golden Pocket + POC confluence zone. However, if price closes above the FVG, the trade setup is invalidated, signaling a potential bullish continuation. 🚀
__________________________________________
Thanks for your support!
If you found this idea helpful or learned something new, drop a like 🙌 and leave a comment—I’d love to hear your thoughts! 🚀
Make sure to follow me for more price action insights, free indicators, and trading strategies. Let’s grow and trade smarter together!📈

Fair Value Gaps (FVGs) – A Complete GuideWhat Are Fair Value Gaps (FVGs)?
A Fair Value Gap (FVG) is a price imbalance on a chart that occurs when the market moves aggressively in one direction, leaving an area where price did not trade efficiently. These gaps are often created by institutional traders (banks, hedge funds, and large market participants) executing big orders.
Key Characteristics of a FVG:
✅ Occurs when price moves impulsively, creating an imbalance
✅ Appears in a three-candle formation
✅ The gap forms between the wicks of the first and third candles
How to Identify a FVG:
1️⃣ Look for a strong price move (bullish or bearish).
2️⃣ Find a three-candle sequence where the middle candle has a large body and a gap between the first and third candle wicks.
3️⃣ Mark the area between the first and third candle wicks—this is your Fair Value Gap.
Example:
Imagine price explodes upward with a big green candle, skipping multiple price levels without much resistance. This creates an inefficiency because price hasn’t traded fairly in that area, making it likely that price will revisit it later to fill the imbalance.
Here you can see that price completely filled up that gap and moved higher.
Same here:
How to Use Fair Value Gaps in Trading
FVGs can serve as key zones where price is likely to react. Here’s how you can use them to improve your trading:
1️⃣ Fair Value Gaps as Support & Resistance
Bullish FVG (Support Zone):
If price retraces into a bullish FVG (gap formed in an uptrend), it can act as support and push price higher.
This is a good area to look for buying opportunities.
Bearish FVG (Resistance Zone):
If price retraces into a bearish FVG (gap formed in a downtrend), it can act as resistance and push price lower.
This is a good area to look for selling opportunities.
2️⃣ Using FVGs for Trade Entries & Exits
Price often revisits a Fair Value Gap before continuing its original trend.
A trader can wait for price to fill the gap and then look for confirmations like candlestick patterns or volume spikes before entering a trade.
Stop-loss placement: Put your stop-loss below/above the FVG zone to reduce risk.
3️⃣ Liquidity & Institutional Activity
Institutional traders often target these inefficiencies to fill their orders.
When price returns to an FVG, it may be because institutions are executing trades at those levels.
Why Are Fair Value Gaps Useful?
They act as magnets for price – Price tends to revisit these gaps before continuing its move.
They provide high-probability trade setups – FVGs help traders find potential reversal or continuation zones.
They improve risk management – You can use them for better stop-loss placement.
They align with Smart Money Concepts (SMC) – Institutions often use these levels for liquidity.
Tips & Tricks: How to Combine Fair Value Gaps with Other Strategies
1️⃣ FVG + Order Blocks = Strong Confirmation
If a Fair Value Gap aligns with an Order Block, it becomes a powerful area of interest.
This increases the chances of a successful trade.
2️⃣ FVG + Fibonacci Retracements
If an FVG aligns with a key Fibonacci level (like 61.8% or 50%), the chances of a price reaction increase significantly.
3️⃣ FVG + RSI or Divergence
If price revisits a FVG while RSI is overbought or oversold, it signals a high-probability reversal.
4️⃣ Higher Timeframe FVGs Are More Reliable
FVGs on the 1-hour, 4-hour, or daily charts are more effective than those on smaller timeframes.
5️⃣ Monitor News Events
If an FVG is formed due to a major news event (e.g., Fed announcement, CPI data, earnings report), be cautious, as price may act differently than expected.
Final Thoughts
Fair Value Gaps are a powerful tool that help traders identify key levels of liquidity and institutional price action. They work best when combined with other strategies like Order Blocks, Fibonacci, and RSI to increase accuracy.
By understanding how and why price moves back into these gaps, traders can anticipate potential high-probability trade setups and trade alongside smart money.
__________________________________________
Thanks for your support!
If you found this idea helpful or learned something new, drop a like 👍 and leave a comment—I’d love to hear your thoughts! 🚀
Make sure to follow me for more price action insights, free indicators, and trading strategies. Let’s grow and trade smarter together! 📈✨

EURUSD retracement?
I'm watching OANDA:EURUSD today. My bias is bullish and would like to see it swipe some liquidity and reach some buy zones. There's also an imbalance in the Daily timeframe. However being a US holiday today, I don't expect a lot of movement. So I'm also considering the retracement down to those levels, considering its distance from them. Observing and waiting for liquidity to be taken first before taking any trades. Maybe preserving capital is the right trade today?

ETH : The Suffering Ends Now !I’m back in an ETH position and honestly hoping this sideways grind ends soon. Yesterday’s Ethereum ETF announcement opened up a perfect opportunity to play the retest and the Fair Value Gap – and that’s exactly what I did.
Looking at on-chain data, we’re seeing continuous buying from whales. They clearly know something. And let’s not forget Trump and his team, along with his close circle, are stacking Ethereum like crazy. I’m sticking to my belief that Trump will do whatever it takes to pump his bags higher.
But if we lose this level, see you at $2,400.

EURUSD Ahead of Inflation DataYesterday, EURUSD continued its upward movement, reaching 1,0381.
Later today, U.S. inflation data will be released.
This news has a significant impact and will determine the next move for the USD.
If the pair continues to rise, the target will be to break previous highs and reach 1,0568.
Be cautious of misleading price movements and avoid emotional trading!

BTC to all time high nowBTC 2nd impulse wave started after big abc correction. Aiming to reach all time high now.

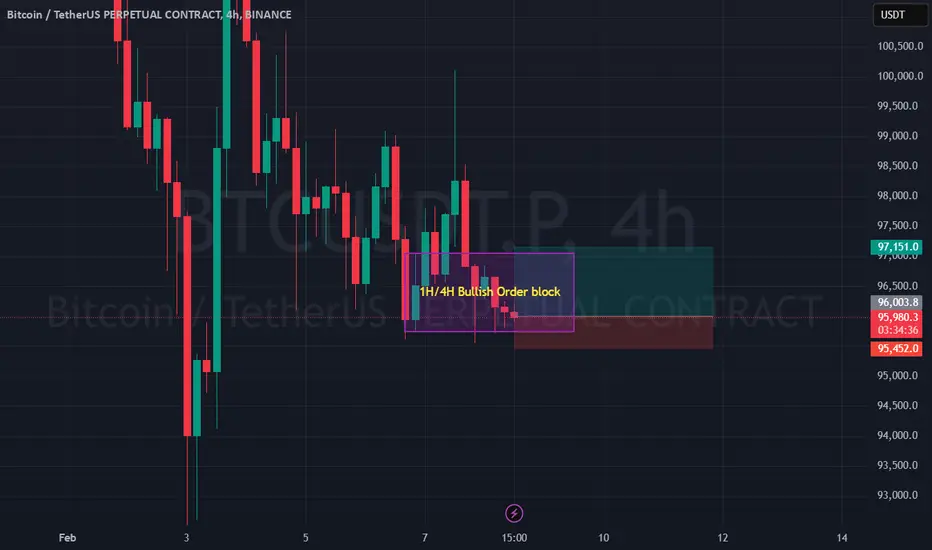
A small BTC longI entered a long position on BTC at 96,003.8, buying at the bottom of a 1H/4H order block. The confluence between these timeframes suggests strong bullish potential, as price often reacts positively when multiple timeframe order blocks align. My Take Profit (TP) is set at 97,151.0, while my Stop Loss (SL) is at 95,452.0.
Despite the bullish setup, I’m cautious because there’s a 4H Fair Value Gap (FVG) sitting right above my order block. This FVG could act as short-term resistance, limiting upward momentum. Given this, I’ve opted for a conservative TP to secure profits without overexposing myself to potential reversals.