POLKADOT, TIME TO LEAVE THE HELLAltcoin Time: Polkadot Bullish Swing Trading
Polkadot is showing several bullish signals:
PML being disrespected
PWL being disrespected
PWH being disrespected
PDL being disrespected
PDH being disrespected
Daily Bullish FVG being respected
4H Bullish FVG being respected
4H Swing Low being disrespected
Bearish Argument:
4H Swing High is being respected
Altseason seems to be brewing, but as day or swing traders, we must remain cautious about short-term movements. Ignore the noise on social media and rely on your analysis and experience.
Risk management is everything. If you risk more than you can afford to lose, you’ll end up emotionally drained. Protect your mindset by applying proper risk management techniques.
Risk-to-Reward (RR): 5.2
Fvg

Trading USDCAD and AUDUSD | Silver Bullet Strategy 18/11/2024The Silver Bullet strategy, introduced by the Inner Circle Trader (ICT), aims to exploit certain market conditions within specific time frames. It involves strategically placing entries at the initial fair value gap that emerges within these periods. Yesterday, we executed trades using this strategy and we plan to show you how to incorporate this strategy into your trading toolkit.
Firstly, it's crucial to understand what a Fair Value Gap (FVG) is and recognize the optimal time to look for these trades, which is between 10:00 and 11:00 EST. In order to get into the groove of trading we got to our trading desk at 09:55 and with the help of the sessions indicator we have the our trading zones mapped out for us. It should be noted that the initial candle marking the start of a trading session cannot constitute the Fair Value Gap (FVG), but it can serve as the first candle in the formation of an FVG.
The trading session began, and we were scouting for setups to trade using the silver bullet strategy. After 15 minutes, we noticed a Fair Value Gap (FVG) had formed on the USDCAD pair, which drew our attention to it.
This development indicates that we should be on the lookout for potential selling opportunities this trading session. We must wait for price to retrace back to the FVG and only execute a trade after the candle that enters the FVG has closed. This approach helps us avoid trades that enter the FVG and immediately hit our stop-loss. After 10-minutes we got a retracement into the Fair Value Gap (FVG), and given that price did not surpass the high of the first candle in the FVG formation, we can enter this trade. A 10 pip stop loss will be set to provide sufficient room for the trade to develop.
After initiating the trade, our USDCAD position experienced minimal drawdown, and by 10:35, it was progressing favorably in our desired direction. Simultaneously, we were evaluating potential setups on other currency pairs and observed the formation of a Fair Value Gap (FVG) on AUDUSD.
The next candle retraced into the Fair Value Gap (FVG) created on the AUDUSD pair, indicating that upon its close, we could execute a trade on this pair.
The USDCAD position swiftly hit the take profit (TP) target. Within just 25 minutes, we completed this trade and shifted our focus to the other open position, AUDUSD. The AUDUSD position was also moving favorably in the direction we anticipated.
After a period of waiting, we checked the position and found that it had reached the Take Profit (TP) after two hours. We succeeded in both trades we entered yesterday, risking 1% on each and aiming for a total gain of 4%. As observed, both trades experienced minimal drawdown, but this does not guarantee similar entries in the future. It is advisable to backtest this strategy and collect sufficient data to reinforce your confidence should you choose to trade using this strategy.

NZD/USD - 19/11/2024 Something to keep an eye on for the morning.
Daily narrative and context defined, potential ST on hourly timeframe to continue lower

SPX 500 day trading LONGAnalysis: Market Structure & Probabilities
OANDA:SPX500USD
PML (Previous Monthly Low) has been broken, moving higher than last month's low.
PMH (Previous Monthly High) has also been broken, pushing beyond last month’s high.
PWH/PWL (Previous Weekly High/Low) similarly breached, with price moving higher than the previous month's range.
PDL (Previous Daily Low) and 4H Swing High/Low have also been surpassed.
These indicators suggest a strong bullish bias, with an 87.5% probability of further upside movement vs. a 12.5% bearish scenario (reflected in PDH, as the price dipped below yesterday’s high).
Risk-to-Reward Ratio (RR): 2.14
Simple as that.

DXY Potential Rally to 108: High-Probability Setup with FVG The DXY is currently positioned around 105, showing momentum to potentially push up to the 108 region. This area features a high-probability Fair Value Gap (FVG) on the daily and weekly timeframes, providing a strong confluence zone. Price previously failed to sustain on the monthly OB, indicating a move towards the buyside liquidity above this PD array.
Should we see price react at the 108 FVG, it could present a reversal opportunity, especially given the alignment with overlapping daily and higher timeframe FVGs. However, if bullish momentum continues, this setup may also lead to further liquidity grabs.
Always remember: DYOR (Do Your Own Research).

Bitcoin Wait for a good longThe bullish case is strong, but proper risk management is essential if you're looking to go long. The current market is heavily overleveraged with long positions, causing sharp wicks and rejections, typical of a bull run.
I plan to wait and open a position at $60,750, keeping in mind that the price could drop further to $57,700, where I also plan to enter. However, don’t sleep on that level—it might be the last opportunity to open a long at a good price!
BINANCE:BTCUSD

AUDUSD Long- day tradingForgot to post this trade earlier!
FX:AUDUSD
Let's see if it reaches the buy-side liquidity: we've got a W pattern, swing low, FVG, discount array, and buy-side liquidity in play.
Honestly, it looks poised to go higher if today’s level holds; otherwise, more downside ahead. EUR/USD has recovered well, but tomorrow will bring a new challenge.

FILECOIN LONG-SWING TRADINGI’m starting to go long on altcoins, beginning with Filecoin. I see a realistic target before the weekend, ahead of a potential breakout.
BINANCE:FILUSDT
This is a swing trade setup, with the plan to close it by the weekend or on Sunday at the latest.
Entry Strategy:
OTE (0.705) + FVA + FVG + Overlapping Defense
Trade Management:
Consider taking the first profit at the 1.62 Fibonacci level. However, with altseason on the horizon, I'm aiming higher—targeting the 2.62 level to close the trade if all goes as expected.
Altseason is approaching. Stay calm; there’s still time to position yourself for solid entries at good prices before December.

Trading NZDUSD | Judas Swing Strategy 05/11/2024Last week concluded with a 3% gain using the Judas Swing strategy, which yielded three trades in total: two on EURUSD and one on NZDUSD. The EURUSD trades resulted in one win and one loss, while the NZDUSD trade closed with a win. These results have set the stage for a thrilling week ahead in the markets, and we can't wait to see what unfolds! As usual, we arrived at the trading desk at 8:25 EST to delineate our trading zones.
Once these zones have been marked we need to wait for the high or low of this zone to be swept, this step is essential to help us get a bias for the trading session. After 40 minutes, the liquidity at the high of the zone was swept, indicating that we should look for potential selling opportunities in this session.
While we may lean toward a sell this session, we hold back from entering until we see a clear structure break on the sell side. During this shift, price should create a Fair Value Gap, giving us an optimal entry point to step into the trade. After an hour's wait, we finally got a Break of Structure on the sell side, which also resulted in a Fair Value Gap being created.
To fulfill all the entry criteria on our checklist, we must wait for price to retrace into the Fair Value Gap that has formed, and we can only execute the trade once the candlestick has closed. After 10 minutes a candle entered the Fair Value Gap, indicating that upon its closure, we may proceed with executing the trade.
By risking just 1% of our account for a potential 2% gain, we reduce emotional attachment, knowing the loss is manageable, while positioning ourselves for greater rewards. Shortly after entering, the trade went into a drawdown; however, since we had risked an amount we were comfortable with losing, the current state of the trade did not move us.
Upon reviewing the position after some time, we noticed that the trade had started moving in our favor, although it hadn't moved much from the entry price. Given the average trade duration of around 11 hours for the strategy, there’s no rush, we simply need to wait for the setup to deliver as expected.
While the trade didn't reach our desired outcome and we took a 1% loss after the stop loss was hit, we remained unaffected because we were fully prepared for this potential outcome.

BIPI Buy Position1. Trend Confirmation:
Identified a Change of Character by the break of the previous high at 81, indicating a reversal in market sentiment and a new bullish trend.
2. Fair Value Gap (FVG):
On the Weekly chart, identified Fair Value Gap between 69 - 71.
3. Trade Execution
Entry Price: 74 ( Engulfing Candle on 5 Nov 24)
SL: 66 (FVG)
TP1: 110 (1.618 Fibbo)
Risk-Reward Ratio (RRR): 1:4.5
Monitoring: Check-in daily closing price
4. Outcome:
Exit Price:
Profit/Loss: pips
-------------
Disclaimer
The analysis and content provided here are intended solely for personal journal and educational purposes. This information does not constitute financial advice, investment advice, or a recommendation to buy or sell any securities. Trading involves significant risk, and you should only trade with money you can afford to lose. Past performance is not indicative of future results. Always conduct your own research and consult with a qualified financial advisor before making any investment decisions.

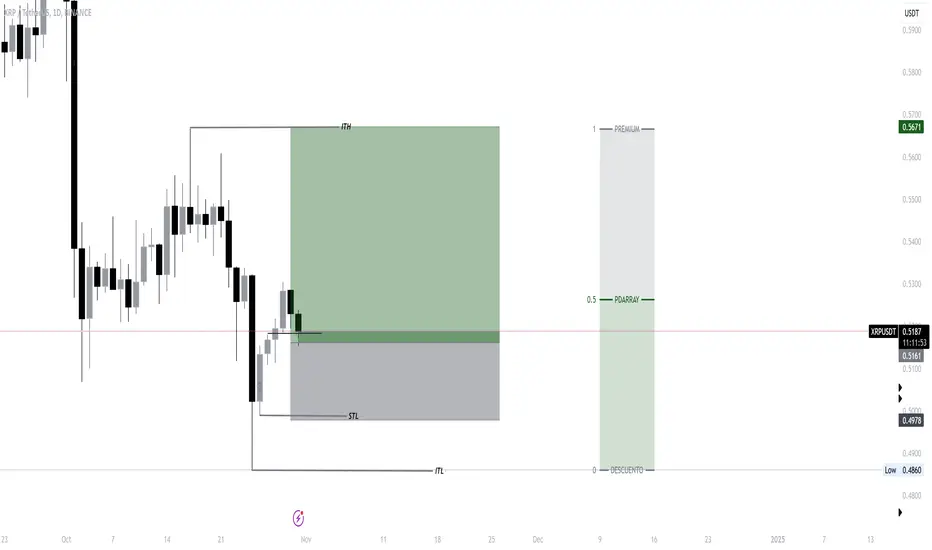
XRP Scalping-Day trading HIGH RISKHigh Risk
BINANCE:XRPUSDT
XRP appears likely to respect the daily bullish FVG (Fair Value Gap), and it's rare to see such setups on this asset. Given this unique opportunity, I’ve decided to enter, aiming to close the trade around the Intermediate Term High (ITH).
This is a straightforward setup: stop-loss placed at the swing low, as a break there could indicate a move to seek liquidity at lower levels. Target profit is set in the premium zone.
XAGUSD LONG-ScalpingThis is a high-risk trade setup. While I believe silver has more room for a rally, I expect it may need a significant drop first—that's what my instincts say. However, based on the charts, I’ve decided to go long as the price action has been resilient and seems poised to recover from yesterday's bearish whipsaw candle. Reminder: this is a high-risk trade with 0.50% capital at risk.

BTC Swing LongPotential for a Strong Bullish Move 📈
BINANCE:BTCUSDT
Based on current price action, I believe we may be heading into a significant bullish leg. Here’s why:
Bullish Arguments:
Previous Month Low (PML) is being disregarded.
Previous Month High (PMH) is being disregarded.
Previous Week Low (PWL) is being disregarded.
Previous Day Low (PDL) is being disregarded.
4H swing high is being ignored.
4H swing low is being disregarded.
The only bearish point to note:
Previous Week High (PWH) is still respected.
Trade Management: Once we hit the first Equal High (EQH) around 68K, I’ll move my Stop Loss to Break Even (BE) and manage the trade towards the final target.

BTC Long- Day trading The first line of defense didn’t hold, and price has moved toward the Overlapping defense alongside the Fair Value Area.
I believe this level may hold, though once it reaches the target or gets close, we might see a temporary pullback or consolidation. For this reason, this trade requires close monitoring of price action, especially on a day full of important news. Be safe

Trading NZDUSD | Judas Swing Strategy 28/10/2024 Last week highlighted the importance of a risk management plan for all traders using the Judas swing strategy as a case study. The strategy produced two trades on FX:GBPUSD and one on $EURUSD. Despite facing two losses and securing only one win, proper risk management ensured that the single win offset the losses, allowing us to end the week at breakeven. With these results in hand, we were excited to see what the upcoming week would bring. We got to our trading desk at 8:25EST and started our day by demarcating our trading zones.
Once we have demarcated our zones, we wait for the high or low of this zone to be swept, as this will assist us in determining our bias for the trading session. After 35 minutes, the high of the zone was swept, indicating that we should look for potential selling opportunities during this trading session.
Next on our checklist is to wait for a Break of Structure (BOS) on the sell side. After an hour, we observed a BOS on the sell side, which resulted in a Fair Value Gap (FVG) being formed in the process
We must wait for the price to retrace back into the Fair Value Gap (FVG). A trade can only be initiated once price has entered the FVG, and it is crucial to be patient and wait for the price to close before executing any trades. This waiting period acts as a filter to avoid scenarios where the candle entering the FVG proceeds to hit our stop-loss. The next five-minute candle entered the Fair Value Gap and closed, indicating that we can proceed with executing the trade
The position experienced a drawdown shortly after the trade was executed, but this did not concern us as we had only risked 1% of our trading account, targeting a 2% gain. Additionally, we implemented a minimum 10 pip stop loss to allow the trade sufficient space to fluctuate without prematurely stopping us out and then proceeding in our anticipated direction.
Upon checking the position later, we found it had shifted in our favor. However, we needed to remain composed since it had not yet reached our ultimate target. Our task was simply to be patient and wait for our targets to be achieved
Upon reevaluating the position, we noticed that price had returned to the entry point. At such moments, individuals who have risked more than they can afford may start to panic. That's why we continually stress the importance of only risking what you can afford to lose, as it greatly diminishes the emotional investment in trades. We have encountered situations like this before and will likely face them again. However, what remains within our control is the decision to risk only an amount we are comfortable with losing, which in turn lessens the emotional attachment to the trades.
According to our data, we can anticipate being in a position for an average of 11 hours, so the duration of this trade meeting our objective is not a concern we simply need to remain patient for it to occur. After 13 hours and 25 minutes, our patience was rewarded when our Take Profit (TP) was reached, resulting in a 2% gain on the OANDA:NZDUSD trade

UPDATE: EURUSD GAVE THE EXPECTED BULLISH REACTION, WILL IT LAST?Fiber delivered within the FVG as expected BUT we need to see how this week close to know if the up move will be sustained from here or not.

EURUSD Buy TradeTime Frame:
- H4: FVG Identification
- H1 Entry Signal
1. Trend Confirmation:
Identified a Break of Structure by the break of the previous resistance at 1.0807 area, indicating a reversal in market sentiment.
2. Fair Value Gap (FVG):
On the H4 chart noted a Fair Value Gap (FVG) between 1.0806 - 1.0810.
3. Position:
Entry : 1.0825
Stop Loss : 1.0811
Take Profit: 1.0849
RRR : 1:1,9x
-------------
Disclaimer
The analysis and content provided here are intended solely for personal journal and educational purposes. This information does not constitute financial advice, investment advice, or a recommendation to buy or sell any securities. Trading involves significant risk, and you should only trade with money you can afford to lose. Past performance is not indicative of future results. Always conduct your own research and consult with a qualified financial advisor before making any investment decisions.

EURUSD Potential Buy?Time Frame:
- H4: FVG Identification
- H1 Entry Signal
1. Trend Confirmation:
Identified a Break of Structure by the break of the previous resistance at 1.0807 area, indicating a reversal in market sentiment.
2. Fair Value Gap (FVG):
On the H4 chart noted a Fair Value Gap (FVG) between 1.0806 - 1.0810.
3. Waiting for entry signal after price touches FVG.
-------------
Disclaimer
The analysis and content provided here are intended solely for personal journal and educational purposes. This information does not constitute financial advice, investment advice, or a recommendation to buy or sell any securities. Trading involves significant risk, and you should only trade with money you can afford to lose. Past performance is not indicative of future results. Always conduct your own research and consult with a qualified financial advisor before making any investment decisions.

TOBA Potential Buy1. Trend Confirmation:
Identified a Change of Character by the break of the previous high at 312 & 500, indicating a reversal in market sentiment and a new bullish trend.
2. Fair Value Gap (FVG):
On the Weekly chart & Daily Chart, identified Fair Value Gap between 470 - 496.
3. Trade Execution
Entry Price: TBA if price entered FVG
SL: 460-474 (below Daily & Weekly FVG)
TP1: 1050-1070 (Fibo 161.8%)
Risk-Reward Ratio (RRR): 1:8
Monitoring: Check-in daily closing price
4. Outcome:
Exit Price:
Profit/Loss: pips
-------------
Disclaimer
The analysis and content provided here are intended solely for personal journal and educational purposes. This information does not constitute financial advice, investment advice, or a recommendation to buy or sell any securities. Trading involves significant risk, and you should only trade with money you can afford to lose. Past performance is not indicative of future results. Always conduct your own research and consult with a qualified financial advisor before making any investment decisions.

Trading GBPUSD | Judas Swing Strategy 22/10/2024Last week was active for the Judas Swing strategy, with two positions on FX:GBPUSD resulting in wins (+4%), three positions on FX:EURUSD yielding one win and two losses (breaking even), three positions on FX:AUDUSD with one win and two losses (breaking even), and one position on OANDA:NZDUSD securing a win (+2%). Overall, this led to a 6% increase by the week's end. Encouraged by these results, we began the week with enthusiasm to discover what lay ahead. In keeping with our routine, we reached our trading desks at 08:25 EST and set up our trading zones.
Once we have demarcated our zones, we should wait for the high or low of this zone to be swept, as this will assist us in determining our bias for the trading session. Twenty minutes later, the trading zone's low was swept, indicating that we should concentrate on looking for buying opportunities during this trading session.
Although we may have a bias for the trading session, we do not enter buy trades indiscriminately. Instead, we wait for a break of structure towards the buy side. During this break of structure, the price movement should leave behind a Fair Value Gap (FVG), which will assist us in getting an entry point for the trade. Shortly after, we observed a Break of Structure (BOS) on the buy side, which resulted in a Fair Value Gap (FVG) being left behind.
To fulfill all the entry criteria on our checklist, we must wait for price to retrace into the Fair Value Gap (FVG) that has formed, and we can only execute the trade once the candlestick has closed. The next five-minute candle has entered the Fair Value Gap (FVG), indicating that upon its closure, we may proceed with executing the trade.
It's crucial to understand that by risking only 1% of our trading account for a potential 2% return, we minimize emotional attachment to the trades since we're only risking what we can afford to lose, and we stand to gain more than we risk. After executing the trade, our position immediately showed a profit. However, it's crucial to stay composed and manage our expectations, as we do not control the markets and the situation could swiftly change.
After a few hours, we revisited the position and noticed it was still fluctuating around the same price point where we had previously left it. According to our data, we can anticipate being in a position for an average of 11 hours, so the duration of this trade meeting our objective is not a concern; we simply need to remain patient for it to occur.
Upon reviewing the position once more, we noticed it continued to consolidate in the same area. However, according to our rules, we must wait for the position to either reach the Take Profit (TP) or Stop Loss (SL) point.
Unfortunately, our patience did not yield the desired results this time, as the stop loss was triggered and we incurred a 1% loss of our trading account on this trade. However, this loss did not impact us significantly since we had already accepted the amount we were risking on the trade.

AUDUSD 15M CHoCH, OB, IMBShort 15M AUDUSD short position buy because daily is still bearish, there is a chance that price will fill the FVG too. Do at on your own risk

ASII Buy Trade Setup1. Trend Confirmation:
Identified a Change of Character by the break of the previous high at 4830, also the break of previous downtrend, indicating a reversal in market sentiment and a new bullish trend.
2. Fair Value Gap (FVG):
On the Weekly chart, identified Fair Value Gap between 4790 - 4940.
3. Trade Execution
Entry Price: 5100 ( Long Bullish Bar on 21 Oct 24)
SL: 4770 (FVG)
TP1: 5900
Risk-Reward Ratio (RRR): 1:2.4
Monitoring: Check-in daily closing price
4. Outcome:
Exit Price:
Profit/Loss: pips
-------------
Disclaimer
The analysis and content provided here are intended solely for personal journal and educational purposes. This information does not constitute financial advice, investment advice, or a recommendation to buy or sell any securities. Trading involves significant risk, and you should only trade with money you can afford to lose. Past performance is not indicative of future results. Always conduct your own research and consult with a qualified financial advisor before making any investment decisions.

XAGUSD Potential BuyTime Frame:
- Daily: (FVG Identification)
- H4 Entry Signal
1. Trend Confirmation:
Identified a Break of Structure by the break of the previous resistance at 32.50 - 32.75 area, indicating a continuation in market sentiment.
2. Fair Value Gap (FVG):
On the daily chart noted a Fair Value Gap (FVG) between 32.00 - 33.45.
-------------
Disclaimer
The analysis and content provided here are intended solely for personal journal and educational purposes. This information does not constitute financial advice, investment advice, or a recommendation to buy or sell any securities. Trading involves significant risk, and you should only trade with money you can afford to lose. Past performance is not indicative of future results. Always conduct your own research and consult with a qualified financial advisor before making any investment decisions.
