US DOLLAR INDEX ( DXY, USD ) Weekly Outlook.... BULLISH!DXY is respecting bullish FVGs, at least in the near term. I'll be looking for:
Sell setups in EURUSD, GBPUSD, NZDUSD, AUDUSD.
Buy setups in USDCAD, USDCHF.
Fvg

EURJPYIf price action shows a buy confluence then we have a bias. Pay attention that we are on an Overbought condition. Wait for structure to form and indications to follow.

XAUUSD|Pullback from the 4-hour supply areaWe see the gold chart in the 1-hour time frame.
With the growth that gold experienced yesterday, it was able to test all important supply areas.
At the moment, it has a neutral trend where it is, it is likely to grow and collect the liquidity behind the supply area and drop it to the 15-minute demand level that I drew on the chart.
Supply area (2061-2066)
Demand area 15 minutes (2040-2042)
demand area 1-hour(2031-2031)

29/01/24 Weekly outlookLast weeks high: $42827.56
Last weeks low: $40677.38
Midpoint: $38527.20
As the first month of 2024 nears its end BITCOIN finds itself back above 40K after spending half of lasts week below the big even level.
There are 3 main FVG's I have my eye on:
- At the previous weeks MIDPOINT level 40.5K (1H)
- The drop from 49K has left a large FVG at 45.5K (4H)
- The daily FVG at 33K (1D)
Price tends to get pulled and pushed towards these areas of imbalance. HTF imbalances have the largest force of attraction so in this case the 33K daily FVG is the main target in my opinion, and there are many possible routes to this destination.
As it stands BTC is above both 40.5K & 33K FVG's and ideally we would need to retest these areas before progressing towards ATH' s post halving which would also mean clearing the 45.5K FVG on the way back up. For me this is how I think it will play out however if BTC pushes towards 45.5K first I will also be prepared for this move.
For this week I'm concentrating on how BTC regains its strength and if price were to reach the 45.5K FVG , I would think about taking any profits from the recent move should BTC look weak, as I have said that 33K area is calling out to be revisited in my opinion.

AUDCHF LongScenario Price is on the buyside of the curve. On its First SWING of the BUYSIDE, I'm looking for an 3rd LL (lower low) to form to take out sell side liquidity so it can continue to buy up. IF price shoots up it will retrace back down to the "MB" as an retracement (2nd entry to upside)

Halving Forecast Just a quick idea on the state of BTC going into the halving. The countdown to the next big BITCOIN event has started, THE HALVING
Historically this is the event that kicks off the BULLRUN every 4 years. Mining rewards go from 6.25BTC to 3.125BTC and this gives miners a dilemma, do they hold on to their BTC they earn and only sell to cover costs, this diminishes the supply going into the market which raises prices assuming demand remains the same. Or if they do carry on selling their BTC it would be half the amount it was previously and still contributes less to the sells side pressure, raising prices. ETF issuers need these coins to offer to customers + retail investors returning to the market once FOMO enters the playing field.
DEMAND UP
SUPPLY DOWN
As for now I could see a mirror of the ETF rally being a logical path towards the halving. Filling the FVG at 33k would be a great long term entry point for any investor/trader should it hold as support. Once price has wicked down into that area and there's a reaction off that level then the bulls should look to push price for that 3 weeks or so going into the halving and beyond towards ATH as there's not much stopping it and history suggests this is the way BTC behaves after this event every 4 years.

GBPAUD: GET READY TO SHORT!We got a confirmed bearish trend change for GC (2 LL and 2 LH is what I look for to ensure I do not fall for the trap of a fake trend change!)
Now looking for trend continuation to take a short trade.
Waiting for at least a 50% retracement and price coming into the fair value gap (this is a must for my system!)- then we look for a market structure shift on 15min and ATTACK!
The 50% retracement and is also in line with the breaker block.
This is looking like a very yummy short!
Follow and Stay tuned my friends ;)

ETHEREUM ( ETHUSD ) Forecast.... SELL TO BUY!Sell to buy means.... I am bearish in the near term, but bullish in the long term!
Do you agree? Drop me a line in the comments section. I appreciate hearing from my viewers!
Thank you.
May profits be upon you.

EURJPY - READY FOR THE BULL TO CONTINUE?!EJ has some amazing bullish momentum behind it- and I am looking to continue to ride this trend and long it!
I am waiting for at least a 50% retracement and price coming into the daily fair value gap (this is a must for my system!)- then we look for market structure shift on the hourly and attack!
This is looking like a very yummy LONG!
Follow and Stay tuned my friends ;)

Lockheed Martin Corp Bearish Signal Daily EMA CrossAs highlighted in my previous chart, there was an indication of behind-the-scenes pressure on Lockheed Martin to collaborate with the government, particularly considering its involvement in special projects over the last 70+ years. However, recent market sentiment and technical analysis reveal a an added divergence from this narrative.
Initial Problems: (Market Structure & Behind the scenes influence)
The current market structure demonstrates a significant BEARISH trend, as evidenced by a Daily EMA crossover. This trend is further accentuated by aggressive stock offloading, pushing the price down to $431.65. A BEARISH FVG, which I initially underestimated, has now become a pivotal factor in the selling pressure.
Recent statements from government officials and whistleblowers, along with anticipated video evidence, are expected to substantiate claims and intensify market sentiment. Consequently, the immediate target seems to be the previous support level at $397.77, considering the FVG liquidity range of $402.42 to $431.65 has already been factored in during the prior bullish movement and we have a definite bearish signal from the Daily crossing of the EMA.
Additional Problems: (Public)
According to recent reports from Reuters, Lockheed Martin forecasted its 2024 profit to be lower than Wall Street expectations. This outlook is officially considered as being primarily attributed to supply chain disruptions impacting its largest aeronautics segment, including the F-35 jets. These disruptions, is claimed as being partly a result of the pandemic, have notably affected the production rate and resulted in a decrease in net sales from the F-35 program by $275 million in the fourth quarter compared to the previous year.
Final payments for some F-35s are delayed due to the need for testing and approval of a software update on recently built jets. This delay, along with the broader impact of supply chain issues, has contributed to the recent downturn in Lockheed Martin's stock price.
Basically and officially, the current bearish trend in Lockheed Martin's stock is not only a reflection of market sentiment and technical factors but is also deeply influenced by fundamental challenges such as supply chain disruptions and delayed revenues from key projects like the F-35 program. Silently, it is quite a different story. Which problem is of greater importance and affecting the market sentiment? Is this the only time there have been delays and have they produced the same type of price action? The chart never lies and is quite telling of which of the problems is of greater importance.

USD Index ( USD, DXY, DXY1! )... Cautiously BULLISH!Play this cautiously! But there are indications price will venture higher.
Watch the video, and leave a comment, if you would. I respond to all my viewers.
Don't forget to BOOST/LIKE this video!
May profits be upon you.

EURUSD: GET READY TO SHORT SOON!:DWe got a confirmed bearish trend for EU on 4H. MASSIVE BEARISH MOMENTUM
Now looking for trend continuation to take a short trade.
Waiting for at least a 50% retracement and price coming into the daily fair value gap (this is a must for my system!)- then we look for a market structure shift on the hourly and attack!
This is looking like a very yummy short!
Follow and Stay tuned my friends ;)

Short term trade Idea USD/JPY (LONG)Using ICT concepts, I believe we are about to see an expansion on Dollar pairs.
I am getting in sync with this short term USD/JPY, aiming for my weekly short term liquidity objective.
I believe we are making a Tuesday low of the week and after reacting off that daily level, I think we are due to for some expansion.
Entry was on the high of the 15m BPR.
Stops will be moved to break even above Asia's High, 148.556
Partials will be taken @ 148.807.
Any questions, drop me a message!

USD Index ( DXY, DX1! Fututres )... Wait & See!USD Index is in an interesting position, and could go either way. Let the market tip it's hand on Monday, and then trade USD pairs!
Check out my analysis and leave me a comment and/or feedback. I appreciate hearing from my viewers.
May profits be upon you.

GOLD (XAUUSD, GC1! ).... Wait and See!Gold is in the middle of a range. Not a good place to enter a trade!
Let the market unfold on Monday. Let it tip its hand, then make your move.
Look for FVGs to form as price breaks the range. This is the signal to prepare to enter this market.
Please leave a like and a comment. I respond to all of my viewers feedback.
Thank you.
May profits be upon you.

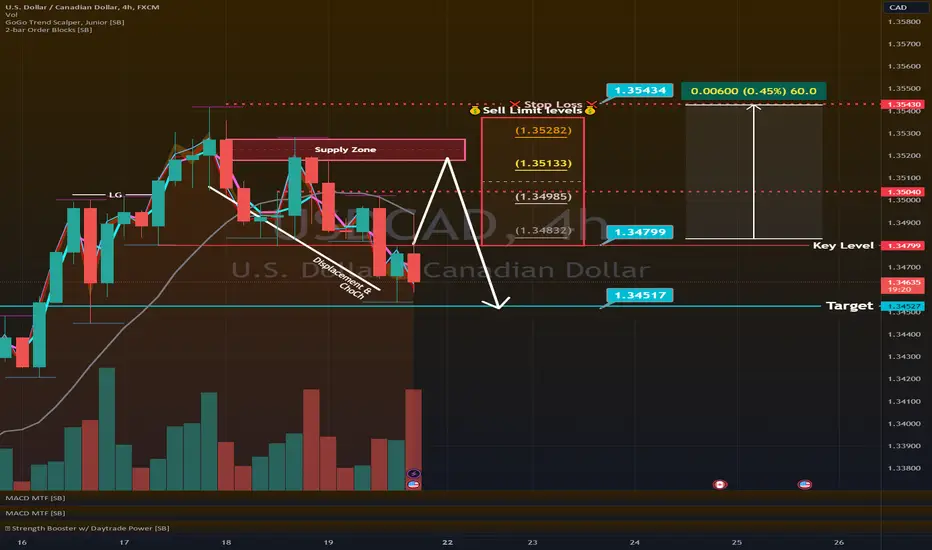
💹A trading opportunities - Short USDCAD retracementLook no further! Our analysis shows that USDCAD is currently in an uptrend in 4H or above timeframes. However, we’ve identified a potential opportunity for a short trade. Key Level 1.3480 has been broken, and we’re waiting for a retest on resistance levels (as marked as Sell limit levels on chart). If all goes well, we could see a touch on 1.3453 and gain some pips from this short trade. More take profit levels and the stop loss are marked on the chart too. 🤑🤑🤑
I hope this helps! Remember, trading is risky and always do your own research and analysis before making any trades. Good luck! 🤞
XAU/USD↘️ Short Trade setup ↘️Hello Everyone 🙋🏽♂️
OTE Premium Zone
💲 Entry Point : 2021.062
✔️ Tp 2003.147
🔴 SL 2031.391
We are not responsible of any losses for anyone, our trades are profitable more for long terms and we take losses as everyone,
manage your lot size as well and your SL and TP and my opinion is 0.01 lot for each 500 $.
Don't forget to hit the like bottom and write a comment to support us.
Follow us for more 🙋🏻♂️
Best Regard / EMA Trading .
Disclaimer:
----------------
It's not a financial advise, As everyone we take losses sometime but for long term trading we are profitable traders, so manage your account well with SL and TP and your lot size to keep your account safe and stay in the market

GBPJPY - READY FOR THE BULL TO CONTINUE?!GJ has some amazing bullish momentum behind it- and I am looking to continue to ride this trend and long it!
I am waiting for at least a 50% retracement and price coming into the daily fair value gap (this is a must for my system!)- then we look for market structure shift on the hourly and attack!
This is looking like a very yummy LONG!
Follow and Stay tuned my friends ;)

XAUUSD|Trading positions in multi-time framesHello guys, I hope you are doing well. We have the gold chart in 1 hour time frame:
For gold, if you remember, we had an bullish order block area, which moved up well upon reaching this area, and it has also started to move up in the return to the candlestick that was formed in one hour and the demand area was formed.
The point that is important in the one-hour timeframe is the level (2030), which is a resistance on the way of gold.
But if we have a close candle above this level, we can hope for its upward trend until the next supply area, which is around (2038-2041).
In the time frame of 15 minutes, we have the refined area of that one-hour supply area, which we can enter selling positions when the price reaches this area.
In the 4-hour time frame, we had a support, and when we reached it, we moved upwards. As long as it is maintained, gold can achieve higher targets, but if this area is broken down, the numbers that can be expected are the supply areas (2005 -2008) and the next area (1990-1995).

EURJPY - READY FOR THE BULL TO CONTINUE?!EJ has some amazing bullish momentum behind it- and I am looking to continue to ride this trend and long it!
I am waiting for at least a 50% retracement and price coming into the daily fair value gap (this is a must for my system!)- then we look for market structure shift on the hourly and attack!
This is looking like a very yummy LONG!
Follow and Stay tuned my friends ;)

GBPJPY - READY FOR THE BULL TO CONTINUE?!GJ has some amazing bullish momentum behind it- and I am looking to continue to ride this trend and long it!
I am waiting for at least a 50% retracement and price coming into the daily fair value gap (this is a must for my system!)- then we look for market structure shift on the hourly and attack!
This is looking like a very yummy LONG!
Follow and Stay tuned my friends ;)

USDJPY - READY FOR THE BULL TO CONTINUE?!UJ has some amazing bullish momentum behind it- and I am looking to continue to ride this trend and long it!
I am Waiting for at least a 50% retracement and price coming into the daily fair value gap (this is a must for my system!)- then we look for market structure shift on the hourly and attack!
This is looking like a very yummy LONG!
Follow and Stay tuned my friends ;)

LOCKHEED MARTIN CORP - LONG THEN BIG SHORTIn examining the technical analysis (TA) of Lockheed Martin Corp's stock chart, we observe discernible indications of a potential trend reversal. Notably, multiple Bearish daily Fair Value Gaps (FVGs) are present, accompanied by a Bearish Order Block (OB) situated just beneath the preceding major peak of $508.10, as delineated in the accompanying chart by blue boxes.
From a fundamental analysis perspective, information from reliable sources indicates imminent challenges within a specific segment of the company's operations. These challenges, poised to become public knowledge shortly, could substantially impact Lockheed Martin's growth trajectory if not adeptly managed.
The root of these challenges can be traced back to 'a program', which is on the brink of exposure due to impending government intervention. Should the company persist in a non-transparent approach to these issues, we anticipate a marked increase in bearish market sentiment favoring selling, potentially depressing the stock's value significantly below its support level at $393.77.
Conversely, if Lockheed Martin's management adeptly capitalizes on the significant commercial and public relations opportunities—particularly concerning the mass production of a groundbreaking, revolutionary product—we foresee a robust market sentiment driving the stock well beyond its all-time high of $508.10. One of the new opportunities could emerge from diversifying Lockheed Martin Corp's business model, potentially exploring manufacturing sectors beyond their traditional scope, or through strategic collaborations with a company (example: 'Tesla') known for their innovation and lateral thinking, thus broadening the range of their market engagement.
Currently, it is imperative for investors, including myself, to encourage Lockheed Martin to engage proactively with governmental entities and the broader community. Such engagement could pave the way for a brighter communal future, concurrently augmenting the intrinsic value of the company. Assuming the mass production of this innovative product materializes, it could potentially double the company's value in a relatively short timeframe. This projection might appear ambitious, but the potential is undeniable once fully comprehended.
However, failure to seize this opportunity could precipitate considerable selling pressure, potentially triggering a significant market correction over time, with the potential to reach a critical support level of $119.95.
