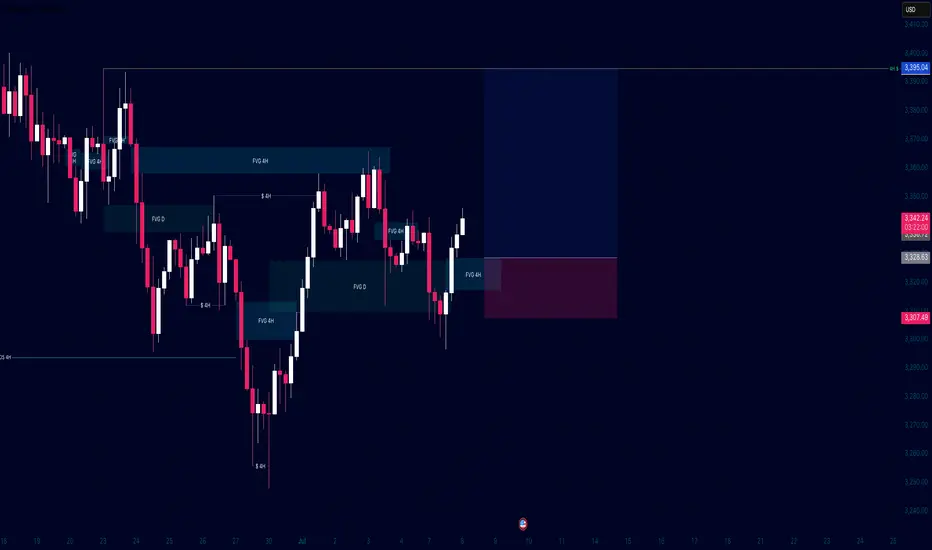
XAUUSD Short term Long ideaGold is in bearish market structure currently for long term but we might have a very good chance taking long trades valid for this week only.
The 4H structure shows IFVG formed Monday which is a strong bullish signal to reach the liquidity above, Once we reach the liquidity I will be shifting my trades to bearish.
Fvg
EURUSD - Looking for the RTLooking for the RT on the upper supply zone, long term target for EURUSD is 1.200-1.2200. However, on RT we can potentially expect a larger pull back but will analyse PA.

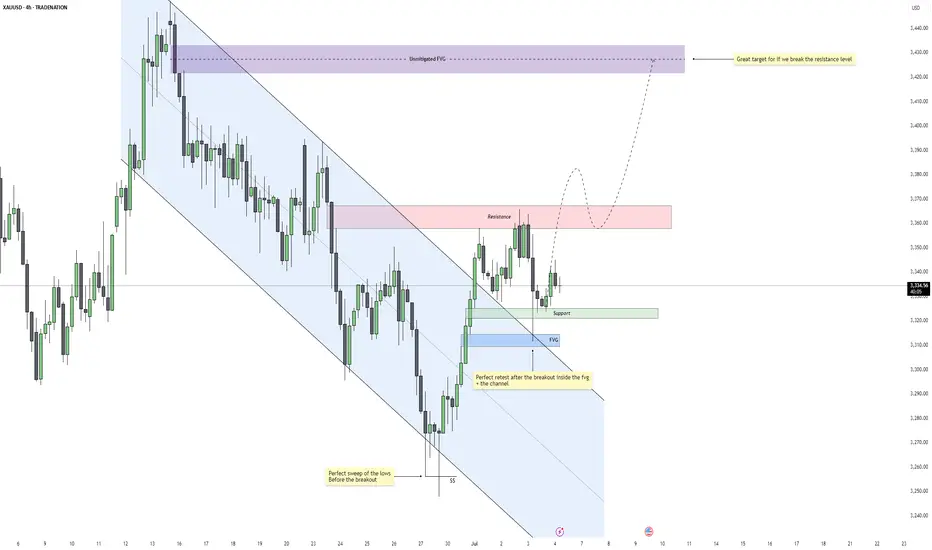
Gold – Is $3430 the Next Target After This Breakout?Gold recently completed a clean sweep of the 4H swing lows, taking out downside liquidity just before breaking out of a well-defined descending channel. This move marked a shift in momentum and structure, suggesting that the bearish leg may have concluded and the market is now transitioning into a more bullish phase.
Breakout Confirmation and Retest Zone
Following the breakout, price retraced and tapped directly into a confluence area where a fair value gap aligns with the upper boundary of the broken channel. This acted as a high-probability retest zone, and the reaction was strong. The market respected this structure perfectly, adding conviction to the breakout's validity.
Support and Resistance Dynamics
Currently, price is hovering between a nearby support level and a short-term resistance zone above. The support is holding firm after the retest, while the resistance is capping upward momentum for now. This is a healthy consolidation following the breakout, and it provides a clear structure for monitoring continuation.
Imbalance Target and Flow Outlook
Should the market gain enough strength to break through the overhead resistance, there is a large unmitigated imbalance further above that stands as a strong magnet. It represents a clean fair value gap left behind during the previous selloff and could be the next major draw if bullish momentum continues.
Overall Flow and Trade Logic
The sequence is very clean: sweep of liquidity, bullish breakout, efficient retest, and now consolidation above support. As long as price continues to form higher lows and respect the current structure, the probability of further upside remains favorable. Patience around the resistance area will be key for confirmation.
Conclusion
Gold is displaying a textbook reversal setup driven by liquidity and structure. If the current support continues to hold and buyers reclaim control above resistance, the path toward the upper imbalance becomes highly probable. The market is aligned for continuation, with bullish momentum building gradually.
Disclosure: I am part of Trade Nation's Influencer program and receive a monthly fee for using their TradingView charts in my analysis.
___________________________________
Thanks for your support!
If you found this idea helpful or learned something new, drop a like 👍 and leave a comment, I’d love to hear your thoughts! 🚀
ZK — Trendline Break & FVG RetestHTF sweep + FVG retest + trendline break — clean R/R setup. Enter after confirmation, main target $0.0806, stop below $0.043.
1. Buy zone: $0.043–0.049 (FVG + trendline retest)
2. Enter after clean reclaim above trendline
3. Main target: $0.0806
4. Stop: below $0.043
If fails to reclaim — stay flat

EURUSD – Bearish Reversal Confirmed After Structural BreakEURUSD has shifted out of its bullish environment after a sustained rally inside a clean ascending channel. Price recently rejected a resistance zone that capped previous buying pressure and has now started to rotate downward. This marks the first serious challenge to the trend and sets the tone for a potential bearish phase.
Channel Breakdown and Price Behavior
The ascending channel had been respected for several sessions, guiding price upward with consistent higher highs and higher lows. The recent breakdown from this structure is significant, as it shows the market is no longer willing to support higher prices within that controlled environment. This type of breakout often signals a loss of momentum and increased volatility in the opposite direction.
Break of the Low and Shift in Structure
After breaking the channel, price also took out a major internal low, which had previously held during retracements. This is a key signal of a structural shift, confirming that the uptrend has been interrupted. When price breaks a low that buyers had been defending, it shows sellers have stepped in with conviction and are likely aiming lower targets.
Short-Term Target and Reaction Zone
The first area of interest sits just below current price where a support shelf and price inefficiencies line up. This zone, marked with the dollar sign symbol on the chart, may attract a short-term reaction. If buyers are still present, this is where they would likely try to step in. However, the rejection from resistance and the structural break suggest this level could eventually give way.
Imbalance Zone Below and Liquidity Target
If that support fails, the next high-probability draw is the large untested imbalance sitting further below. This zone has remained untouched since the rally began and represents unfinished business for the market. Price often seeks out these inefficiencies, especially after trend shifts, making it a natural target for sellers if momentum continues.
Conclusion
EURUSD is showing clear signs of bearish pressure after rejecting resistance, breaking structure, and leaving behind unmitigated downside targets. As long as we remain below the broken low, the path of least resistance points lower. The imbalance zone below remains the key destination unless the market shows signs of reversal higher.
Disclosure: I am part of Trade Nation's Influencer program and receive a monthly fee for using their TradingView charts in my analysis.
___________________________________
Thanks for your support!
If you found this idea helpful or learned something new, drop a like 👍 and leave a comment, I’d love to hear your thoughts! 🚀

US100 - Reversal after liquidity sweep to target new highs?The chart presented shows a 1-hour analysis of the US100 (Nasdaq 100), illustrating a clean and structured price action narrative. Initially, we observe that the market swept liquidity at the lows, indicated by a sharp wick that pierced beneath the previous support levels. This type of liquidity sweep is common when smart money looks to grab stop-loss orders before reversing the trend.
Liquidity sweep to the downside
Following this liquidity sweep, price action aggressively moved upwards, breaking a lower high structure that had previously marked the bearish control of the market. This break of structure is a key bullish signal, suggesting a shift in momentum from bearish to bullish, and often signifies the beginning of a new upward leg.
1H FVG
An important element on this chart is the 1-hour Fair Value Gap (FVG), initially acting as a bearish imbalance. However, due to the strong bullish momentum, price not only reclaimed this level but did so decisively. As a result, this bearish FVG is now considered a bullish FVG, indicating that it may serve as a support zone on any short-term pullback.
Liquidity taken from the upside
After reclaiming the FVG and breaking structure, price surged further, taking out upside liquidity just above recent highs. This action typically leads to a short-term pullback, as profit-taking and new supply enter the market. The chart suggests that any retracement may find support at the 1H FVG, providing a potential entry point for bullish continuation.
Conclusion
In conclusion, the US100 demonstrated a textbook liquidity grab at the lows, followed by a break in bearish structure, a shift in momentum, and an inversion of a key FVG zone from bearish to bullish. The short-term upside liquidity has been cleared, and the next logical target is the high marked on the chart. Should the price respect the newly formed bullish FVG on any pullback, we can expect continuation toward that upper high, completing the bullish run.
Disclosure: I am part of Trade Nation's Influencer program and receive a monthly fee for using their TradingView charts in my analysis.
Thanks for your support.
- Make sure to follow me so you don't miss out on the next analysis!
- Drop a like and leave a comment!

Gold Setup for July 3th: Don’t Get Caught in the Liquidity Net🌙 Good evening, sniper — lock in, load up, and let’s dance with Thursday’s chaos 💣
🌍 Macro & Geopolitical Pulse
Thursday’s setup is not for amateurs:
🔸 Non-Farm Employment Change
🔸 Unemployment Rate
🔸 Initial Jobless Claims
🔸 ISM Services PMI
🔸 Factory Orders
Add to that:
• A Fed still talking tough on rates
• Geopolitical flare-ups in the Black Sea and Middle East
• Gold trading deep into premium…
💡 This is where markets hunt weak hands, then flip direction without mercy.
We don’t chase candles. We wait for exhaustion. Then we execute.
🎯 Bias Snapshot (D1 → H4 → H1)
• Daily closed bullish but deep into old CHoCH + OB
• H4 printed HHs, but structure now presses into stacked supply
• H1 shows momentum fading — RSI divergence + weakening push
📌 Core bias: Still bullish — but every pip above 3360 is loaded with risk.
If 3380 fails to break cleanly, expect rejection.
If it breaks — the market likely wants full liquidity above 3400.
🗺️ Battlefield Zones
🟢 Buy Zone #1 – 3310 to 3320
The sniper’s discount pullback: Fibo 38.2%, M30 OB, EMA 50, and clean imbalance.
Wait for news spike + bullish confirmation to go long.
🟢 Buy Zone #2 – 3285 to 3295
The deep reaction zone.
Fibo 61.8% + OB + gap. Enter only on violent wick and rejection — but RR is exceptional.
🟡 Flip Zone – 3334 to 3340
This is where momentum flips:
• Hold above = continuation toward premium
• Break below = bearish reversal unlocked
No entries here — this is your compass, not your trigger.
🔴 Sell Zone #1 – 3357 to 3366
Classic CHoCH retest. H1/H4 OB with layered liquidity.
If price rejects here on post-news spike — short it back toward the flip.
🔴 Sell Zone #2 – 3387 to 3395
Top-of-range sweep.
If gold blows through zone 1, this becomes liquidity trap central.
Wait for rejection wick + bearish PA confirmation.
🔴 Sell Zone #3 – 3410 to 3420
The final premium kill zone.
This is where the market finishes stop-hunting every breakout buyer.
Fibo extension 1.272–1.618 hits here. If we wick this zone and stall — sniper short back to 3380–3366.
⚔️ Execution Blueprint
Wait for news to trigger the chaos — early entries are a donation.
Short 3357–3366 on exhaustion → target flip zone.
If price overextends into 3387–3395, get ready for the reversal play.
Extreme spike to 3410–3420? That’s your killshot short — ride it back down.
If price retraces into 3310–3320, it’s your safe sniper long.
Panic into 3285–3295? Deep long entry, only with confirmation.
Watch the flip zone (3334–3340) — above = bullish bias holds; below = bears back in control.
🎯 No guesswork. No hope. Just precision. Wait, confirm, and strike.
💬 Let’s stay sharp tomorrow — market will offer clean setups, but patience and clarity are key.
If this plan helped, drop a comment or share your thoughts below.
👉 Follow GoldFxMinds for daily sniper-entry plans crafted with precision.
Smash that🚀🚀🚀 if this plan sharpened your edge.
📝 You already know — we don’t guess, we execute. 🦅
Good night, snipers 💛
⚠️ Disclosure
I’m part of TradeNation’s Influencer Program and use their TradingView charts for analysis & educational content.


GBPUSD LongLooking to the upside got BoS pull back into FVG with the second retest. Looking for the bullish extension to the upside.

Gold is Ready For The Next Bullish Run- Taking a Long Trade HereAfter a series of bearish structures on 4Hour time frame, which is actually a bullish retracement on higher time frame, Gold has now broke the bearish structure with series of bullish candles which turned the trend from bearish to bullish trend.
After the bullish break of structure, Gold retrace into a fair value price level, formed a swing low plus a bullish price action which further confirmed the bullishness of Gold, which is were I took an entry for a buy long trade.
My target for this trade is for Gold to reach the price level of $3,436 which is a 5.36RR return.
I will be monitoring price and manage my trade accordingly as price move in my direction.

Bitcoin - Price struggles below resistance, correction to $104k?This 4-hour chart for BTC/USD illustrates a detailed technical analysis scenario highlighting key resistance and support zones, as well as a critical fair value gap (FVG). The chart shows that Bitcoin is currently facing strong resistance in the $108,000 to $109,000 range. This area has been tested multiple times without a successful breakout, indicating significant selling pressure. The price is currently trading just below this resistance zone, struggling to gain momentum above it.
Support zone in the consolidation
A clear support level has been marked in the recent consolidation area around $106,000. This zone has served as a short-term base during the recent upward movement, and a retest here could provide a temporary bounce or pause in bearish momentum. However, if this support fails to hold, the next major area of interest lies within the 4-hour bullish FVG between approximately $103,000 and $104,000.
4H FVG
There is a clear 4-hour bullish FVG between approximately $103.000 and $104.000. This level can act as a strong support for buyers after filling up the inbalance zone. it is highly important to hold this level as support and not to break below it.
Upside potential
On the upside, if BTC can defend the support in the consolidation zone and reclaim momentum, a push back to the $108,000 to $109,000 resistance area is probable. A successful breakout above this zone would invalidate the bearish scenario and may trigger a bullish continuation, with the potential to reach higher targets such as $111,000 or beyond.
Downside risk
The downside risk becomes more pronounced if BTC breaks below the 4H FVG. A sustained move beneath this level would likely signal weakness in buyer interest and potentially open the path to deeper downside targets. In such a scenario, the price could accelerate lower toward the psychological support level at $100,000. This round number also carries technical and emotional significance for traders, which could create both a strong support area and potential buying interest.
Conclusion
In conclusion, Bitcoin remains at a critical juncture. The key levels to watch are the support within the current consolidation and the 4H FVG imbalance zone. A breakdown below the FVG could lead to a decline toward $100,000, while holding above these levels keeps the door open for another test of resistance at $108,000 to $109,000. A breakout from there would indicate bullish strength and a shift in market sentiment. Traders should remain cautious and reactive to how price behaves around these critical areas.
Disclosure: I am part of Trade Nation's Influencer program and receive a monthly fee for using their TradingView charts in my analysis.
Thanks for your support.
- Make sure to follow me so you don't miss out on the next analysis!
- Drop a like and leave a comment!

Bitcoin - Rejection From Major Resistance, Eyes on 103.8K SupporBitcoin is once again reacting to a major resistance zone around 108.8K, a level that has consistently rejected price in the past. The market attempted a breakout but failed to sustain momentum, forming multiple wicks and signs of weakness near the highs. This repeated rejection suggests that sellers are still in control up here and that this zone remains a strong ceiling for price.
Immediate Downside Scenario
With bearish pressure building at resistance, price is now pulling back and eyeing the first key support level around 103.8K. This zone previously acted as a significant base, with an imbalance overlap and structural demand from past price action. If price taps into this zone and buyers defend it, we could see a recovery bounce and potentially another retest of the upper resistance.
Breakdown Risk and Bearish Expansion
However, if 103.8K fails to hold, this opens the door for a deeper correction. The next logical downside target would be in the 98K region, where a higher timeframe imbalance sits and where price last found strong demand during the last major push up. This would also align with a full sweep of recent liquidity build-ups below.
Bullish Recovery Path
In the bullish case, holding 103.8K could initiate a rebound back toward the 108.8K resistance. This would likely depend on a solid reaction and displacement from the support zone, potentially forming a new higher low structure. For bulls to regain full control, we would need to see a clean breakout above the resistance zone with continuation.
Key Zones to Watch
The red resistance zone near 108.8K remains the clear invalidation for further upside, while the grey support block around 103.8K is the first major level that could decide the short-term trend. If that breaks, the purple demand zone near 98K is a high-probability area for price to find support again.
Conclusion
Bitcoin is still stuck between a strong resistance ceiling and a critical mid-range support zone. The rejection from the top signals that we may see downside in the near term, but whether this turns into a full reversal or just a retracement depends entirely on how price reacts around 103.8K. Hold it and we bounce, break it and we likely drop toward 98K. Keep watching how price behaves at these levels to gauge momentum and direction.
___________________________________
Thanks for your support!
If you found this idea helpful or learned something new, drop a like 👍 and leave a comment, I’d love to hear your thoughts! 🚀

EURGBP Watching the FVG for a Possible Push HigherEURGBP has been showing a clean bullish structure on the 1 hour chart. We got a solid break of structure that left behind an imbalance and price is now pulling back.
There’s a fair value gap just above the previous day’s low and also some local liquidity resting below the last minor low. If price dips into that FVG, fills the imbalance and takes out a bit more liquidity, it could set up the next move up.
I’ll be watching how price reacts in that zone. A strong rejection could signal buyers stepping back in to target the highs and sweep the liquidity sitting above.
No need to rush. Let the market come into the level and prove itself first.

EUR/USD - Liquidity grabbed! Move towards the 4H FVG next?This chart illustrates a short-term bearish outlook on the EUR/USD currency pair, using smart money concepts like liquidity grabs, fair value gaps (FVGs), and structural levels such as support and protected lows. It is based on the 1-hour timeframe and references a higher timeframe (4H) for added confluence.
Liquidity Sweep
At the top of the recent price movement, a "Liquidity sweep" is marked, suggesting that the market pushed above recent highs to trigger stop-losses of short positions or entice breakout traders before reversing. This kind of move is common in smart money concepts and typically precedes a directional shift, which in this case, is anticipated to be downward. This sweep likely removed buy-side liquidity and indicates that institutional traders may now seek to target sell-side liquidity below recent lows.
Support Zone
The green shaded area labeled "Support" represents a previous consolidation or demand zone that temporarily held price after the liquidity sweep. This zone is seen as a short-term reaction point where price may consolidate or bounce slightly before continuing lower. However, the dashed black line projection suggests that this support is not expected to hold long-term, as price is forecasted to break below it.
Protected Low
A previous low is labeled "Protected low," implying that it hasn’t been violated during recent downward moves. This term often refers to a structural level that, if broken, confirms a shift in market structure. In this context, the projection anticipates that price will break below this protected low, indicating a bearish intent and unlocking further downside movement.
4H Fair Value Gap (FVG)
The large blue zone labeled "4H FVG" marks an imbalance or inefficiency on the 4-hour chart. This zone is referred to as a "Strong bullish 4h FVG," suggesting that once the sell-side liquidity is taken and the lower targets are met, this area is expected to act as a high-probability demand zone. Institutional traders often look for price to fill these FVGs before reversing, as they represent unmitigated institutional orders. The projected path implies that this is the ultimate downside target where price may react bullishly.
Conclusion
Overall, this analysis outlines a bearish short-term scenario for EUR/USD. After sweeping liquidity above recent highs, price is expected to respect the bearish order flow, break through the current support level, and move below the protected low. The ultimate downside target lies within the strong 4H FVG, where a significant bullish reaction might occur. This suggests a classic smart money play, manipulate (sweep liquidity), shift (break structure), and mitigate (return to FVG)—offering a well-structured trade idea for both intraday and swing traders.
Disclosure: I am part of Trade Nation's Influencer program and receive a monthly fee for using their TradingView charts in my analysis.
Thanks for your support.
- Make sure to follow me so you don't miss out on the next analysis!
- Drop a like and leave a comment!

BTC to move upwards this week?Daily Outlook:
- market swept sellside liquidity
- price moved impulsively
- market moving higher reaching buyside liquidity
- may reach ATH and sweep to go lower

BTC may going low after ATH?Weekly Analysis:
- Market to go higher , as last week's weekly candle was very bullish
- May sweep Weekly Buyside Liquidity
- May move bearish towards the Weekly FVG


US100 – Extended Rally, Eyes on Pullback to Key SupportUS100 continues to show impressive strength, with no real signs of slowing down yet. The recent push above the previous all-time high came with strong bullish candles and high volume, confirming the breakout as legitimate rather than a false pump. This surge followed a clean retest of the fair value gap below, which acted as a springboard for the next leg higher.
Imbalance Retest and ATH Break
Before the breakout, price perfectly respected the FVG just above the 20,800 zone. That retest was crucial, showing institutional interest in defending higher prices. From there, the index cleared the old ATH with authority, and we are now trading comfortably above it, establishing new highs in the process.
Support Zone Outlook
While momentum remains bullish, the market doesn’t move in a straight line forever. A short-term cool-off is possible. I’m eyeing the marked-out support zone just above 21,400, which previously acted as resistance and now flips to demand. If we do pull back, this is the most logical area for buyers to step back in.
Potential Price Path
The dotted projection outlines two possible paths: one, a minor pullback followed by immediate continuation, and two, a deeper retest into the green support zone before resuming the uptrend. Both scenarios remain bullish as long as price stays above that support. A retest into this level would be healthy and provide a clean long entry for continuation.
Key Levels to Watch
The area around 21,400 to 21,700 is critical. If we revisit this zone, I’ll be watching for bullish price action to confirm continuation. On the upside, we’re now in price discovery mode, so upside targets are more open-ended, but 23,000+ becomes a magnet if momentum stays intact.
Conclusion
US100 is in strong bullish territory, with institutional signs backing the move. A pullback would be welcome and likely provide a high-probability long setup. Until the structure breaks, I remain bullish on this index, watching for a healthy dip into the support zone for potential continuation higher.
Disclosure: I am part of Trade Nation's Influencer program and receive a monthly fee for using their TradingView charts in my analysis.
___________________________________
Thanks for your support!
If you found this idea helpful or learned something new, drop a like 👍 and leave a comment, I’d love to hear your thoughts! 🚀

Bitcoin - Bullflag formation towards $111k?After the long and steep rally in Bitcoin that began on April 9th, the price is now entering a period of consolidation and forming a classic bullish continuation pattern known as a bull flag. This type of structure often appears after a strong impulsive move to the upside and signals that the market may be gearing up for another leg higher.
Bull Flag
On the daily timeframe, BTC is in the process of developing a bull flag by printing a series of lower highs and lower lows within a narrow descending channel. This pullback phase comes after a significant rally and is generally considered a healthy part of a trending market. It reflects a cooling-off period in which the market digests the prior gains while maintaining a bullish bias. This type of structure typically resolves to the upside, continuing the dominant trend. At present, BTC is approaching a key upper boundary of the flag formation, which also aligns with a prior zone of price rejection. This area could act as resistance in the short term and will likely play a crucial role in determining the next directional move.
4H Fair Value Gap
Zooming in on the 4-hour chart, we can observe a clearly defined fair value gap (FVG) between the $102,700 and $103,800 levels. This imbalance was created during the sharp move up and now represents a potential area of interest for buyers. If price retraces into this zone, it could act as strong support where demand steps in, filling the imbalance and potentially triggering the next upward leg. Fair value gaps often serve as magnet zones in trending markets, and in this case, could offer a key entry point for those looking to position long within the larger bullish structure.
Liquidity Levels
One of the more critical areas to watch lies around the $111,000 level, where we see a double top on the lower timeframes. This region holds a significant amount of resting liquidity just above it, as evidenced by the liquidation heatmap. These clustered stop-loss orders and leveraged positions create a liquidity pool that could attract market makers and large players looking to trigger a stop run. As price approaches this level, it becomes increasingly likely that the market may spike into this liquidity before deciding on a longer-term direction. This liquidity zone acts like a magnet and is a common target for short-term wicks and fake-out moves.
Expectations
The current expectation is for Bitcoin to push higher toward the $111,000 level before the market makes a more definitive move. While this upside continuation seems likely in the short term, caution is warranted, especially considering the structure on higher timeframes. The weekly chart is starting to show some signs of exhaustion, with momentum slowing and potential bearish divergence forming. As such, the move to $111,000 could simply be a liquidity grab—a final push to trap breakout traders—before a deeper correction or reversal unfolds. If price does manage to break the all-time high with convincing volume and sustained follow-through, the bullish case would strengthen significantly. Until then, however, it’s important to remain cautious and recognize the risk of a fake-out at these elevated levels.
Conclusion
Despite the strong rally in recent weeks, Bitcoin still faces substantial resistance overhead. The $111,000 level stands out as a critical zone that could act as a magnet, drawing in price action before reversing to the downside. This area is not only technically significant but also loaded with liquidity, increasing the risk of a bull trap. Traders should remain vigilant and avoid getting caught on the wrong side of the move. Watch closely for signs of exhaustion or divergence as price approaches this level, and be prepared for potential fake-outs designed to lure in overly aggressive participants. Staying patient and waiting for confirmation remains the most prudent strategy in this environment.
-------------------------------
Disclosure: I am part of Trade Nation's Influencer program and receive a monthly fee for using their TradingView charts in my analysis.
Thanks for your support.
- Make sure to follow me so you don't miss out on the next analysis!
- Drop a like and leave a comment!

Bitcoin - Bears Take Control, Reversal Coming?After an aggressive bullish rally, Bitcoin has filled a clean 1H imbalance zone near 108K and swept short-term liquidity above recent 1H highs. The move into premium pricing saw clear signs of rejection, with a strong bearish reaction directly inside the imbalance area. This reaction confirms the area as a valid supply zone and signals that bulls may have exhausted their momentum in the short term.
Liquidity Sweep and Rejection
The sweep of prior highs was sharp and quick, lacking follow-through, and was immediately followed by rejection wicks and a drop in momentum. This kind of price action typically hints at engineered liquidity grabs, where smart money drives price into inefficiencies to fill orders before reversing direction. That liquidity sweep, paired with the fill of the 1H FVG, increases the probability that this high is now set in place for a short-term reversal.
Key Short-Term Level to Watch
The immediate level of interest lies at the most recent low before the rally, marked clearly as a potential short-term support. This low often acts as a magnet post-sweep, as price retraces to test if there’s real buyer interest left or not. If this low fails to hold, the bearish momentum could accelerate into the nearby 4H Fair Value Gap around the 102.5K–101.9K area.
Fair Value Gap and Lower Target
That 4H FVG has not yet been filled, and there’s also a small unmitigated imbalance sitting just above it. If price drops into this zone and still fails to show strong buyer interest, the path opens toward a more significant downside move. The final downside target sits near 98K, highlighted by a higher timeframe demand area and major structure level. This zone would only come into play if all intermediate support levels break cleanly.
Bearish Roadmap
Short-term, I expect a retest of the recent low, followed by a possible reaction. But if that reaction fails and momentum stays bearish, the 4H FVG fill becomes highly likely. A break below that would shift control decisively to sellers, with 98K as the next major liquidity pocket to target. This move would also clean out most of the inefficiencies left behind by the recent aggressive bullish move.
Conclusion
The rejection from the 1H imbalance and liquidity sweep suggest Bitcoin’s recent rally may be done for now. Until we reclaim the 1H FVG and break above recent highs with strength, the bias is bearish. If the key low breaks, I’ll be watching how price reacts inside the FVG zone. A weak reaction could open up the flush toward the 98K level for a larger liquidity draw.
___________________________________
Thanks for your support!
If you found this idea helpful or learned something new, drop a like 👍 and leave a comment, I’d love to hear your thoughts! 🚀

US30 - ShortLooking for the Short on US30 final pull back before we see extension to the upside 45,000.

US100 - Liquidity sweep above the ATHIntroduction
The US100 has been exhibiting a strong upward trend on the daily timeframe ever since the sharp correction in early April. This sustained bullish momentum culminated in a break above the previous all-time high (ATH) earlier today. However, this breakout may not be entirely convincing just yet, as there are signs of a potential short-term reversal. The move above the ATH could represent a liquidity sweep, where price action briefly pushes past a key level before retracing, possibly trapping late buyers.
Liquidity Sweep
On the daily chart, the US100 did succeed in breaching the previous ATH, but the breakout appears to have been short-lived. Price quickly reversed after the new high was printed, leaving behind only a wick above the ATH. This type of price action forms what is commonly referred to as a swing failure pattern, a scenario where the market tests liquidity above a key level before turning back down. Such a pattern often signals upcoming weakness, especially when the breakout lacks strong follow-through or volume support.
4H Fair Value Gap (FVG)
During the most recent leg up, the US100 left behind an unfilled fair value gap (FVG) on the 4-hour timeframe. This imbalance zone, created when price moves too quickly in one direction without enough time for buyers and sellers to match orders evenly, often acts as a magnet for price to return to. In the context of the current market structure, this 4H FVG could provide a meaningful support level if the index does experience a pullback. Should the index find support here and show signs of renewed buying interest, the broader uptrend is likely to continue. However, if this zone fails to hold, we may see a deeper retracement toward lower support levels.
Conclusion
While the US100 remains in a strong and well-defined uptrend on the higher timeframes, the recent price action above the ATH introduces the possibility of a short-term pullback. The appearance of a swing failure pattern and the presence of an untested 4H FVG suggest that some corrective movement could unfold in the near term. That said, the FVG presents a key area to watch for bullish continuation. If buyers step in at this imbalance zone, the index could resume its upward trajectory, reaffirming the strength of the current trend.
Disclosure: I am part of Trade Nation's Influencer program and receive a monthly fee for using their TradingView charts in my analysis.
Thanks for your support.
- Make sure to follow me so you don't miss out on the next analysis!
- Drop a like and leave a comment!

Trading AUDUSD NZDUSD | Judas Swing Strategy 25/06/2025This week the Judas Swing strategy has delivered two clean setups on OANDA:AUDUSD and $NZDUSD. Both trades played out beautifully, hitting their targets and ending the day with a solid +4% return (2% each), reinforcing the power of patience, structure, and sticking to the rules.
Let’s break down how each trade unfolded:
Trade 1: OANDA:AUDUSD Long — Textbook Setup
We kicked off Wednesday’s session watching OANDA:AUDUSD closely after identifying a classic Judas Swing scenario.
First, we saw liquidity swept below the previous session’s low, exactly what we’re looking for. This kind of move is crucial to the strategy, it grabs early sellers or stop orders and sets the stage for a reversal.
Right after the sweep, price broke structure to the upside, confirming our bullish bias. At this point, we didn’t rush in. We waited for price to retrace into our FVG (Fair Value Gap).
Patience paid off and price finally tapped into the FVG, and as soon as the entry candle closed in our direction, we executed the trade.
We risk 1% on every trade, aiming for a 2:1 reward-to-risk. After being in drawdown for a bit, price accelerated sharply and hit our target after being in the trade for 5 hours. Clean setup, clean execution, and a smooth +2% return.
Trade 2: OANDA:NZDUSD Long
OANDA:NZDUSD presented a near-identical setup. Price had been consolidating, but by the time the NY session rolled in, the stage was set.
Just like OANDA:AUDUSD , we saw a liquidity sweep at the lows, followed by a bullish break of structure, textbook Judas Swing again.
This time, the retracement into the FVG came swiftly. We executed as soon as we had confirmation on the candle close.
The trade barely hesitated, and price moved decisively in our direction, steadily climbing until our target was hit. Another +2% return, reinforcing the strategy’s strength when rules are respected
What This Week Reminds Us:
Discipline matters: We don’t chase trades. Both setups met all our checklist criteria
Patience is key: Waiting for the FVG entry and confirmation avoids emotional entries
Risk management is the foundation: With a 1% risk and 2:1 target, you only need to win half the time to be consistently profitable
When you follow a rules-based strategy like Judas Swing, you remove the guesswork and bring structure to your trading decisions.
