Bitcoin - Bears Take Control, Reversal Coming?After an aggressive bullish rally, Bitcoin has filled a clean 1H imbalance zone near 108K and swept short-term liquidity above recent 1H highs. The move into premium pricing saw clear signs of rejection, with a strong bearish reaction directly inside the imbalance area. This reaction confirms the area as a valid supply zone and signals that bulls may have exhausted their momentum in the short term.
Liquidity Sweep and Rejection
The sweep of prior highs was sharp and quick, lacking follow-through, and was immediately followed by rejection wicks and a drop in momentum. This kind of price action typically hints at engineered liquidity grabs, where smart money drives price into inefficiencies to fill orders before reversing direction. That liquidity sweep, paired with the fill of the 1H FVG, increases the probability that this high is now set in place for a short-term reversal.
Key Short-Term Level to Watch
The immediate level of interest lies at the most recent low before the rally, marked clearly as a potential short-term support. This low often acts as a magnet post-sweep, as price retraces to test if there’s real buyer interest left or not. If this low fails to hold, the bearish momentum could accelerate into the nearby 4H Fair Value Gap around the 102.5K–101.9K area.
Fair Value Gap and Lower Target
That 4H FVG has not yet been filled, and there’s also a small unmitigated imbalance sitting just above it. If price drops into this zone and still fails to show strong buyer interest, the path opens toward a more significant downside move. The final downside target sits near 98K, highlighted by a higher timeframe demand area and major structure level. This zone would only come into play if all intermediate support levels break cleanly.
Bearish Roadmap
Short-term, I expect a retest of the recent low, followed by a possible reaction. But if that reaction fails and momentum stays bearish, the 4H FVG fill becomes highly likely. A break below that would shift control decisively to sellers, with 98K as the next major liquidity pocket to target. This move would also clean out most of the inefficiencies left behind by the recent aggressive bullish move.
Conclusion
The rejection from the 1H imbalance and liquidity sweep suggest Bitcoin’s recent rally may be done for now. Until we reclaim the 1H FVG and break above recent highs with strength, the bias is bearish. If the key low breaks, I’ll be watching how price reacts inside the FVG zone. A weak reaction could open up the flush toward the 98K level for a larger liquidity draw.
___________________________________
Thanks for your support!
If you found this idea helpful or learned something new, drop a like 👍 and leave a comment, I’d love to hear your thoughts! 🚀
Fvg

US30 - ShortLooking for the Short on US30 final pull back before we see extension to the upside 45,000.

US100 - Liquidity sweep above the ATHIntroduction
The US100 has been exhibiting a strong upward trend on the daily timeframe ever since the sharp correction in early April. This sustained bullish momentum culminated in a break above the previous all-time high (ATH) earlier today. However, this breakout may not be entirely convincing just yet, as there are signs of a potential short-term reversal. The move above the ATH could represent a liquidity sweep, where price action briefly pushes past a key level before retracing, possibly trapping late buyers.
Liquidity Sweep
On the daily chart, the US100 did succeed in breaching the previous ATH, but the breakout appears to have been short-lived. Price quickly reversed after the new high was printed, leaving behind only a wick above the ATH. This type of price action forms what is commonly referred to as a swing failure pattern, a scenario where the market tests liquidity above a key level before turning back down. Such a pattern often signals upcoming weakness, especially when the breakout lacks strong follow-through or volume support.
4H Fair Value Gap (FVG)
During the most recent leg up, the US100 left behind an unfilled fair value gap (FVG) on the 4-hour timeframe. This imbalance zone, created when price moves too quickly in one direction without enough time for buyers and sellers to match orders evenly, often acts as a magnet for price to return to. In the context of the current market structure, this 4H FVG could provide a meaningful support level if the index does experience a pullback. Should the index find support here and show signs of renewed buying interest, the broader uptrend is likely to continue. However, if this zone fails to hold, we may see a deeper retracement toward lower support levels.
Conclusion
While the US100 remains in a strong and well-defined uptrend on the higher timeframes, the recent price action above the ATH introduces the possibility of a short-term pullback. The appearance of a swing failure pattern and the presence of an untested 4H FVG suggest that some corrective movement could unfold in the near term. That said, the FVG presents a key area to watch for bullish continuation. If buyers step in at this imbalance zone, the index could resume its upward trajectory, reaffirming the strength of the current trend.
Disclosure: I am part of Trade Nation's Influencer program and receive a monthly fee for using their TradingView charts in my analysis.
Thanks for your support.
- Make sure to follow me so you don't miss out on the next analysis!
- Drop a like and leave a comment!

Trading AUDUSD NZDUSD | Judas Swing Strategy 25/06/2025This week the Judas Swing strategy has delivered two clean setups on OANDA:AUDUSD and $NZDUSD. Both trades played out beautifully, hitting their targets and ending the day with a solid +4% return (2% each), reinforcing the power of patience, structure, and sticking to the rules.
Let’s break down how each trade unfolded:
Trade 1: OANDA:AUDUSD Long — Textbook Setup
We kicked off Wednesday’s session watching OANDA:AUDUSD closely after identifying a classic Judas Swing scenario.
First, we saw liquidity swept below the previous session’s low, exactly what we’re looking for. This kind of move is crucial to the strategy, it grabs early sellers or stop orders and sets the stage for a reversal.
Right after the sweep, price broke structure to the upside, confirming our bullish bias. At this point, we didn’t rush in. We waited for price to retrace into our FVG (Fair Value Gap).
Patience paid off and price finally tapped into the FVG, and as soon as the entry candle closed in our direction, we executed the trade.
We risk 1% on every trade, aiming for a 2:1 reward-to-risk. After being in drawdown for a bit, price accelerated sharply and hit our target after being in the trade for 5 hours. Clean setup, clean execution, and a smooth +2% return.
Trade 2: OANDA:NZDUSD Long
OANDA:NZDUSD presented a near-identical setup. Price had been consolidating, but by the time the NY session rolled in, the stage was set.
Just like OANDA:AUDUSD , we saw a liquidity sweep at the lows, followed by a bullish break of structure, textbook Judas Swing again.
This time, the retracement into the FVG came swiftly. We executed as soon as we had confirmation on the candle close.
The trade barely hesitated, and price moved decisively in our direction, steadily climbing until our target was hit. Another +2% return, reinforcing the strategy’s strength when rules are respected
What This Week Reminds Us:
Discipline matters: We don’t chase trades. Both setups met all our checklist criteria
Patience is key: Waiting for the FVG entry and confirmation avoids emotional entries
Risk management is the foundation: With a 1% risk and 2:1 target, you only need to win half the time to be consistently profitable
When you follow a rules-based strategy like Judas Swing, you remove the guesswork and bring structure to your trading decisions.

GBPJPY: Let It Come Lower Before It Goes HigherGBPJPY swept the highs, broke structure, and is now giving signs of a clean retracement. There’s a visible FVG just below, and a small liquidity pocket that hasn’t been touched yet.
If price drops into that zone and respects it, we could see a strong bounce that takes us right back into the highs and beyond.
This setup looks like a simple buy-the-dip scenario , but only if the zone reacts cleanly. No rush. Let price come down. Watch for confirmation before thinking long.
Don’t chase it. Let it unfold.

US30 - Long 43,150Still looking for that 43,150 lets get a test of FVG then on bullish PA above we can plan trade. Stops would go below the order block.

EURUSD - Bears Preparing a Bearish Shift in StructureEURUSD has been pushing higher over the past few sessions, reaching into a key liquidity zone. On the 4H chart, we’ve now seen a very clean sweep of previous swing highs, which completes the first step needed for a potential reversal. This sweep acted as a buy-side liquidity run, taking out resting orders before showing early signs of exhaustion.
Liquidity Sweep and Structural Confirmation
The sweep of the highs marked a potential turning point, but for this setup to gain validity, we need to see confirmation through structure. That confirmation would come from a decisive 4H close below the red mitigation zone. This area aligns with a small demand that previously pushed price up, so a close below would mark a clean break in bullish order flow and confirm a bearish structure shift.
Downside Expectations and Key Levels
If the structure shift is confirmed, I expect EURUSD to move lower toward the fair value gap around 1.14600 to 1.14400. This FVG could provide temporary support, and we may see some reaction there. However, due to the size of the imbalance and the overall context, price has the potential to continue lower through that level.
Interim Reactions and Minor Scenarios
There is a chance price reacts to the FVG and pulls back before continuing lower. Any bounce from this zone would likely be short-term unless it leads to a clear market structure shift back to the upside. If price fails to hold above the FVG, the deeper support zone below near 1.13800 would become the next logical target.
Trigger Point for Bearish Bias
The most important trigger for this trade is a 4H close below the red box. Without that, the bullish structure technically remains intact. Once that level is broken, I will consider the sweep and break combination a completed reversal signal, targeting the FVG and beyond.
Conclusion
This setup follows a textbook liquidity grab followed by a potential structure break. Patience is key here, as I’m waiting for confirmation before taking action. If price closes below the red zone, I’ll be actively looking for shorts targeting the 1.14600 region, with room to extend lower depending on how price reacts at the FVG.
Disclosure: I am part of Trade Nation's Influencer program and receive a monthly fee for using their TradingView charts in my analysis.
___________________________________
Thanks for your support!
If you found this idea helpful or learned something new, drop a like 👍 and leave a comment, I’d love to hear your thoughts! 🚀

US30 - Entries ActiveAs anticipated got the sweep below then break above our area with a U shape formation. Looking to the upside.
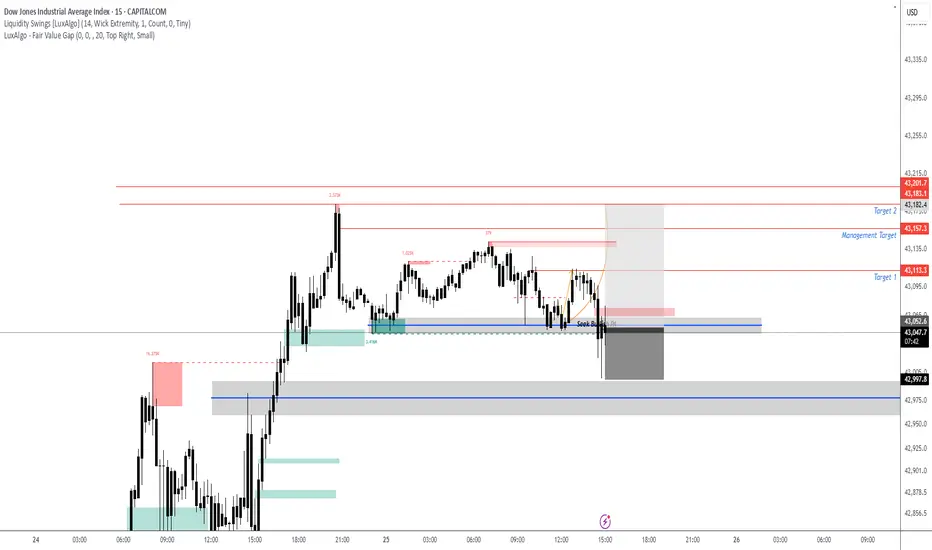
US30 - Final Push before PullbackPotentially another push to upper levels of supply potentially 43,150-43,200. Can see this retest before seeing a potential pull back based off larger time frame.

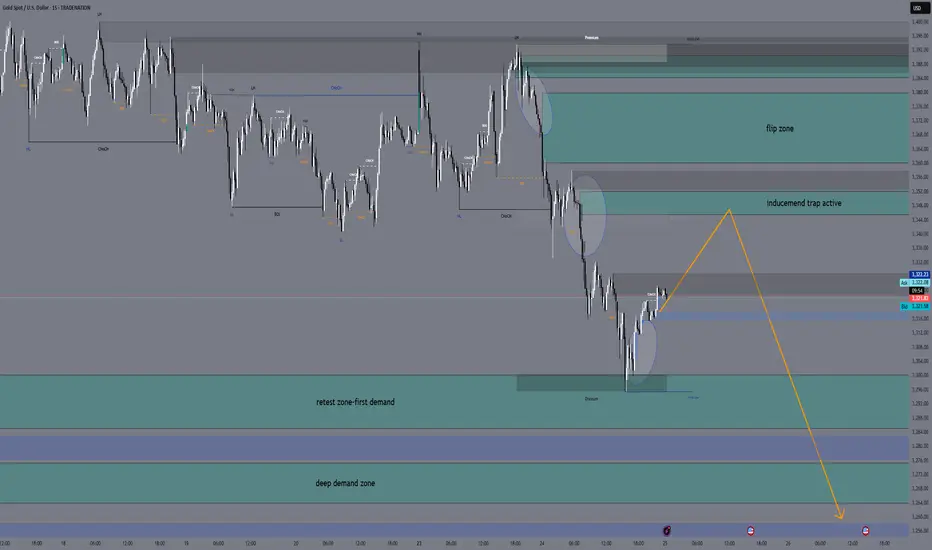
XAUUSD Daily Sniper Plan – June 25, 2025👋👋 Hello traders!
Gold is still moving down strongly. Today’s plan is made for traders who want clear and precise levels. Let’s look at the structure, important zones, and where to watch for trades.
1. Higher Timeframe Overview (Daily, H4, H1)
Daily: Price is falling near the 200 EMA around 3323. RSI shows less buying strength. We wait for a clear move.
H4: The trend is down with lower highs at 3418 and lower lows at 3311. RSI is low, showing weak buying. Price is near the 200 EMA.
H1: Small bounce up to 3328–3332 resistance. RSI is weak, so price must break this zone to move higher.
2. Lower Timeframe Details (M30, M15)
M30: EMA5 crossed above EMA21 but price is near resistance at 3328–3332. RSI is neutral.
M15: Price broke a small wedge up but is limited by EMA21 and EMA50. RSI near 58 shows price could be overbought.
3. Key Zones and How to Trade Them
🔻 Sell Zone: 3345 – 3352
Look for signs that price rejects this zone (wicks, bearish candles) before selling.
🟡 Flip / Decision Zone: 3360 – 3380
Do not trade here. This zone will show if trend changes. Wait for clear confirmation.
🟢 Buy Zone: 3300 – 3285
Look for price rejection and strong buying signs before buying here.
🟢 Deep Buy Zone: 3265 – 3272
Only buy here if price goes below 3280 and shows strength.
4. What to Do
Current price is about 3323.
If price goes above 3332, watch the sell zone 3345–3352 for a short trade.
If price drops below 3332, expect a move down to the buy zone 3300–3285.
Do not buy above 3360 without a clear trend change.
Be patient and wait for good signals.
5. Important Levels
Zone Price Range Notes
Sell Zone 3345 – 3352 Best short zone
Flip Zone 3360 – 3380 Wait and watch, no trades
Buy Zone 3300 – 3285 Good buy zone
Deep Buy Zone 3265 – 3272 Last buy chance
📣 If you like clear and simple plans, please like, comment, and follow
I’m part of Trade Nation’s Influencer Program and get paid to use their charts.
Bitcoin - Bounce Incoming or Breakdown to 97.5k?Market Context
Bitcoin recently swept the 100k lows, clearing out built-up liquidity beneath that level. This move formed a strong reaction candle, suggesting interest from buyers and confirming the presence of resting demand. The sweep aligns with the concept of smart money targeting obvious liquidity pools before shifting direction. It also marks a potential short-term low, at least temporarily.
Short-Term Structure and FVG Setup
Following the sweep, price tapped into a clean 1H fair value gap and has been respecting it so far. This is our immediate line in the sand. As long as this gap holds, we’re dealing with a scenario of temporary bullish order flow. The market structure on lower timeframes suggests the potential for a short-term rebound, possibly into the inefficiencies left above.
Upside Target and Gap Fill Potential
If price continues to hold the 1H FVG, we could see a push higher that targets unfilled gaps above, particularly the one where we saw a clean rejection previously. There’s a clear inducement just above recent highs, so a sweep of those could be used to fill that imbalance. This would align with the idea of running internal liquidity before reversing or stalling at supply.
Bearish Breakdown Scenario
On the flip side, if price breaks down from the 1H FVG without reclaiming structure, the entire bullish idea invalidates. In that case, I expect price to gravitate back toward the 97.5k zone. This would be a logical area for deeper mitigation and potential reaccumulation, especially since it sits below the current consolidation. The failure to hold the gap would signal weak demand and continuation of the broader bearish leg.
Scouting Liquidity and Price Flow
Right now, the main idea is tied to how price behaves around the short-term 1H FVG. That is the pivot. Hold it, and we should see some form of liquidity run into the unfilled gap above. Lose it, and the next wave of downside should unlock, pushing us closer to 97.5k. Either way, liquidity remains the core driver in both directions.
Conclusion
Price has swept major downside liquidity and is now reacting to a key imbalance. As long as the 1H fair value gap holds, I expect short-term upside targeting unfilled inefficiencies and internal highs. A failure to hold would shift the bias back to the downside, with the 97.5k range as the next probable draw on liquidity.
___________________________________
Thanks for your support!
If you found this idea helpful or learned something new, drop a like 👍 and leave a comment, I’d love to hear your thoughts! 🚀

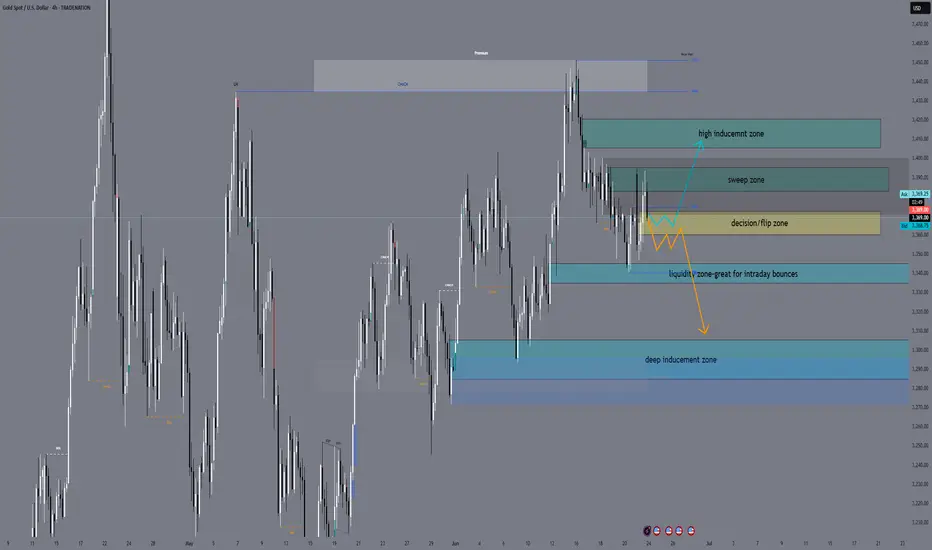
XAUUSD Daily Sniper Plan – June 24, 2025“Snipers wait. Structure tells the story.”
Hello traders! The market is stuck between the FOMC high at 3452 and the confirmed low at 3340. Price is compressing under H1 supply and above a key liquidity pocket. Here's your full plan with all sniper zones — now including a decision zone for intraday confirmation.
📰 Macro + Fundamental Context
Powell Testimony + multiple FOMC speeches today → high potential for dollar-driven volatility.
Inflation concerns and hawkish tone expected → short-term gold bearish pressure unless structure reclaims 3415+.
Smart money likely hunting liquidity both below 3340 and above 3400.
🔸 HTF Structure Summary (D1 → H4 → H1)
D1: Consolidation between 3452 and 3340. No new BOS.
H4: LL formed at 3340. LH not confirmed. Market is compressing under resistance.
H1: CHoCH + BOS confirmed. Current price sits in mid-range.
🔍 Sniper Entry Zones
🟥 Sell Zone 1: 3382–3395
H1 supply zone with previous rejection.
Includes order block + FVG.
Valid for new short entries if price returns and rejects.
🟥 Sell Zone 2: 3406–3420
High-risk spike zone from FOMC.
Only valid during fast, news-driven price movement.
Not a default entry unless confirmed rejection.
🟨 Decision Zone (Flip Area): 3360–3372
This is the key intraday flip level.
If price stays below, sell zones remain valid.
If price closes above, short bias is invalid and market may aim higher.
Use this zone to confirm bias before entering from either side.
🟩 Buy Zone 1: 3335–3345
Strong demand under equal lows.
OB + small imbalance on M15.
Valid for intraday long setups if confirmed with bullish price action.
🟦 Buy Zone 2: 3305–3285
H4 demand zone with major liquidity below.
Deep reversal area — only valid if price breaks 3340.
Smart money may be waiting here.
📌 Key Levels Summary
Zone Type Price Range Explanation
🔺 Premium OB 3450–3480 Daily supply zone
🟥 Sell Zone 1 3382–3395 Active H1 supply
🟥 Sell Zone 2 3406–3420 FOMC wick inducement
🟨 Flip Zone 3360–3372 Decision area — confirm bias
🟩 Buy Zone 1 3335–3345 Demand under equal lows
🟦 Buy Zone 2 3305–3285 H4 demand + deep liquidity
📣 Final Notes
📌 The market is at a critical moment. The flip zone (3360–3372) will decide tomorrow’s control: bear continuation or deeper retracement.
Watch price at the zone. Let the structure speak. Trade only where the logic is clean.
👁 Good luck in the market tomorrow, traders!
— GoldFxMinds
🟨 Disclosure: I am part of TradeNation’s Influencer Program and receive a monthly fee for using their TradingView charts in educational work.
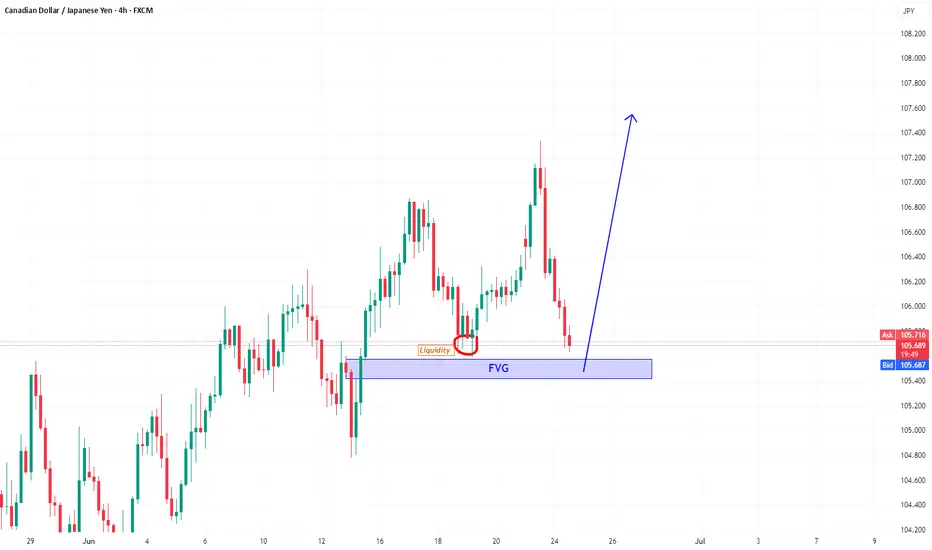
CADJPYHaigh Bullish opportunity.
Price will rebound from FVG area which never touch before ,Also will sweep the previous liquidity which not taken before
CADCHF bullish Price will rebound from FVG area which never touch before , Target next liquidity area.

US30 - Intraday long scalp then short Looking for that intraday scalp on the long around 120 points can hold potentially further up to our higher supply level. If bearish PA is confirmed around the 43,000 level can look to take this short. All dependent on PA.

XAUUSD Daily Sniper Plan – Monday, June 23, 2025Current Price: 3368.76
Trend: Bearish on H4 | Corrective on H1 | Weak Bullish Attempt on M15
Market Context: Gold is consolidating under EMA pressure after FOMC. Price is pinned inside a key flip zone, awaiting Monday’s fundamental triggers.
🔸 HTF Overview (D1, H4, H1)
📰 Macro + Economic Context – Week of June 23–28:
This is a high-impact week for USD with Fed speeches, inflation, and growth data. Monday opens with caution:
Monday, June 23
🟠 FOMC Member Waller Speaks
🔴 Flash Manufacturing & Services PMI
🟠 Existing Home Sales
Tuesday, June 24
🔴 Fed Chair Powell Testifies
🟠 CB Consumer Confidence
🟠 Richmond Manufacturing Index
Wednesday, June 25
🔴 Powell Testimony (Day 2)
🟠 New Home Sales
Thursday, June 26
🔴 Final GDP q/q
🔴 Unemployment Claims
🟠 Durable Goods Orders
🟠 Pending Home Sales
Friday, June 27
🔴 Core PCE Price Index
🟠 Revised UoM Consumer Sentiment
📌 Monday is lighter in impact, but PMI data and Waller’s speech may spark the week’s directional bias. Avoid trading blindly into PMI spikes.
H4 Structure & Bias:
Bearish trend intact: Lower High = 3418, Lower Low = 3311
EMAs (21/50/100) aligned downward — price capped below 3380
RSI still under 60 = no bullish momentum
Rejection zone remains valid at 3406–3420 (H4 OB)
Strong demand expected at 3340–3352 and extreme at 3310–3288
🔸 LTF Precision (M30, M15)
Price compressing around 3365–3372
RSI around 56 → indecision
No bullish HH above 3380 = still within bearish control
EMA flattening → prepare for trap setups around NY open
🧭 Trade Scenarios
🔻 Sell Zone – 3406–3420
H4 OB, FVG top, liquidity above 3405
Entry: 3412
SL: 3426
TP1: 3312
TP2: 3288
TP3: 3265
🧠 Wait for sweep or strong bearish reaction — no early entries.
⚠️ Flip Zone – 3360–3380
No-trade zone: EMA cluster + mid-FVG
Only use for confirmations, not entries
🟢 Buy Zone – 3340–3352
OB + demand + Fib retracement
Entry: 3348
SL: 3334
TP1: 3448
TP2: 3472
TP3: 3490
🟢 Buy Zone – 3310–3288
Below LL sweep (3311)
Deep liquidity + OB demand
Entry: 3298
SL: 3280
TP1: 3365
TP2: 3405
TP3: 3440
📍 Key Structural Levels – June 23
Level Type Role
3460 Bull Trap Limit Irrational spike area
3445 FOMC Unfilled wick – trap zone
3426 Sell Zone Risk protection above OB
3418 H4 LH Confirmed bearish structure
3410 OB Midpoint Micro-rejection inside OB
3395 Previous HH Inducement target
3384 FVG Top Minor LTF rejection
3360–3380 ⚠️ Flip Zone MA/FVG compression – avoid entries
3352 OB entry edge Buy Zone 1 upper limit
3340 OB base Buy Zone 1 key level
3311 H4 LL Confirms bear structure
3300 Round Level Psychological + liquidity
3288 OB base Final demand structure zone
3265 Final TP Bearish extension only
✅ Final Action Plan
📉 Stay bearish below 3380 unless a clean HH + OB support forms
⚠️ Avoid trading inside 3360–3380 flip zone during NY PMI data
🛒 Longs valid only from 3340 or 3310 with confirmation (RSI, PA, OB)
🧠 Focus on structure integrity and clean OB rejections only
💬 Will you fade the 3412 OB or wait for the sniper bounce at 3348?
🔔 Follow and 🚀@GoldFxMinds for premium breakdowns, macro updates, and real-time sniper execution guidance.
🔹 Disclosure: As part of Trade Nation’s Influencer Program, we receive monthly compensation for using their charts.
GoldFxMinds

Mastering Inverse Fair Value Gaps (IFVG) - How to use them?In this guide, I’ll explain the concept of the Inverse Fair Value Gap (IFVG), how it forms, and how you can use it to identify high-probability trading opportunities. You'll learn how to spot the IFVG on a chart, understand their significance in price action, and apply a simple strategy to trade them effectively.
What will be discussed?
- What is a FVG
- What is an IFVG
- What is a bullish IFVG
- What is a bearish IFVG
- How to trade the IFVG
-------------------------------
What is a FVG?
A FVG is a technical concept used by traders to identify inefficiencies in price movement on a chart. The idea behind a fair value gap is that during periods of strong momentum, price can move so quickly that it leaves behind a "gap" where not all buy and sell orders were able to be executed efficiently. This gap creates an imbalance in the market, which price may later revisit in an attempt to rebalance supply and demand.
A fair value gap is typically observed within a sequence of three candles (or bars). The first candle marks the beginning of a strong move. The second candle shows a significant directional push, either bullish or bearish, often with a long body indicating strong momentum. The third candle continues in the direction of the move, opening and closing beyond the range of the first candle. The fair value gap itself is defined by the price range between the high of the first candle and the low of the third candle (in the case of a bullish move), or between the low of the first candle and the high of the third (in a bearish move). This range represents the area of imbalance or inefficiency.
-------------------------------
What is an IFVG?
An Inverse Fair Value Gap (IFVG) occurs when a traditional Fair Value Gap (FVG) is not respected by price, and instead of acting as a support or resistance zone, price breaks through it with strength. Normally, a Fair Value Gap represents a price imbalance left by a strong move, and when price returns to this area, it often reacts by respecting the gap, bouncing off it or reversing, because it's seen as a high-probability level where orders may rest.
However, in the case of an IFVG, price does not respect this imbalance. Instead, it slices through the FVG in the opposite direction, showing that the initial momentum behind the imbalance has weakened or reversed. This breach is a strong indication that market sentiment is shifting. What was once a zone of strength now becomes invalid, and this failed reaction signals that the opposite side of the market (buyers or sellers) has taken control.
The IFVG highlights a key transition in momentum. It tells traders that the prior bias, bullish or bearish, is breaking down, and the new dominant force is pushing price beyond levels that would typically hold. This makes the IFVG useful not only as a sign of failed structure but also as a potential confirmation of a trend reversal or strong continuation in the opposite direction. Essentially, where an FVG usually acts as a wall, an IFVG is what’s left after that wall gets knocked down.
-------------------------------
What is a bullish IFVG?
A bullish Inverse Fair Value Gap (IFVG) occurs when price breaks through a bearish Fair Value Gap (FVG) instead of respecting it. In a typical bearish FVG, the expectation is that when price retraces into the gap, it will react to the imbalance, usually by reversing lower, as the area represents previous selling pressure or inefficiency caused by aggressive sellers.
However, when price does not react bearishly and instead breaks cleanly through the bearish FVG, it signals a shift in market sentiment and momentum. This breakout through the imbalance suggests that buyers are now in control and that the bearish pressure in that zone has been absorbed or invalidated. What was once considered a resistance area is now being overpowered, often leading to continued bullish movement.
-------------------------------
What is a bearish IFVG?
A bearish Inverse Fair Value Gap (IFVG) occurs when price breaks through a bullish Fair Value Gap (FVG) instead of respecting it. In a normal bullish FVG, the expectation is that when price returns to the gap, it will act as support and prompt a move higher, as this area represents a previous imbalance created by strong buying pressure.
However, when price fails to respect the bullish FVG and instead breaks down through it, this signals a shift in momentum to the downside. The anticipated support fails to hold, suggesting that buyers are no longer in control or that their efforts have been overwhelmed by aggressive selling. This kind of move transforms the bullish FVG into a bearish signal, as it confirms weakness in what was previously considered a demand zone.
-------------------------------
How to trade the IFVG?
Trading the Inverse Fair Value Gap (IFVG) requires patience, precision, and clear confirmation of a shift in momentum. The process involves waiting for key conditions to form before entering a trade. Here's how to approach it step-by-step:
First, you need to wait for a liquidity sweep. This means price must take out a recent high or low, typically a short-term liquidity pool, trapping traders on the wrong side of the market. This sweep sets the stage for a potential reversal and indicates that the market is ready to shift direction.
After the liquidity sweep, watch for a 1-minute Fair Value Gap (FVG) to form and then get broken in the opposite direction. This break is crucial, it’s what creates the Inverse Fair Value Gap. The invalidation of this initial FVG confirms that momentum has switched and that the market is no longer respecting the previous imbalance.
Once the IFVG has formed, your entry comes on the close of the candle that breaks and closes beyond the IFVG, above it in a bullish scenario, or below it in a bearish one. This close confirms that the gap has not held and that price is likely to continue in the new direction.
Place your stop loss below the low (for a bullish setup) or above the high (for a bearish setup) of the structure that formed the IFVG. This gives you protection just beyond the level that would invalidate the setup.
-------------------------------
Thanks for your support.
- Make sure to follow me so you don't miss out on the next analysis!
- Drop a like and leave a comment!

EURUSD Long As the war escalated over the weekend market gapped during Asia session invalidating our initial forecast. (Linked Idea). Looking for the long on EURUSD.

NASDAQ Bullish Play into Liquidity Before Potential ReversalForecast:
NOTE: At this moment, this is a forecast and trades will be taken dependent on live PA.
Price has reacted strongly off the 21,410–21,430 Daily Order Block, suggesting bullish intent. If bullish structure holds, I expect a move into the 22,060–22,130 liquidity zone, where sell-side setups could form.
This is a classic Buy to Sell model:
Buy from OB at ~21,420
Target liquidity above recent highs (~22,100+)
Look for shorts after sweep into 22,130–22,220 range
Invalidation: Break and close below 21,410 suggests the OB failed — potential deeper drop toward 20,700.

EURUSD M15 Forecast - Check related IdeaAs explained in previous post we are expecting a pull back down to our order block (H4) then a bullish reversal to retest last weeks highs (1.16) region. If price breaks and closes above the M15 supply zone will have to re-evaluate and potentially take a long position from a retest into a FVG.

EURUSD to Retest 1.16 regionWatching the 1.1490–1.1450 zone for a potential bullish reaction. This area includes a 4H Fair Value Gap and Order Block. If price gives a 15M CoCH within this range, I’ll look to enter long.
Targets: 1.1540, 1.1570, and 1.1610
Invalidation below 1.1440
Patience until price delivers a clear setup.

Bitcoin - Will it explode up or down?Introduction
Bitcoin (BTC) is currently trading within a symmetrical triangle pattern, forming a series of higher lows and lower highs. This price action indicates a tightening range as the market approaches the apex of the triangle. A breakout is becoming increasingly likely in the coming days, and traders are now watching closely to see which direction BTC will choose. Will it break to the upside or the downside?
Pattern Trading
The symmetrical triangle has been a consistent feature of BTC’s recent price action. Price has been oscillating between the descending resistance and ascending support trendlines, gradually compressing the range. Based on the current structure, Bitcoin could continue moving within this pattern until around June 26th, when the triangle becomes extremely narrow and a breakout becomes imminent. Historically, such setups can produce false breakouts or “fake-outs,” where the price temporarily moves in one direction before sharply reversing and breaking out in the opposite direction. These moves often trap traders who enter too early, so caution is advised. Market manipulation is not uncommon in these tight formations, making it essential to wait for confirmation before entering a position.
4H Fair Value Gap (FVG)
Bitcoin has recently filled a 4-hour Fair Value Gap (FVG), a zone that often attracts price due to inefficiencies in the market. Now that this gap has been filled, there could be increased selling pressure, potentially pushing BTC back down toward the lower boundary of the triangle. If BTC is unable to break through the resistance created by this FVG, we may see more bearish momentum. However, should BTC manage to break and hold above this imbalance zone, it would be a strong sign of bullish intent and could open the door for a move to the upside. For now, though, this area remains a significant resistance level.
Upside Target
If BTC manages to break out of the triangle to the upside with strong volume and confirmation, the first major resistance level is around $109,000. This would be a logical target for bulls, as it represents a key zone of liquidity and previous interest. A successful move toward this level would confirm the bullish breakout and could set the stage for further gains, depending on broader market sentiment.
Downside Targets
Conversely, if BTC breaks below the lower trendline of the triangle, the first area to watch is around $103,500. This level is where a significant amount of liquidity has built up, and it could act as initial support. However, if that level fails to hold, the next key psychological level to watch would be $100,000. A drop below this milestone could trigger panic selling and further downside, especially if market sentiment turns negative.
Conclusion
At this point, BTC is at a critical juncture, and traders should remain patient as the market decides its next direction. While the current rejection from the 4H FVG suggests some short-term bearish pressure, the overall pattern remains neutral until a confirmed breakout occurs. Trading within the triangle can be risky due to the possibility of fake-outs, so it’s best to wait for clear confirmation before committing to a trade. Stay cautious, manage your risk carefully, and prepare for volatility as Bitcoin approaches a decisive move.
Disclosure: I am part of Trade Nation's Influencer program and receive a monthly fee for using their TradingView charts in my analysis.
Thanks for your support.
- Make sure to follow me so you don't miss out on the next analysis!
- Drop a like and leave a comment!

Bullish Tone, and made a trade based on Pivots amd FVG in comboTrade Analysis
(1) Trade Plan:
The idea was that the short term trend looked bullish, hence I marked up the key levels and checks to see if the price was at any of the pivot levels. Based on the idea when price crosses the Centre Top Pivot and is above a support . Further more it already visited a recent Bullish.. Hence the price may continue towards R1 above.
-
(2) Indicators (4 of 5):
- Only Pivot and Support lines and FVG
(3) Confirmations (3 of 3):
- 30 min candle closing well above the TOP Centre Pivot line.
(4) Risk Management Plan:
- This was little high as it was set to below the end of the Bullish FVG at the bottom. On hindsight i should have waited on my entry for a revisit. However sometimes i don't wait as it does not revisit.
(5) Profit Target:
- R1
(6) Stop Loss:
- Bottom Of FVG
(7) Entry:
- First Candle after 30 min candle closed above TCP
(8) Profit Taking Plan:
-
(9) Analyzation:
-
(10) Psychology of the Trade:
-
(11) Overall Rating:
(12) What was Good:
-
(13) What was Bad:
-
(14) Improvement Areas:
-
(15) Rule Broken & Key Takeaways:
