EURUSD - BreakdownApologies video is a bit rushed.
Wanted to get it done before the weekend arrived.
There's so much more to this video and entry reason that I have left out unintentionally like the fact we swept the Asia lows before creating a BoS. There are also a few other things like I have left out but without looking at the chart right now I cannot remember off the top of my head.
I will post the idea of this trade below so you can see that I was taking it before it played out.
Hope you all have a great weekend and a better trading week than you had this week.
Enjoy
P.S if you have any questions please do message
Fvg

Bitcoin - Expecting Liquidity Grab at 102.8k Before Relief MoveMarket Context
After a strong rejection from resistance, price has shown clear signs of internal weakness. We recently got an internal liquidity sweep followed by a sharp move down, confirming a shift in momentum. The market is currently compressing just below a key fair value gap, hinting at further downside before any real bullish structure can form
Internal Sweep and Bearish Pressure
The internal sweep acted as a final inducement before the market sold off. The reaction afterward was clean and aggressive, suggesting that smart money is offloading positions into trapped longs. Price has now stalled in a tight range, and the lack of bullish follow-through adds weight to the idea that lower prices are still on the table.
Fair Value Gap Below as Draw
The unfilled imbalance below, lining up near 102.8k, is acting as a magnet. This level has not been tapped and lines up cleanly with the idea of a final liquidity sweep before any retracement. It would make sense to target this zone to clear out remaining liquidity and rebalance price before reassessing.
Retracement Scenarios After the Sweep
Once that low is swept and the gap is filled, we could see a retracement back into the previous fair value gap around 106k. This could either form a lower high, continuing the broader downtrend, or potentially run the high if there's enough momentum. Either way, the reaction from that level will offer the next major clue on direction.
Key Expectation
Until the low around 102.8k is swept, the bearish narrative remains intact. The cleanest setup would be a liquidity run into that level followed by a reaction that leads us higher, ideally back toward the 106k zone. From there, we’ll watch how price behaves to decide whether a deeper correction or a trend continuation is in play.
Conclusion
Still leaning bearish short-term as long as that gap and low remain unfilled. Once we tap into the 102.8k area, I’ll be watching for a shift that could give us a play back into the 106k gap. It’s all about liquidity, structure, and the cleanest path for smart money to move.
Disclosure: I am part of Trade Nation's Influencer program and receive a monthly fee for using their TradingView charts in my analysis.
Thanks for your support!
If you found this idea helpful or learned something new, drop a like 👍 and leave a comment, I’d love to hear your thoughts! 🚀

Squeeze Building in BTC – Targeting 100,500 ShortPrice is coiling between interest zones above and a heap of liquidity below. Expecting an impulsive break—looking to short down to ~100,500.

Bitcoin– bearish momentum builds after rejection at $109KIntroduction
Bitcoin (BTC) is currently showing weakness after forming a lower high at $109,000. This level acted as a significant point of rejection, and since then, BTC has been moving lower. The price has broken through key support areas, indicating a possible shift in market structure. In this analysis, we’ll break down the recent price action, explain the technical signals behind the move, and discuss what could be expected in the short term.
Rejection from the 0.786 Fibonacci Level
The rejection at the $109,000 level aligns perfectly with the 0.786 Fibonacci retracement on the 4-hour timeframe. This level is often seen as a strong resistance point during corrective moves, and in this case, it held firmly. The precision of this rejection gives it more weight, and since hitting that point, BTC has been steadily declining. This move down suggests that buyers were unable to push through the resistance, leading to increased selling pressure.
Break of the 4H Bullish FVG
As BTC started its decline from $109,000, it broke through the bullish Fair Value Gap (FVG) that had formed earlier on the 4-hour chart. This gap previously served as a support zone but has now been decisively broken with strong volume. The loss of this level is significant, as it marks a breakdown of the bullish structure and opens the door for further downside movement. In the process of this move lower, BTC has created a new bearish FVG on the 4-hour timeframe. This gap remains open and could potentially act as a magnet for price to revisit, offering a possible short entry if price retraces into that zone. However, the clear break below the previous bullish FVG indicates a shift in momentum and supports a more bearish bias for now.
Downside Target at $102.7K
Given the recent breakdown, the next key level to watch is around $102,700. This area marks the wick low on the 4-hour timeframe and stands out due to the size and sharpness of the wick. Such large wicks often leave behind unfilled orders, which markets tend to revisit over time. The presence of these resting orders makes this level a likely target for the ongoing move down. It also acts as a strong area of potential support, where buyers might step back in if the price reaches that point.
Conclusion
With the rejection from the 0.786 Fibonacci level and the failure to hold the bullish 4H FVG, BTC has shown clear signs of weakness. The breakdown in structure suggests a continuation to the downside is likely, with $102.7k being the most immediate target. This level could serve as a strong support zone due to the unfilled orders left behind by the previous wick. Until BTC reclaims key support levels or shows a shift in momentum, the bias remains bearish in the short term, and traders should remain cautious while expecting further downside.
Thanks for your support.
- Make sure to follow me so you don't miss out on the next analysis!
- Drop a like and leave a comment!

Gold Longlooking to the upside on Gold from Asia lows. This is a prelim entry (forecast) need to seek bullish PA around the FVG if we get a pull back. If a pull back does not form we will wait for a break and RT above 3,352 and plan entries accordingly.


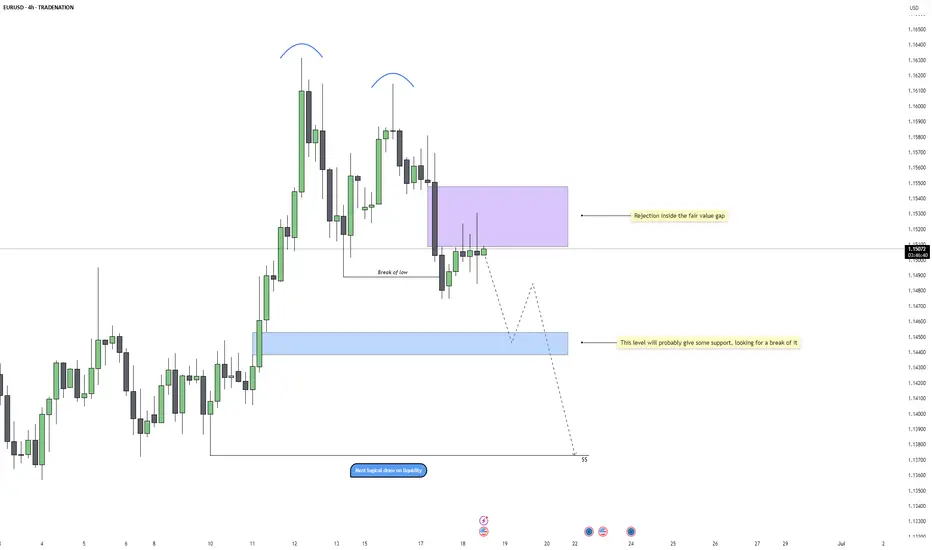
EURUSD - FVG Rejection and Bearish Continuation PlayEURUSD has been showing consistent bearish pressure on the 4H chart, with a clear shift in momentum after forming a double top near 1.162. That marked the beginning of a structural change, which was confirmed once price broke the most recent higher low. Since then, the market has transitioned into a bearish structure, with lower highs forming consecutively. This suggests that the bullish trend is over for now, and the market is more likely to seek liquidity below.
Rejection at Fair Value Gap
After the low was broken, price retraced back into a 4H fair value gap, which has now acted as resistance. This is typical smart money behavior, sweep liquidity, shift structure, then retest an imbalance before continuing lower. The wick rejection inside the purple FVG zone is a strong signal that this area is being respected and that sellers are defending it. The rejection aligns with the overall bearish market flow and suggests that the market has likely completed its retest.
Short-Term Support and Liquidity Target
The light blue FVG around 1.144 could offer temporary support, but the bias remains bearish. That level sits right at the midpoint of the recent bullish leg that was already violated, and while price may pause here, the more logical draw on liquidity sits deeper. Unless there’s a sudden shift in market structure or high-impact fundamental news, this area is expected to eventually give way.
Liquidity Below and Final Target
The cleanest and most obvious liquidity pool rests around the 1.137 zone. This is where price previously consolidated before initiating the impulsive move higher, and it remains unmitigated. If the current bearish structure holds, the market will likely target this area next. The path there might not be linear, we could see a short-term bounce off 1.144, but as long as price remains below the 1.153 FVG rejection, the bearish continuation remains valid.
Trade Expectation and Risk Context
This setup aligns well with typical displacement-retest-continuation behavior. The risk is clearly defined above the FVG rejection, and as long as lower highs continue forming beneath that zone, the bearish thesis remains intact. Key downside targets are 1.144 for partials, and 1.137 as the final draw on liquidity. This setup offers both precision and strong narrative confluence, ideal for swing or intraday positioning.
Conclusion
Price has shifted bearish on the 4H, confirmed by a break of structure and rejection from a clear FVG. As long as we remain below that imbalance, the market should continue hunting liquidity to the downside. 1.144 may act as short-term support, but the real magnet sits at 1.137. Patience and risk control will be key in riding this move effectively.
Disclosure: I am part of Trade Nation's Influencer program and receive a monthly fee for using their TradingView charts in my analysis.
___________________________________
Thanks for your support!
If you found this idea helpful or learned something new, drop a like 👍 and leave a comment, I’d love to hear your thoughts! 🚀
$ETH / USDT – 4H Time Frame Analysis 3,000 INCOMING?? CRYPTOCAP:ETH / USDT – 4H Time Frame Analysis
Structure: Bullish Flag | Outlook: Neutral-Bullish | Target: $3000?
🔹 Chart Overview
-Pattern: Bullish Flag (continuation structure)
Current Range:
- Supply Zone: $2,680.00 – $2,786.21
- Demand Zone: $2,319.79 – $2,417.61
Price Action:
- Tight consolidation between higher lows and lower highs, forming a symmetrical triangle within a flag structure.
Trend:
- Consolidation, but within a macro uptrend (prior strong rally).
Volume Profile:
- Anchored Volume shows high participation around $2,540–$2,600.
OBV:
- Flattening, signaling indecision and potential energy buildup.
Key Psychological Levels:
$2,860: Minor resistance from past S/R flips.
$3,000: Major round-number psychological resistance.
📐 Technical Confluences
Fibonacci Retracement:
- The 0.618 golden pocket aligns with the support trendline, reinforcing this as a critical zone.
Fair Value Gaps (FVG):
- Above Price: Acts as a magnet in bullish continuation.
- Below Price: Risk zone if price drops; aligns with liquidity and trendline support.
- Liquidity Zone: Aligned with 0.5–0.618 retracement; strong reaction expected.
📈 Bullish Scenari o
Breakout of Pennant Resistance:
- A clean break above $2,786 (supply zone & swing high) with volume.
Close above Upper FVG and Liquidity Zone:
- Confirms bullish intent. Targets psychological level at $2,860, then $3,000.
Volume Confirmation:
- OBV uptick and high breakout volume would validate the move.
Bullish Target Zones:
TP1: $2,860 (psych level + previous resistance)
TP2: $3,000 (major psychological level)
TP3: $3,120–$3,180 (1.618 Fib extension)
📉 Bearish Scenario
Rejection from Current Supply or Liquidity Zone:
- Fails to break above supply; rolls over from the upper pennant line.
Break Below Support Trendline:
- Break below golden pocket and $2,417.61 demand zone.
Invalidation of Bullish Flag:
- A breakdown below $2,319.79 (swing low) invalidates the bullish flag and may signal a trend reversal.
Bearish Target Zones:
TP1: $2,200 (local volume gap + structure support)
TP2: $2,060–$2,120 (previous accumulation zone)
TP3: $1,950 (macro support & last strong demand)
✅ Summary
Structure:
- Price is compressing within a bullish continuation pattern, awaiting breakout confirmation.
Bias: Slightly bullish unless the swing low at $2,319 is broken.
Confirmation Needed:
- Break above or below pennant boundaries with volume.

USDCAD SWING TRADE LONG IDEA - MASSIVE BULLISH MOVE COMING?OANDA:USDCAD USDCAD has given a massive bullish break of structure on 4 Hour time frame after tapping to a strong key level on weekly time frame that is serving as support.
Now am bullish on USDCAD for a weekly income swing trading moves.
All I need right now to enter for a long to ride the move is a pull back to key level of support like old highs or imbalance levels.
That is when I will take a bullish long trade on USDCAD.
This is my A+ Trading Setup.
What do you see on your chart?

EUR/USD - Eyes on the major resistance at 1.1540!Introduction
The EUR/USD currency pair has been trending downward on the 1-hour timeframe, indicating that bearish momentum is firmly in control. In this analysis, I will outline what to expect from the pair moving forward, and highlight the high-confluence zone that could offer a potential short setup. This area combines technical factors that suggest it may act as strong resistance if price retraces upward before continuing the downtrend.
Market Structure
On the 1-hour chart, the EUR/USD continues to form a series of lower highs and lower lows, which clearly confirms a bearish market structure. This consistent pattern reinforces that sellers have the upper hand, and that any short-term rallies are likely to be corrective in nature, not trend-changing. As long as this structure remains intact, the broader expectation remains bearish, with sellers likely to defend key resistance levels.
Fair Value Gaps on the 15-Minute and 1-Hour Timeframes
During the latest downward movement, the pair left behind two notable Fair Value Gaps, one on the 1-hour chart and another on the 15-minute chart. These imbalances are closely aligned, creating a strong confluence zone where price may face resistance if it moves back upward. The zone between 1.15400 and 1.15600 represents this overlapping FVG area. Because these gaps were formed by aggressive selling pressure, revisiting this level could trigger a bearish reaction, as traders look to re-enter short positions from a premium price.
Golden Pocket Fibonacci Retracement
Adding to this confluence, the Golden Pocket, the area between the 61.8% and 65% Fibonacci retracement levels, lies between 1.15407 and 1.15441. This zone is widely respected among traders due to its tendency to act as a reversal point in trending markets. The fact that it aligns so closely with both the 15-minute and 1-hour FVGs increases the likelihood of price reacting here. If the market retraces into this pocket, we could see renewed selling pressure, making it a valuable level to watch for short entries.
Point of Interest and Liquidity Zone
Within the latest leg down, there was a brief two-hour consolidation before the pair continued lower, leaving behind a distinct wick to the upside. This area is significant because it likely represents a point of interest where buy-side liquidity was grabbed. Many traders who entered shorts early may have placed their stop-losses above this consolidation high, creating a liquidity pool. This level, sitting inside the broader resistance zone formed by the FVGs and the Golden Pocket, adds another layer of technical significance. Price may move into this liquidity before reversing lower, offering a potential trap for buyers and an opportunity for sellers.
Downside Targets
If the price reacts to the resistance zone and resumes its downward movement, there are two logical targets to the downside. The first is 1.1485, which corresponds to the most recent swing low. The second target is 1.1475, which represents a deeper low and a stronger potential support level. These levels align with previous structure and could serve as key take-profit zones for traders holding short positions.
Conclusion
The EUR/USD remains in a well-defined downtrend, and several technical elements now converge between 1.15400 and 1.15600 to form a strong resistance zone. This area includes the 15-minute Fair Value Gap, the 1-hour Fair Value Gap, the Golden Pocket Fibonacci retracement, and a significant point of interest tied to liquidity. While the pair may not need to reach this zone before continuing lower, if it does, it is likely to act as a barrier to further upside. For traders looking to follow the dominant trend, this high-confluence area offers a potential entry point to the downside, with clear structure-based targets below.
Disclosure: I am part of Trade Nation's Influencer program and receive a monthly fee for using their TradingView charts in my analysis.
Thanks for your support.
- Make sure to follow me so you don't miss out on the next analysis!
- Drop a like and leave a comment!

Bitcoin - Trend Shift Confirmed, Eyes on $102.8K LiquidityMarket Context
Bitcoin showed signs of exhaustion after a strong short-term rally within a clean upward channel on the 1H chart. Price action had been respecting the trend structure until a key deviation occurred near $108,500, where we saw an internal liquidity sweep that hinted at potential distribution.
Fake-Out Confirmation and Shift in Momentum
After taking out local highs around $108.5K, price failed to continue higher and instead reversed sharply, confirming the sweep as a classic fake-out. This kind of internal liquidity grab is typically used to trap breakout buyers before reversing and targeting previous lows.
Break of Structure and Channel Retest
The rising channel was broken convincingly, and price has now retested the underside of the channel, aligning with the 50% equilibrium of the entire high-to-low range. This reinforces the bearish bias and suggests the market has likely shifted from accumulation to distribution.
Downside Targets and Key Levels
Immediate support sits around $104.6K, which served as a consolidation base during the earlier run-up. If this level fails to hold, the next key target would be a sweep of the previous significant low at $102.8K. This area is marked as a point of interest and could offer a reaction or reversal.
Price Expectations and Trade Outlook
As long as price remains below the broken channel and under $107K, the bearish scenario remains in play. I’m watching for bearish continuation into $104.6K first, and a potential full sweep toward $102.8K if that support fails.
Conclusion
The internal sweep followed by impulsive rejection, combined with a clear channel breakdown and retest, shifts the bias to bearish. A move into the $104.6K region seems probable, with a lower liquidity target at $102.8K in sight if downside pressure accelerates.
Disclosure: I am part of Trade Nation's Influencer program and receive a monthly fee for using their TradingView charts in my analysis.
___________________________________
Thanks for your support!
If you found this idea helpful or learned something new, drop a like 👍 and leave a comment, I’d love to hear your thoughts! 🚀

USDCAD SHORT IDEA- USDCAD Is EXTREMELY WEAK AND READY FOR SELLOANDA:USDCAD USDCAD Is extremely weak I expect price to drop hard from here.
TRADE BREAKDOWN
Weekly Trend is Bearish.
Daily Trend is Bearish.
4H Trend is also Bearish.
This is 100% a trend following strategy trade.
The entry is taken on 4H time frame targeting the recent weekly swing low.
This is a 4RR Trade.

ETH Short – Smart Money Setup | 17.06 🔍 Context:
After a strong dump on ETH, clearly visible on the 1H chart (left side of image), I waited for a retrace into the Fair Value Gap (FVG) zone — typical Smart Money behavior. That’s where I started looking for a short setup.
🎯 Entry Logic:
Now here's the part I’d love to discuss with you.
The classic and maybe "cleanest" approach would be to wait for a market structure break on a lower timeframe and then enter on the continuation, targeting rejection zones visible again on the 1H.
But…
Lately, I’ve been taking entries directly from FVG, even before the break, if another FVG forms on the lower timeframe inside the higher timeframe zone. That’s what happened here — I saw a second FVG form in the key area, and took the short from that.
Sometimes I even treat two FVGs in the same direction (on the same or different timeframes) as a valid entry point on their own.
🤔 Question to the community:
How do you usually approach this?
Do you wait for confirmation/structure break on the lower TF before entering, or do you also go straight from the FVG if the zone is respected well enough?
Would love to hear how others manage similar setups.

US100 – Eyes on $22,040 as bulls take chargeIntroduction
The US100 is currently showing signs of a bullish breakout, moving above the boundaries of a previously established parallel channel. It is now approaching an important area of imbalance, known as a Fair Value Gap (FVG), on the 4-hour chart. If the index manages to break through this zone, there is a strong potential for continued upward momentum. Let’s take a closer look at the technical setup and what might come next.
Parallel Channel
For some time, the US100 had been trading within a downward-sloping parallel channel, consistently making lower highs and lower lows. However, today's price action has changed that narrative. The index has broken out of the channel to the upside and is currently pushing towards new short-term highs, which could mark the beginning of a bullish trend reversal.
4-Hour Fair Value Gap (FVG)
The current focus is on an open 4-hour FVG that ranges from approximately 21,840 to 21,870. This zone could serve as a significant resistance level, potentially rejecting further upward movement. However, if the US100 breaks decisively above this range, it could open the door for a rapid push toward previous highs. Such a move would signal strong bullish momentum and confirm the breakout as legitimate.
Possibility of a False Breakout
There is always the risk that this breakout could turn out to be a false move. If the US100 fails to hold above the 4-hour FVG and reverses back below the channel breakout point, it could indicate a bull trap. In that case, the index may resume its downward trend. Still, based on the current momentum and market structure, this scenario seems less likely at the moment.
Upside Target
If the breakout above the FVG is successful, the next significant target lies at the recent highs near 22,040. This level is expected to act as strong resistance. Should the US100 manage to break through it, we could see a test of the all-time high in the near future. However, it’s important to approach the market with patience and let each level confirm itself before expecting further upside.
Conclusion
While the US100 has successfully broken out of its parallel channel, it is now facing a key test at the 4-hour FVG. A clean break above this zone would likely shift market sentiment to bullish and set the stage for a move toward 22,040 and potentially beyond. Until then, traders should watch closely for confirmation and be mindful of the possibility of a pullback.
Disclosure: I am part of Trade Nation's Influencer program and receive a monthly fee for using their TradingView charts in my analysis.
Thanks for your support.
- Make sure to follow me so you don't miss out on the next analysis!
- Drop a like and leave a comment!

EurUsd Daily Profile and expectation for New YorkMy Monday Protocol normally is to sit on my hands and see how Monday prints and trade from Tuesday onwards. With FOMC coming Wednesday, I'm allowed to deviate from this because Monday can be trending to "get somewhere in a hurry", trap Traders and go the other way during FOMC.
When I now look at the Market I see that London kept Asia Lows in tact and expanded higher leaving Failure Swings. Now consolidating which is normally a continuation signature... But then it should first sweep the consolidation Low and make a Reversal Signature. When we sweep or run the Consolidation High first, then the Long idea is not valid anymore.
Im watching the FVG below and see how we trade there and then decide if a Long is in play... I don't want to lose the Equilibruim Level of London Session otherwise the Failure Swings below the Market are the target.
Bottom Line, no hard Bias because its Monday. Favoring the Bullish side with FOMC on the Agenda this week, but not in a hurry to trade.
Hope you appreciate my content 👍
Happy Hunting, Stay Safe!
Warm Regards,
Mariinus

US100 - Trading within a bearish parallel channel!Introduction
The US100 is currently trading within a well-defined parallel channel to the downside, consistently finding support along the lower trendline and facing resistance near the upper boundary. This structure has led to a clear pattern of lower lows and lower highs on the 1H timeframe. Most recently, price action broke market structure, and we now anticipate a reaction near a high-confluence resistance area.
Parallel Channel
A distinct parallel channel has been developing on the US100 over the past several days on the 1H timeframe. During last night's move, the price touched the lower boundary of the channel and has been trending upward since. After breaking above the midline at $21,640, momentum suggests a potential continuation toward the upper boundary of the channel around $21,830.
FVG
During the most recent downward move, the US100 created a significant 1H Fair Value Gap (FVG), stretching from $21,775 to $21,840. This zone represents a key imbalance that could generate a strong reaction to the downside if price revisits it.
Conclusion
Given the break in structure on the 1H timeframe, short-term upward moves are likely to face resistance. The confluence between the upper boundary of the parallel channel and the 1H FVG creates a high-probability area for price rejection, making it a critical level to watch for potential downside pressure.
Disclosure: I am part of Trade Nation's Influencer program and receive a monthly fee for using their TradingView charts in my analysis.
Thanks for your support.
- Make sure to follow me so you don't miss out on the next analysis!
- Drop a like and leave a comment!

Bearish Gold ideaThe idea is somehow risky due to geopolitical tensions in the middle east conflict, but it could still play out for short first then bullish to a new all time high.

Bitcoin - Bears vs Bulls: $100k next?Price recently tapped into a well-defined 4H and daily resistance zone and was met with an immediate rejection. That rejection wasn’t just a reaction, it led to a confirmed market structure shift as price broke the previous low. This transition from higher highs to a lower low signals the first sign of bearish control, flipping the short-term bias and setting the tone for a move lower.
Retest of MSS and Inversion Fair Value Gap
After the break in structure, price retraced directly into the origin of the move, retesting the same zone where the shift occurred. A previously bullish 4H gap has now flipped into resistance, rejecting price perfectly. This inversion, where a bullish imbalance turns into a bearish reaction zone, confirms the change in direction and strengthens the downside narrative.
New FVG as Entry Opportunity
The latest bearish impulse created a clean new fair value gap just above current price. A retest of this gap would offer a high-probability continuation setup, as it aligns with both recent structure and order flow. This zone becomes the critical level for bears to defend, and unless price reclaims it, the expectation remains for continuation toward lower liquidity.
Liquidity Outlook and Bearish Target
Below current price, a large pool of liquidity is sitting just above a major psychological round number. That level hasn’t been swept yet and is a likely downside magnet. With no meaningful support between the current FVG and that draw on liquidity, price is likely to reach for it next. This fits the typical sequence following a market structure shift: rejection, shift, retest, continuation, and liquidity sweep.
Momentum and Contextual Confluence
Zooming out slightly, the current move fits within broader bearish momentum that has been developing across timeframes. There’s no sign of strong bullish absorption, and each push higher has been met with efficient selling. This isn’t a chaotic breakdown, but a controlled sequence of lower highs and lower lows, supported by clean structural shifts and consistent rejection zones.
Conclusion
The chart tells a clear story. A clean rejection from a key resistance zone led to a confirmed bearish structure shift, followed by a textbook retest and fresh fair value gap. As long as price remains below that gap, the setup favors continuation lower, with the nearest liquidity pool being the most likely draw. This remains a high-probability bearish scenario until proven otherwise by a shift back above invalidation levels.
___________________________________
Thanks for your support!
If you found this idea helpful or learned something new, drop a like 👍 and leave a comment, I’d love to hear your thoughts! 🚀

GBPJPY Short then Long to 198.000Looking to take an intraday short depending on PA and opening of market then looking for the long setup to 198.00.

Stuck in the Zone: DXY Tests Balance Between 98 and 99Hello Traders,
After a sharp and uninterrupted decline in the DXY, price found support at the 97.921 level. Sellers then regained control from the weekly bearish Fair Value Gap (W-FVG), pushing price back into the 99 zone.
In this zone, neither sellers nor buyers have managed to assert dominance—suggesting that these levels may act as a pause or balance point. Given the extended drop, a temporary correction could follow if buyers gain traction after one last push.
For now, the bearish USD narrative remains intact. With upcoming catalysts like China/US talks and tomorrow’s CPI release, a renewed move toward 98 is likely to accelerate.
Whether this leads to further selling or a corrective phase will be assessed afterward.

EUR/USD - Daily highs taken, now what?Introduction
The EUR/USD made a strong move higher today, establishing a clear uptrend on the 4-hour chart. With this latest push, it swept the daily liquidity above the previous high. The question now is whether the EUR/USD will continue moving higher or if there are opportunities for long entries at lower levels.
Liquidity Sweep
EUR/USD has taken out liquidity above the daily highs, where many stop losses are typically positioned. These stops have now been removed from the market. This area could potentially act as a support and resistance flip. However, if we see a 4-hour candle close below the previous daily high, further downside becomes likely.
Where Can We Look for Buys?
During the recent 4-hour move higher, significant progress was made. This upward movement created a daily Fair Value Gap (FVG) between $1.149 and $1.145. This FVG aligns perfectly with the golden pocket Fibonacci level, drawn from the swing low to the swing high. As a result, this zone forms a strong area of confluence for potential buy positions to target a retest of the highs.
Conclusion
Although we are currently breaking above the previous high, this move has yet to be confirmed as sustainable. Holding above this level is crucial. If a 4-hour candle closes below the previous high, it becomes likely that we will revisit the daily FVG and golden pocket Fibonacci zone.
Disclosure: I am part of Trade Nation's Influencer program and receive a monthly fee for using their TradingView charts in my analysis.
Thanks for your support.
- Make sure to follow me so you don't miss out on the next analysis!
- Drop a like and leave a comment!

NASDAQ ShortLooking for the short on Nasdaq been trading this long and short through out the week. Check the linked publications. Shouted out 22,000 before seeing the short.

Judas Swing Monday Recap – Sticking to the Plan Pays 09/06/2025In case you're new to the Judas Swing Strategy, here’s the strategy in a nutshell:
It’s a classic price manipulation strategy where the market fakes a move in one direction (the “Judas” move), usually after the 00:00–08:30 EST window, before sharply reversing. This tactic is often used by smart money to trap retail traders around key highs/lows, followed by a reversal into a Fair Value Gap (FVG) for entry confirmation.
We began Monday spotting a textbook Judas Swing on FX:EURUSD which was our first trade of the day. Price took out session lows, grabbing liquidity, then gave us a break of structure to the upside and a clean reversal into the FVG.
We entered long with our stop loss below the manipulation low. The trade moved nicely into profit and came within points of our target but just as we were anticipating a clean 1:2, price stalled and reversed aggressively, stopping us out.
Trade Outcome: Loss
Risk-Reward: -1%
Lesson: Even the most valid setups will sometimes fail
The next Judas swing setup came on $GBPUSD. Price swept the low of the zone, then gave a break of structure, with price retracing into the FVG. We entered long, placing the stop loss 10 pips below entry price.
The trade rallied hard post-entry, hitting our target with minimal drawdown
Trade Outcome: Win
Risk-Reward: +2%
This is why we take every valid setup. The win here offset the earlier FX:EURUSD loss, keeping us net even on the day at this point
The final Judas swing setup on Monday was on OANDA:AUDUSD , and it couldn’t have been cleaner. After a strong sweep of previous lows, price reversed and broke structure convincingly. An FVG formed and price retraced into it beautifully.
We entered long, placing the stop below the liquidity sweep. Price then rallied steadily throughout the session, and retraced almost hitting our stop loss but turned around and hit our 1:2 target.
Trade Outcome: Win
Risk-Reward: +2%
Despite starting the day with a loss, staying disciplined and trading all valid Judas setups left us with:
1 loss ( FX:EURUSD -1%)
2 wins ( FX:GBPUSD +2%, OANDA:AUDUSD +2%)
Net Gain: +3R
This is why a rules-based approach beats emotional trading. Stick to the process, and the edge takes care of the rest.
