Bitcoin - Will we go back to $99k?Bitcoin is showing its first real signs of weakness after an extended bullish run. The current price action around $106,700 suggests a loss of momentum, with price hovering just above a key daily low that could act as a pivot point. If this low gets taken out, it would likely mark a short-term shift in sentiment from bullish to bearish, opening the door for a deeper retracement toward key inefficiency zones that remain unfilled.
Consolidation and Liquidity Structure
After the sharp breakout in early May, price rallied aggressively with minimal pullbacks, leaving behind several imbalance zones that now act as downside magnets. The previous range high around $99,000, which acted as a strong resistance level earlier this year, has not yet been properly retested. This area aligns with a large daily imbalance, making it a highly probable target in the event of a breakdown. Currently, price is consolidating just above this previous resistance-turned-support zone, and pressure is building.
Bearish Breakdown Potential
If the current daily low breaks, it would likely trigger a flush into the $99,000 to $95,000 range, where we find that unfilled imbalance waiting to be closed. A break and acceptance below the $99,000 level could suggest deeper trouble for the bulls. In that case, the next major downside target sits around $92,000, where an even larger inefficiency from earlier in the year remains open. This level also coincides with a significant accumulation zone that could provide the next strong base of support if the market continues correcting.
Bullish Recovery Conditions
On the flip side, if Bitcoin holds this low and finds demand stepping in at current levels, we could see a local bottom form. A recovery and push back toward $108,000 or even a reattempt of the $112,000 highs would be back on the table. But for this bullish case to stay alive, the current daily low must hold. A sweep and reclaim could trap late sellers and fuel a quick reversal. However, right now, the pressure is clearly leaning to the downside unless buyers show strong intent soon.
Imbalance Zones and Key Price Areas
The most critical area to watch is the $99,000 level. It’s the confluence of an old resistance, an unfilled imbalance, and psychological round number support. If price tags this zone, we’ll need to monitor reaction closely. Weakness below $99,000 opens the door to $92,000, which is where the next higher timeframe imbalance sits. If we start accepting below $92,000, that would confirm a much more extended corrective phase is underway.
Price Target and Expectations
The primary expectation is a move into the $99,000 imbalance zone, assuming we get a clean daily low break. A bounce there would offer the first chance for a bullish reaction, but if sellers dominate, $92,000 becomes the secondary and more extreme downside target. A reclaim of $108,000 would invalidate this short-term bearish thesis and shift the focus back toward the highs.
Conclusion
All eyes are on the daily low. A clean break below it would change the tone of this market and likely initiate a short-term bearish cycle, targeting inefficiencies left behind during the rally. $99,000 is the key zone to watch first. If it holds, bulls may step back in. If not, $92,000 becomes the next target in line. For now, caution is warranted as the risk of deeper downside continues to grow.
___________________________________
Thanks for your support!
If you found this idea helpful or learned something new, drop a like 👍 and leave a comment, I’d love to hear your thoughts! 🚀
Fvg

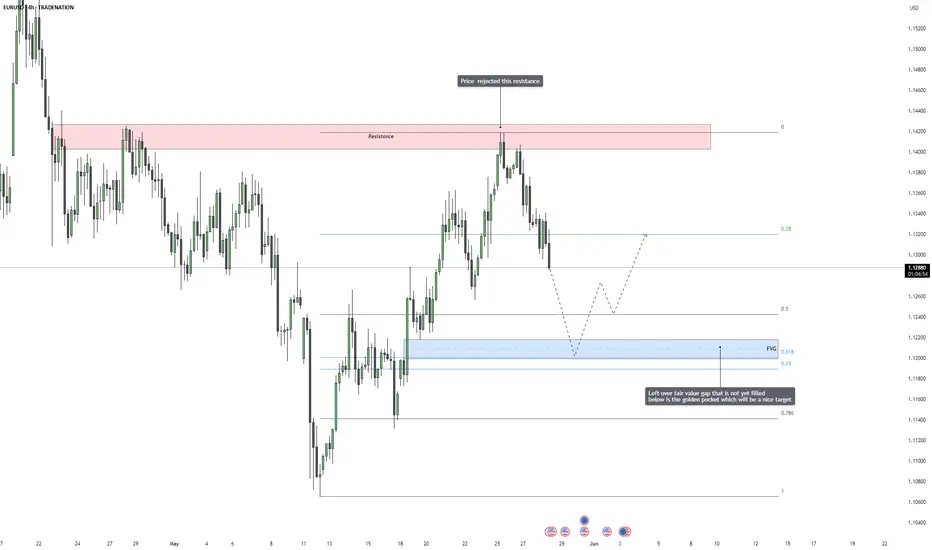
EURUSD – Bearish Reversal in Motion, Fair Value Gap Draws Price EURUSD has recently reacted strongly to a major resistance zone, where price previously stalled and reversed in the past. After running into this area again, we saw a sharp and immediate rejection, which confirms the presence of aggressive selling pressure. This rejection was not just a weak pullback, but a strong displacement candle that shows real intent from institutional participants.
This kind of price action is typically a sign that the market has found a short-term top, and will now look to rebalance lower, especially if there are inefficiencies left behind during the last move up. With the rejection now confirmed and price starting to rotate lower, the odds increase that we see a deeper retracement in the coming sessions.
Resistance Reaction and Liquidity Story
The price reached into a well-defined supply area and rejected cleanly. This level was likely filled with buy-side liquidity from breakout traders and late longs, which institutions needed in order to fill their sell orders. After sweeping above the previous highs and triggering breakout entries, price snapped back below, creating a shift in short-term structure.
That move also created a market imbalance, a price inefficiency that the market tends to come back and correct. With bullish liquidity absorbed at the highs, price is now looking for sell-side liquidity, which can typically be found below the previous higher lows and inside unfilled value areas.
Fair Value Gap and Fibonacci Confluence
Below the current market, we have a clean fair value gap that was left behind during the most recent impulsive bullish move. What makes this area even more attractive is that it overlaps perfectly with the golden pocket zone, the 0.618 to 0.65 Fibonacci retracement level. This confluence creates a high-probability target area, not just because of the imbalance, but also because this level acts as a common retracement zone where institutional traders often look to reaccumulate or exit short-term positions.
This area is also likely to hold resting liquidity from traders who placed stop losses under recent higher lows. All these factors combined make the fair value gap plus golden pocket area a natural draw for price, the market tends to gravitate toward these zones when there’s unfinished business left behind.
Expectations and Potential Development
Going forward, I expect price to continue bleeding lower in a controlled fashion, possibly forming minor lower highs along the way. Once the fair value gap is reached and filled, we could see signs of support or accumulation, depending on the context at the time. It’s important not to blindly long from that area, but instead wait for a market reaction, ideally a shift in structure on the lower timeframes, to signal that buyers are stepping back in.
If the market holds that area and confirms support, it could launch a new leg higher. However, if the fair value gap fails and price continues to break down, it would signal that this move is not just a retracement but possibly the start of a larger bearish leg.
Conclusion
The rejection from resistance has opened the door for a deeper retracement. With a clear fair value gap and Fibonacci golden pocket below, the market now has a logical destination to correct toward. This level offers a clean narrative for continuation lower, and it aligns with both price action structure and algorithmic models. Patience is key now, the best opportunities come when price delivers into clean zones like this one.
Disclosure: I am part of Trade Nation's Influencer program and receive a monthly fee for using their TradingView charts in my analysis.
___________________________________
Thanks for your support!
If you found this idea helpful or learned something new, drop a like 👍 and leave a comment, I’d love to hear your thoughts! 🚀
NQM2025 outlook for the week ahead 05/19/2025Hello World.
for the week ahead i have a bullish bias im looking to target the bearish fvg created on mon 24 feb 2025 ( daily TF) i expect the fvg formed on tue 13may2025 (Daily TF) reject the price higher, if the bullish fvg didnt hold maybe we will se a drop to the V.I bellow.
i will give updates

AUDJPY Short Setup – Fair Value Gap + 61.8% Precision Tap📊 AUDJPY | 1H Bearish Setup Breakdown (SMC Perspective)
This is a clean setup for sniper traders 🧠 — a perfect blend of FVG, Fib retracement, and a reaction from Smart Money zones. Let’s dig in:
🔻 1. Macro Context: Bearish Bias
Market structure is still bearish, with lower highs and lows
Price just completed a correction phase
We're seeing price react at a high probability distribution zone
🟪 2. Confluence Zones: FVG + Fib
📌 Fair Value Gap (FVG) – Price has just tapped into the FVG between 92.92 and 93.12
📌 61.8% Fib Level – Price perfectly aligns with golden pocket zone
📌 OB Above – Strong bearish order block lies around 93.60, with a Strong High marking retail’s target stop area
This stack of confluences makes this zone ripe for a short entry.
💣 3. Entry Logic
Entry was triggered after a clean tap into the FVG zone
Price shows signs of rejection with long upper wicks and slowing momentum
Ideal Smart Money scenario: Price mitigates FVG, avoids OB sweep (for now), and targets internal liquidity
🎯 4. Target Zone
TP = 91.651
Clean equal lows and imbalance just above
Channel midpoint & liquidity resting below
Matches 0% Fib level on the move
⚖️ 5. Trade Setup
📍 Entry: 92.926
🔐 Stop Loss: ~93.390 (above FVG + structural high)
🎯 Target: 91.651
🧮 Risk-to-Reward Ratio: ~1:4.5+
🧠 Smart Money Flow
Retail longs are eyeing a break above that “Strong High” — but Smart Money will likely:
Tap into FVG
Drive price down for a liquidity grab
Possibly retest or sweep OB after internal liquidity is cleared
💬 Drop “FVG ZONE SNIPED 🧨” if you took the entry
🧠 Save this post to study FVG + Fib reactions
👀 Tag your trading buddy who needs to level up their confluence game

BTCUSD Up trend bullish fvg filled strong buy now📈 BITSTAMP:BTCUSD 30-Min Chart Update
🔹 Trend: Bullish continuation
🔹 Entry Zone: Support at 108,500
🔹 Target: 110,500
🔹 Key Level: FVG fill expected at 108,900
Bitcoin is maintaining strong bullish momentum on the 30-minute timeframe. Price is currently pulling back into the 108,500 support zone, offering a potential long entry. Watch for a reaction near the Fair Value Gap (FVG) at 108,900, which could act as a launchpad toward the 110,500 target.
📊 Strategy: Wait for bullish confirmation (e.g., bullish engulfing or strong volume spike) before entering long. Manage risk accordingly.
#Bitcoin #CryptoTrading #PriceAction #TechnicalAnalysis #BTC

Bitcoin - Bulls in Control $113k Next targetBitcoin just delivered a textbook bullish reaction following a decisive liquidity sweep beneath the 4H range lows. Instead of continuing lower or entering a consolidation phase, price responded with immediate strength, snapping back with velocity, reclaiming structural levels, and rejecting decisively from a key Fair Value Gap (FVG). This kind of aggressive post-sweep price action usually signals the end of a stop hunt and the beginning of a new directional leg, which, given the current structure, is leaning heavily to the upside.
This is not just a random bounce, it’s a clear shift in intent. The behavior we’re seeing reflects a strategic move by smart money: first clear out liquidity from trapped longs and eager breakout sellers, then reverse and defend key zones that align with institutional discount pricing. The result? A bullish narrative that looks ready to drive price significantly higher.
Liquidity Sweep and FVG Reclaim
The initial sharp drive lower ran through the 4H lows, which had built up significant liquidity from both early long entries and breakout traders looking for continuation. This kind of move is engineered, designed to clean the board before a major shift. Price wicked deep into a 4H Fair Value Gap and immediately snapped back above it, closing strong and leaving behind a long lower wick. That reaction tells a story: there was demand waiting, and it stepped in with authority.
The Fair Value Gap wasn't just tested, it was respected. The fact that price closed back above the gap, after wicking through it, confirms it wasn't simply a liquidity grab but also a moment of rebalancing. The imbalance created earlier was filled efficiently, and the market moved on. That combination of liquidity sweep, deep FVG test, and bullish close is often what marks the end of manipulation and the beginning of a true move. It's a clear signal of smart money stepping in and defending value.
Structural Shift and Accumulation Signal
Following the sweep, the structure shifted rapidly. Price reclaimed the previous 4H support base that had been broken during the stop hunt, invalidating the bearish continuation thesis and instead suggesting accumulation. This is classic behavior after a manipulation low, price doesn’t hesitate or consolidate much, it simply turns with strength.
We’re also seeing signs of absorption and accumulation, particularly in the way price rejected cleanly from discount levels and stabilized within the FVG range. Multiple attempts to break down have failed, and the bounce wasn’t just reactive, it came with commitment. With each retest of the 110.3K resistance, that level weakens structurally. What began as resistance is now showing signs of turning into a launchpad.
If this is indeed the final leg of an accumulation phase, we should expect a marked expansion soon. The setup aligns with smart money accumulation logic: sweep liquidity, shift structure, trap shorts, and then displace with force.
Price Targets and Expectations
The 110.3K level remains the most immediate point of interest. It has acted as resistance multiple times, but each rejection has grown weaker. If price clears this level with conviction, ideally through a sharp displacement candle, the breakout has legs. Above that, we enter clean air with little resistance overhead.
The next logical target becomes 113K, which aligns both psychologically and technically with the next liquidity cluster. It’s an untested zone and represents the next area where sellers might appear. However, given the strength of the reversal and lack of major supply between 110.3K and 113K, price could move swiftly once the breakout is confirmed.
Longer-term, if momentum holds and Bitcoin maintains strength above 110.3K, we could see a retest of the all-time highs come into focus sooner than expected. But for now, the priority is to monitor how price interacts with 110.3K and look for signs of breakout strength or failed move traps.
Conclusion
Bitcoin isn’t in a boring range or slow grind, it just executed a classic liquidity play: sweep, react, reclaim. The reaction off the 1H Fair Value Gap that followed the 4H sweep is a strong signal that the market has shifted gears. With clear signs of demand stepping in and structure now favoring the bulls, the 110.3K level looks increasingly vulnerable. If that breaks, the path toward higher prices, including 113K and beyond, opens up fast.
The overall context has shifted from consolidation to directional expansion, and everything about the recent move points toward the bulls regaining control. Keep your eyes on the structure, the volume, and the displacement above key levels, the next leg could be explosive.
___________________________________
Thanks for your support!
If you found this idea helpful or learned something new, drop a like 👍 and leave a comment, I’d love to hear your thoughts! 🚀

Bitcoin – Possible 4h Sweep at 106.5kBitcoin recently printed a sharp rejection after revisiting a key supply area formed by a 4H fair value gap, overlapping perfectly with the golden pocket zone from the most recent down move. This confluence provided a strong technical ceiling, causing a clear reaction and shifting short-term sentiment to the downside. The rejection was sharp and clean, leaving behind an upper wick that signals strong selling interest. From here, price appears to be in search of support, and our eyes are now locked on the 4H imbalance around the 108.2k level, which could serve as a key pivot for the next directional move.
Consolidation and Confluence Structure
This recent move isn’t just a random drop. We’ve built a range around this resistance zone, with multiple failed attempts to break higher, followed by a clear rejection from inside the 4H FVG and golden pocket. This kind of structure usually tells us two things: first, buyers are struggling to break through strong institutional resistance, and second, there’s still liquidity left below that the market may want to sweep before any continuation higher. This is where the FVG at 108.2k and the PDL around 106.5k come into play. Both zones are clean, visible, and highly likely to draw price if the current level doesn’t hold.
Fair Value Gap Reaction Potential
The 108.2k zone is where the first major reaction could occur. It marks a fresh 4H imbalance created during the impulsive move upward, and price is now backfilling that inefficiency. If buyers step in here, respecting this imbalance as a demand zone, we could easily see a rotation back up toward 110.2k and eventually a retest of the upper resistance band near 111k. This would be a typical FVG play: price rebalances into the gap, finds demand, and continues higher.
Failure Scenario and Liquidity Sweep Setup
If the 108.2k FVG fails to hold as support, the next target becomes much more obvious, the previous day’s low at 106.5k. That level is also a 4H swing low, making it a prime liquidity draw. A move below that low would allow price to collect sell-side liquidity, sweep out late longs, and potentially trap breakout traders expecting further downside. If this level is swept cleanly and followed by bullish displacement, it could offer a high-probability long entry from the discount zone. The risk-reward from this setup would be ideal, especially if we reclaim 108.2k afterward.
Market Context and Higher Timeframe Bias
Zooming out, the structure remains bullish on higher timeframes, but this local rejection is a necessary reset. It’s a shakeout that allows price to reprice into demand and generate momentum for the next leg up. This kind of behavior is typical in trending markets, corrective moves that dig into inefficiencies, hunt liquidity, and then reestablish the trend. As long as we don’t see sustained closes below 106k, the bias remains tilted toward continuation to the upside, with current price action offering a potential entry opportunity.
Price Target and Expectations
If we hold the 108.2k zone, my first short-term target is the 110.2k structure high, followed by the upper resistance area around 111k where the initial rejection occurred. A reclaim of that zone opens the door to expansion toward 112k. If instead we sweep the PDL and bounce from 106.5k, the first target would be a retrace into the 108.2k imbalance, with the next leg aiming for the same resistance range. Either path sets up a long opportunity from areas of value.
Conclusion
Bitcoin is at an important decision point. The rejection from the 4H FVG and golden pocket confirms strong resistance, and price is now seeking support lower. The 108.2k FVG is a critical zone, a hold here gives us a clean continuation setup, while a failure could lead to a deeper liquidity sweep toward 106.5k. Either scenario offers high-quality trade potential as long as we stay disciplined and wait for confirmation from price action. Patience is key, but both levels present opportunities to position long from areas where smart money typically steps in.
___________________________________
Thanks for your support!
If you found this idea helpful or learned something new, drop a like 👍 and leave a comment, I’d love to hear your thoughts! 🚀

Bitcoin - Waiting for a clear breakout!About an hour ago, Bitcoin (BTC) managed to fully fill the 1-hour Fair Value Gap (FVG). After touching the upper boundary of this gap, the price reacted sharply and quickly reversed, which resulted in the formation of a Swing Failure Pattern (SFP).
What is a SFP?
A Swing Failure Pattern, or SFP, occurs when the price briefly moves above a previous high but fails to sustain that move. In this scenario, the price only sweeps above the previous high with a wick, but the candle does not close above it. This often signals that buyers could not maintain control, and it can lead to a reversal or a loss of momentum.
Narrow range
Currently, BTC is trading within a narrow range between 106,600 and 110,600. Within this range, the price is moving up and down without breaking out in either direction. On the 1-hour chart, BTC respected the FVG a few hours ago, which suggests that bullish momentum might still have a chance to develop.
Bullish breakout
For a bullish breakout, we would want to see BTC break above 111,000 with strong buying momentum. If this happens, the price could turn the current resistance into new support and potentially make a move toward the all-time high (ATH).
Bearish breakout
On the other hand, a bearish breakout would require the price to close below 106,600 with significant volume. If BTC closes below this level, the support could turn into resistance, and a drop toward 100,000 would become a real possibility.
Conclusion
In my view, BTC showed strength by holding the 1-hour FVG, but after the latest move upward, it failed to break through resistance and instead formed a SFP. Because of this, I expect a pullback toward 108,000 or even 106,000. At this stage, it’s best to be patient and wait for a clear breakout in either direction before making any major trading decisions. If you want to protect your capital, it’s wise to wait for confirmation before entering a new position.
Thanks for your support.
- Make sure to follow me so you don't miss out on the next analysis!
- Drop a like and leave a comment!

LINKUSDT: Inverse Head & Shoulders Breakout! The Reversal BeginsBINANCE:LINKUSDT has broken out of a classic inverse head and shoulders pattern — a well-known bullish reversal formation. After the breakout, price action showed strength by coming back to retest the neckline support and holding it successfully. This confirms the pattern and signals a potential shift in trend.
From a technical perspective, this setup is highly promising. The market structure indicates a likely reversal after an extended downtrend, and the breakout could be the start of a strong bullish phase. With solid fundamentals backing BIST:LINK , the rally could gain serious momentum once it gets going.
This pattern isn’t just any breakout — it’s a reversal of the reversal, a major turning point in trend. If bulls take control, this move has the potential to accelerate rapidly. However, it’s crucial to always manage risk, use a well-placed stop-loss, and avoid overexposure.
Get ready — once the rally starts, it might be unstoppable!
BINANCE:LINKUSDT Currently trading at $15.5
Buy level : Above $15
Stop loss : Below $13
Target 1: $17
Target 2: $1.4
Target 3: $2.1
Max leverage 3x
Always keep stop loss
Follow Our Tradingview Account for More Technical Analysis Updates, | Like, Share and Comment Your thoughts

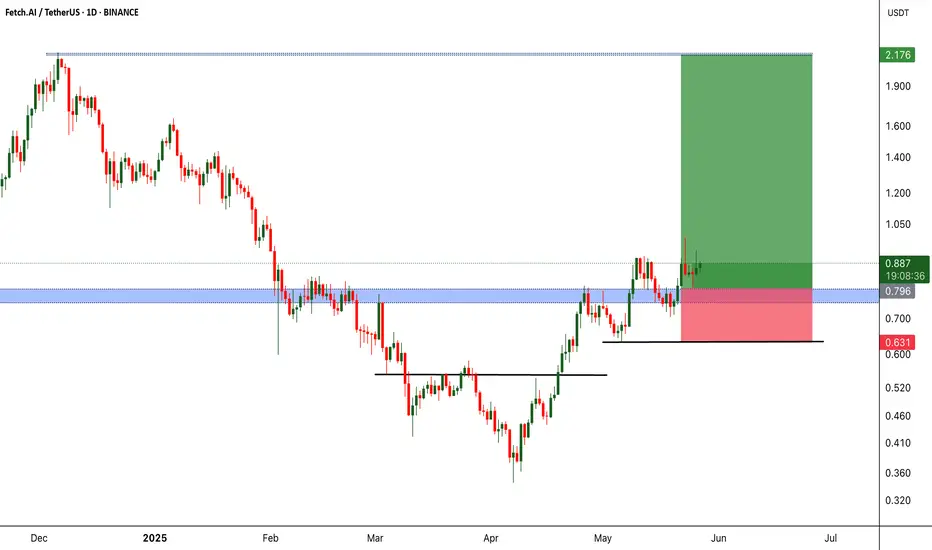
FETUSDT Major Resistance Cracked, Eyes on Sky!BINANCE:FETUSDT has recently broken out from a significant resistance level that previously acted as a strong barrier. After this breakout, the price action displayed a textbook retest of the former resistance—now turned support which held firm, confirming the bullish move.
This successful retracement signals strength in the current uptrend and opens the door for potential continuation towards higher highs. The market structure is showing signs of higher lows and increasing momentum, which could fuel a strong rally in the near term.
While the setup looks promising, it’s essential to emphasize risk management. Always use a stop-loss to protect your capital and manage your position sizing according to your trading plan. The crypto market can be volatile, and smart risk control separates long-term winners from short-term chasers.
All eyes are now on NYSE:FET for its next move. If momentum continues, we could witness a significant upward leg. Stay sharp and let the trend be your guide!
BINANCE:FETUSDT Currently trading at $0.88
Buy level : Above $0.8
Stop loss : Below $0.63
Target 1: $1.1
Target 2: $1.4
Target 3: $2.1
Max leverage 3x
Always keep stop loss
Follow Our Tradingview Account for More Technical Analysis Updates, | Like, Share and Comment Your thoughts
Fair Value Gap (FVG) in Crypto: The Complete Guide🔸Introduction:
In financial markets in general—and the crypto market in particular—understanding market liquidity and imbalance zones is essential for building successful trading strategies. One of the most prominent modern price analysis concepts, especially within the Smart Money Concepts (SMC) framework, is the Fair Value Gap (FVG). This refers to a price imbalance between buyers and sellers.
🔸What is the Fair Value Gap (FVG)?
A Fair Value Gap is an area on the price chart that shows an imbalance between supply and demand. It occurs when the price moves rapidly in one direction without being fairly traded within a balanced price range. This usually happens due to the entry of large players or “smart money,” creating a gap between three consecutive candlesticks on the chart.
Classic Bullish FVG Setup:
Candle 1: A bearish or neutral candle.
Candle 2: A strong bullish candle (usually large).
Candle 3: A bullish or neutral candle.
🔸Where is the Gap?
The gap lies between the high of candle 1 and the low of candle 3.
If candle 3 does not touch the high of candle 1, an unfilled price gap (FVG) is present.
🔸How is FVG Used in Market Analysis?
Traders use Fair Value Gaps as potential areas for:
Entering trades when the price returns to retest the gap.
Identifying zones of institutional interest.
Setting potential targets for price movement.
🔸Common Scenario:
If a strong bullish candle creates a Fair Value Gap, the price often returns later to retest that gap before continuing its upward movement.
The gap can be considered "delayed demand" or "delayed supply".
🔸🔸Types of FVG:🔸🔸
🔸Bullish FVG:
Indicates strong buying pressure.
The price is expected to return to the gap, then bounce upwards.
🔸Bearish FVG:
Indicates strong selling pressure.
The price is expected to return to the gap, then continue downward.
🔸Relationship Between FVG and Liquidity:
Fair Value Gaps are often linked to untapped liquidity zones, where buy or sell orders have not yet been fulfilled. When the price returns to these areas:
Institutional orders are activated.
The price is pushed again in the primary direction.
🔸How to Trade Using FVG (Simple Entry Plan):
Steps:
Identify the overall trend (bullish or bearish).
Observe the formation of an FVG in the same direction.
Wait for the price to return and test the gap.
Look for entry confirmation (like a reversal candle or a supporting indicator).
Set your stop loss below or above the gap.
Take profit at a previous structure level or the next FVG.
🔸🔸Real-World Examples (Simplified):🔸🔸
🔸Bullish Example:
A strong bullish candle appears on BTC/USD.
A gap forms between $74K and $80K.
The price rises to $108K, then returns to 74K$ (inside the gap).
From there, it begins to rise again.
🔸Important Tips When Using FVG:
Don’t rely on FVGs alone—combine them with:
-Market Structure.
-Support and resistance zones.
-Confirmation indicators like RSI or Volume Profile.
-Best used on higher timeframes (15m, 1H, 4H, Daily).
-The gap can be filled the same day or after days/weeks.
🔸Conclusion
The Fair Value Gap is a powerful analytical tool used to identify zones of institutional interest. It plays a key role in the toolset of professional traders who follow smart money principles. By mastering this concept, traders can improve entry and exit timing, reduce risk, and increase their chances of success.
Best regards Ceciliones🎯

Bitcoin’s Breakout Pattern Continues – Is $120K Next?MARKETSCOM:BITCOIN Quick Update
Bitcoin is showing strong momentum — each time it accumulates, it breaks out to a new level. This "accumulate and explode" pattern has played out cleanly three times already.
Now, BTC is consolidating just under its all-time high. If this range holds, another breakout could be coming soon.
The structure remains bullish as long as price holds above the $103K zone. A clear break above ATH could send it toward $120K and beyond.

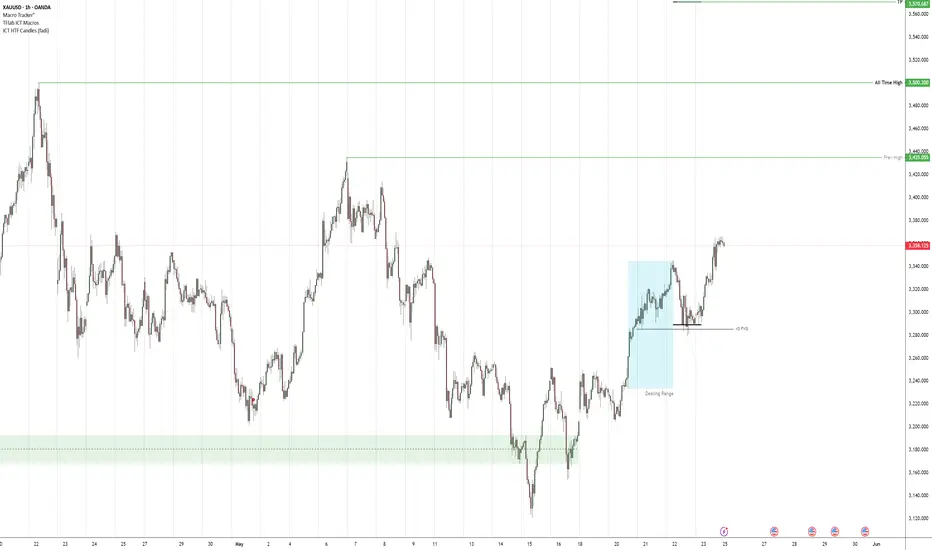
Bullish Outlook for GoldLot of reasons for me to long GOLD.
1) 3500 round number All Time High Level.
Will be probably taken out real quick.
Possibly with a NWOG gap.
2) Blue box is my focused dealing range.
Equilibrium respected and confirmed.
Take profit 1: 3570 ( 2 st. deviations)
Take profit 2: 3796 ( 4 st. deviations)
3) Daily FVG
Extremely reactive to the top quadrant of the May 20 gap.

Bullish Outlook For GOLDLot of reasons for me to long GOLD.
1) 3500 round number All Time High Level.
Will be probably taken out real quick.
Possibly with a NWOG gap.
2) Blue box is my focused dealing range.
Equilibrium respected and confirmed.
Take profit 1: 3570 ( 2 st. deviations)
Take profit 2: 3796 ( 4 st. deviations)
3) Daily FVG
Extremely reactive to the top quadrant of the May 20 gap.
Bitcoin - Bulls vs Bears: $106k or New ATH?Bitcoin saw a sharp and aggressive drop following Donald Trump’s surprise announcement of a 50% tariff on EU imports. The sudden macro shock triggered broad risk-off flows, with BTC quickly selling off from local highs near 111.3K and tapping into a key fair value gap around 107.5K. Although we’ve seen a short-term bounce since that low, it’s not a convincing bullish reversal. Momentum remains fragile, and the overall structure still favors caution as we trade within a compression zone formed post-drop.
Key Technical Zones
We’re currently trapped between two major 1H fair value gaps that serve as clear boundaries for market direction. The lower zone around 107.5K has provided temporary support, acting as a reaction point after the dump. This FVG was left behind during the early-May rally and is now being tested for the first time. On the flip side, price was rejected earlier today from the upper 1H FVG at 109.8K to 110.7K, which previously served as the base of the last breakdown candle. That rejection confirms sellers are active at that level, and it’s now acting as resistance.
We’re essentially in a deadlock between demand and supply, and the next break will determine directional bias for the next major leg.
Bullish Scenario
If bulls can reclaim the 109.8K–110.7K area with strength and close above it convincingly, that would indicate demand has absorbed the supply in that zone. Ideally, we’d want to see a clear bullish displacement to confirm strength, not just a weak grind. In that scenario, BTC could make its way back toward the previous highs and retest the higher resistance zone around 112K. This level lines up with a larger supply zone and could become a key magnet if the market shifts risk-on again or if shorts begin to unwind.
Bearish Scenario
On the flip side, if BTC fails to hold the lower FVG and breaks below 109K with a strong bearish candle or wick rejection from the upper range, it opens the door for further downside. The next target would be the clean liquidity pool near 106K, which is supported by a price inefficiency and unmitigated demand just below. This level also aligns with prior consolidation structure and would be a logical place for a deeper retracement following the news-driven shakeout.
Market Context and Decision Point
This is a compression structure formed after a high-volatility event, so it’s important not to get trapped in the middle of the range. Price is coiling between two well-defined FVGs, and whichever one gives way will likely trigger the next expansion move. Look for signs of displacement impulsive candles, clean breaks, and follow-through, to validate which side is in control. Until then, patience is key. Let price choose the path and then follow the momentum.
Price Target and Expectations
✅ Break and hold above resistance FVG → target 112K
🚩 Break and lose the support FVG → target 106K
Conclusion
Bitcoin is stuck in a tight battle between bulls and bears following a heavy news-driven drop. The current 1H FVG range offers a textbook breakout setup, with both sides clearly defined. This is not the time to force trades inside the chop. Wait for a clean break, then position for the follow-through. The resolution of this range will likely dictate direction soon, especially as the market continues to digest the macro developments.
___________________________________
Thanks for your support!
If you found this idea helpful or learned something new, drop a like 👍 and leave a comment, I’d love to hear your thoughts! 🚀

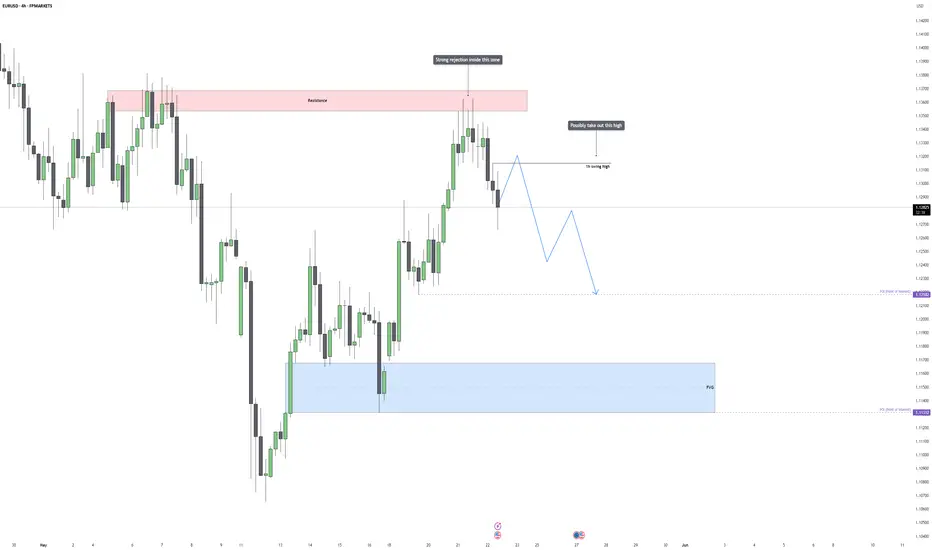
EURUSD – Bearish Outlook After Inducement and RejectionEURUSD recently delivered a sharp rejection from the 1.13700 resistance zone, a level that previously acted as a strong barrier for price. This area had already shown signs of supply in the past, and the latest reaction only strengthens the case for continued bearish interest at that level. The rejection candle was large, clean, and decisive, showing that sellers aggressively stepped in after price entered the premium zone. This shift now places focus on how price navigates lower timeframes in the short term, especially as we approach key liquidity levels and structural points of interest.
Sweep Setup and Liquidity Outlook
Despite the rejection, one notable feature left behind is a 1H swing high just under 1.13400. This high remains untapped and likely holds buy-side liquidity from breakout traders. It’s common to see price sweep such local highs before turning lower, especially after a clear rejection from a major zone like the one above. This potential inducement move, where price runs the high to gather liquidity and trap late buyers, is what I’ll be watching closely next.
The scenario I’m anticipating is a relatively short-lived push higher, just enough to clear the swing high liquidity before price shifts bearish again. This behavior fits within the broader bearish structure and could serve as the final fuel needed before a deeper move to the downside unfolds.
Key Levels and Technical Context
The first point of interest comes in at the 1.12182 level, which is marked on the chart. This level is not rando, it aligns with previous structure, sits near a micro-breaker, and is positioned just above a fair value gap. If we do get the anticipated sweep of the 1H high, this 1.12182 area becomes a highly sensitive zone where the next key reaction could occur.
What makes this POI important is that it serves as a decision point for the market. If the sweep occurs and price aggressively sells off into this level, we can start watching for continuation setups. But if price stalls or consolidates here, we’ll need to evaluate whether the bearish momentum is still intact or if a shift is occurring.
If bearish pressure continues, the next downside target is the POI around 1.11300. This level is nested cleanly inside a higher-timeframe fair value gap, and it also overlaps with a prior demand zone. From a liquidity standpoint, it’s the logical draw, resting sell-side liquidity is likely building beneath those May lows, and the market could easily target that zone once 1.12182 is breached.
Momentum, Structure, and Execution Plan
The current structure is bearish, but short-term strength is still on the table until the sweep of the 1H high plays out. I’m not interested in selling into strength just yet, I’d prefer to see the inducement leg complete, followed by signs of weakness such as bearish engulfing structures, lower timeframe market structure breaks, or clean fair value gap entries forming after the sweep.
Once price breaks below 1.12182 decisively, it opens the path toward the next liquidity pocket at 1.11300. Any signs of continuation post-rejection from that first POI would be used to look for scalable short entries with tight risk and larger reward-to-risk ratios.
Conclusion
EURUSD is setting up for a clean liquidity run above the 1H high, following a strong rejection from higher timeframe resistance. The plan is to let price run that liquidity, then look for bearish signs to engage short down toward 1.12182. If that level fails to hold and bearish pressure continues, the 1.11300 POI becomes the next logical target. The structure is lining up well for this sequence, but execution will depend on how price behaves around the key inducement and reaction zones.
___________________________________
Thanks for your support!
If you found this idea helpful or learned something new, drop a like 👍 and leave a comment, I’d love to hear your thoughts! 🚀
BTC - Can BTC push past $109k in this rising channel?Bitcoin has been trading within a clearly defined upward channel since the beginning of April. This rising channel is characterized by three touchpoints on both the upper and lower trendlines, indicating a consistent pattern of price movement within these boundaries.
Approaching key resistance
Currently, BTC is approaching a critical resistance level near the $109,000 mark, which coincides with its previous all-time high. This level represents a significant psychological and technical barrier, as it was the peak of the last major bull cycle. The price is now testing this resistance while still remaining within the rising channel. The confluence of the upper channel resistance and the historical all-time high makes this a decisive moment for Bitcoin's price action.
Bullish breakout
A rejection from this resistance zone could lead to a temporary pullback, potentially towards the lower boundary of the rising channel. This would not necessarily signal the end of the bullish trend, but rather a healthy consolidation within the established structure. However, a confirmed breakout above the $109,000 level, especially if supported by strong volume and bullish momentum, would likely signal a significant shift in market dynamics. Such a breakout would validate the strength of the current uptrend and could open the door for new all-time highs. In that scenario, the $109,000 level would likely flip from resistance to support, becoming a crucial area for bulls to defend on any future retests.
Bearish breakout
On the downside, traders should also be aware of the implications of a breakdown below the rising channel. The lower boundary of the channel, currently located around $104,000, is an important technical level to watch. A decisive break below this level could indicate a loss of short-term bullish momentum and may trigger a deeper retracement. In such a case, BTC would likely target the imbalance zone between $97,500 and $100,500, a region where price moved rapidly in the past without establishing strong support or resistance. This zone could serve as a critical area for buyers to step in and attempt to reestablish bullish control, potentially setting the stage for another rally toward the $109,000 resistance and a renewed attempt at a breakout.
Conclusion
In summary, Bitcoin is currently at a pivotal juncture. The upward channel that has guided price action since April remains intact, but BTC is now confronting a major resistance zone at its previous all-time high. Whether price breaks through to new highs or experiences a pullback will depend on the strength of market momentum and the behavior of buyers and sellers at these key levels. Traders and investors should remain vigilant and prepared for both scenarios, as the next move could set the tone for Bitcoin’s trajectory in the coming weeks.
Thanks for your support.
- Make sure to follow me so you don't miss out on the next analysis!
- Drop a like and leave a comment!

Bitcoin - History Repeating, 110k Next target?Bitcoin has been ranging tightly on the 4H chart, and the recent price behavior is starting to look very familiar. When you compare the current structure with what happened in the first week of May, there are some striking similarities. Back then, BTC consolidated in a sideways channel, faked a breakout to the upside, returned into the range briefly, tapped a demand zone, and then exploded higher into a strong rally. That move laid the groundwork for a steep continuation and fresh highs.
Right now, we’re seeing a nearly identical flow: a prolonged consolidation followed by an upside breakout, a retrace into the prior range, and a precise reaction off a Fair Value Gap (FVG). These repeat structures often hint at algorithmic behavior or institutional footprints, where similar setups trigger similar outcomes.
Structural Context and Price Behavior
The May 6th move began with a candle close above the range, a retest of the lows and FVG within the previous structure, and then an impulsive breakout that never looked back. This breakout was clean, supported by high volume and conviction. Once the retest held, price surged with minimal drawdown.
Now, we’ve just completed a similar sequence. Price closed above the consolidation range, came back in, filled the imbalance (FVG), and instantly found support. It’s also worth noting that both patterns formed after multi-day compressions, which often result in aggressive expansion phases.
What strengthens this setup is that the recent FVG fill didn’t just find support, it caused an immediate reaction to the upside. That’s a key sign that demand is active in this area and institutions may have used this as a re-entry point. From a structure standpoint, as long as we’re holding above the green zone (prior range high and FVG area), the bias remains bullish.
Liquidity Dynamics and Key Zones
The green support area acts as a clear line in the sand. It represents the upper half of the previous range and the origin of the most recent displacement. As long as price stays above this level, the idea is simple: the market is still in expansion mode. The recent wick into the zone could also be viewed as a liquidity sweep, drawing in shorts or stop losses before the real move begins.
In these kinds of setups, institutions often look for “clean-up” wicks to engineer liquidity, and BTC may have just completed that phase. Now that the liquidity grab has taken place and the imbalance is mitigated, the path of least resistance is likely to be up.
Price Target and Expectations
If history repeats, BTC could be setting up for a continuation leg that pushes toward a new all-time high. The $110,000 level makes sense both technically and psychologically. It would not only be a round number magnet but also a logical target based on the range expansion from the current structure. Once the local high breaks, momentum could accelerate quickly, especially if the market gets squeezed and forced to reprice aggressively.
A clean move toward $110,000 would also align with the broader macro narrative, as BTC continues to show resilience and trend continuation despite periods of consolidation.
Conclusion
Bitcoin is potentially repeating its early-May price structure, where a breakout, retest into a key FVG, and strong bullish reaction led to new highs. We’ve just completed a similar retest and bounce, suggesting we may now be in the early stages of a fresh impulsive move. As long as price remains above the key demand zone, this setup favors continuation, with $110,000 as the next major objective. All eyes on whether the market can break above local highs and maintain bullish momentum into uncharted territory.
___________________________________
Thanks for your support!
If you found this idea helpful or learned something new, drop a like 👍 and leave a comment, I’d love to hear your thoughts! 🚀

USDCHF Premium Tap into Order Block🚨 USDCHF Smart Money Setup Unfolding – One Shot, One Kill Opportunity
Here’s why this setup is packed with confluence and how Smart Money might be laying the perfect trap before a big drop...
🧠 Structure Breakdown:
We’re currently seeing a textbook retracement into premium pricing after a clear bearish move, and Smart Money seems ready to strike again.
✅ Swing High to Low Fib Analysis
We’ve pulled from the most recent swing high to the swing low — and price is now retracing into the 61.8%–79% golden zone. That’s classic territory for Smart Money to reposition short.
📍 Premium Trap Zone:
Between 0.8375 and 0.8395, we’re stacking multiple confluences:
Fib Golden Zone (61.8% – 79%)
Bearish Order Block
Strong High (Liquidity Pool)
Diagonal Trendline Resistance
Break of structure beneath current price
Price action is walking up cleanly, likely to attract late longs — but we know better. This is liquidity engineering at its finest. 📊
🧱 Smart Money Zones:
🔲 Order Block (OB) at ~0.8380–0.8395)
This OB aligns beautifully with 79% fib retracement and sits right below a Strong High — where liquidity is waiting to get grabbed.
🎯 Entry Logic:
Wait for a tap + bearish rejection candle inside the OB.
Set stop loss just above the Strong High.
Ride the momentum back down toward discount zones.
🎯 Target Zones:
TP1: Back to 0% fib level (~0.8325)
TP2: Extension to -27% fib (~0.8295)
TP3 (if momentum flows): Sub 0.8280 levels
This setup offers a clean 1:3+ RRR with sniper-level precision. Low risk, high reward — exactly what we love!
🧘♂️ Psychology of This Move:
Smart Money creates the illusion of bullish strength to:
Lure breakout traders above the high.
Fill institutional sell orders inside the OB.
Sweep weak lows after rebalancing inefficiencies.
This is not a random pullback — it’s a calculated liquidity sweep before expansion. 🚀
⚡ Game Plan:
✅ Wait for price to reach premium zone
✅ Look for rejection (engulfing or SMC candle confirmation)
✅ Enter with SL above high
✅ Take partials at equilibrium and trail to discount
✅ Don’t rush — let price come to you 💎
🧨 Risk Management Tip:
This is a surgical setup — you don’t need to overleverage to win.
Let the chart do the heavy lifting. Stick to 1–2% risk and let the RRR carry the profit.
✍️ In Summary:
USDCHF is retracing into a major premium zone packed with Smart Money confluence — Order Block, Fib, BOS, liquidity, and trendline resistance.
This could be one of the cleanest bearish setups this week if you stay patient and time it right.
🗣️ Drop "USDCHF READY" in the comments if you're planning to catch this setup!
📲 Tag your trading partner and don’t let them miss this sniper entry!

SOL Trade Blueprint: Waiting for the High-Conviction EntryAfter printing a SFP at the key high of $180.52 followed by a sharp -8% rejection, SOL made a second attempt to breach the major resistance zone between $180–$185 — but once again, bulls fell short. Since then, price has been in a corrective phase. So the big question is: where’s the next high-probability trade setup? Let’s zoom out and break it down.
📏 Zooming Out: Structure, FVG & Fib Confluence
Back on May 8th, SOL broke through the April 25th swing high at $157 with strong momentum, leaving behind an untested Fair Value Gap (FVG) — a key displacement area that’s yet to be filled. When we draw the Fibonacci retracement from the low of that move to the current high, the 0.618 retracement lands precisely at $157.34 — right on the old breakout high. That’s a beautiful confluence.
Timing-wise, if SOL pulls back to that level between May 21–22, the 0.75 Fib speed fan also kicks in — adding dynamic trendline support to the static Fib level.
📉 What About the $164 Golden Pocket?
There's a golden pocket forming around $164 from a recent mini-impulse, and while it may look tempting, context matters. This pocket isn't supported by enough confluence — no major structure, volume shelf, or EMA alignment. For a quick scalp? Yes. But for a high-conviction swing? It's not ideal.
Remember, in trading we're not here to chase every candle — we're here to wait for the setups that stack the most reasons to say yes.
📍 The Zone to Watch: $157
Now let’s talk about that $157 zone — and why it’s standing out as the highest-probability long setup:
0.618 Fib retracement of the major impulse
Retest of the breakout swing high
Untested Fair Value Gap (FVG)
233 EMA + 233 SMA on the 4H timeframe lining up as dynamic support
1.5 outer pitchfork support line crossing through
1:1 trend-based Fib extension confluence
Prior area of interest
This is what we call a “stacked setup.” The more layers of confluence, the more conviction we have in the trade. Add to that the potential for a liquidity sweep (SFP) just below the current low at $159.44 — and it becomes a zone worth watching closely.
🎯 Long Setup:
Entry: $157–$159.44 (watch for SFP confirmation)
Stop-Loss: Below $154
Target: $200
R:R: Approx. 1:12 — a setup worth being patient for
🧠 Educational Note: Why Confluence Is King
High-probability trades don’t come from guessing. They come from stacking confluence: structure, Fibonacci, moving averages, time-based levels, pitchforks, VWAPs, volume profiles — the more that lines up, the less you need to hope and the more you can trust your edge. Think like a sniper, not a machine gun.
The market rewards patience and precision — not noise and FOMO.
🔻 Short Setup (Alternative Play)
While we’re primarily bullish, there’s a valid short opportunity at the psychological $200 mark — but only if price shows clear rejection and confirmation (e.g. SFP, bearish engulfing, high volume reversal).
Entry: $200 rejection
Stop-Loss: Above $205
Target: $185–$180
R:R: Approx. 1:3+
🔥 Final Words: Trade With Purpose
This is what trading is about — not chasing green candles, but waiting for structure, clarity, and alignment. Whether you’re trading long or short, focus on high-conviction setups backed by logic and levels, not emotion.
Don’t trade for action. Trade for precision. The market will always reward the patient ones who are willing to wait for that clean entry, stacked with reasons to act.
Trust the process, stay disciplined, and let the charts do the talking. 💪📈
___________________________________
If you found this helpful, leave a like and comment below! Got requests for the next technical analysis? Let me know.

Gold - Small rejection before $3400?Gold has been in a clear downtrend on the 4-hour timeframe, and during one of its recent declines, it left behind a 4-hour Fair Value Gap (FVG). Price is now climbing back toward this imbalance zone, suggesting that a critical test of resistance may be approaching.
Bounce from strong support
Just a few days ago, Gold found solid footing at a strong support area, which triggered a bounce. Since then, it has been pushing higher and is now nearing the 4-hour FVG. This zone represents a significant area of imbalance left unfilled during the prior selloff, and it's highly likely that price will react once it reaches this region.
FVG and Golden Pocket
Interestingly, this FVG aligns closely with the golden pocket, which lies between 3315 and 3325. While the golden pocket sits slightly above the midpoint of the FVG, there's a good chance Gold could tap into that area before showing signs of a pullback or rejection from the FVG itself.
Target to the downside
If price fails to break above this zone and reverses, the logical target to the downside would be the 3250 level. This area has acted as a key resistance in recent sessions, and if retested from above, it could serve as a strong support base for another potential leg higher.
Target if we break above the FVG
On the other hand, if Gold manages to break cleanly through the FVG with strong volume and momentum, the path could open toward a move up to the recent highs around 3430. In that scenario, the bullish continuation would likely require sustained buying interest and increased market participation to carry through.
Thanks for your support.
- Make sure to follow me so you don't miss out on the next analysis!
- Drop a like and leave a comment!

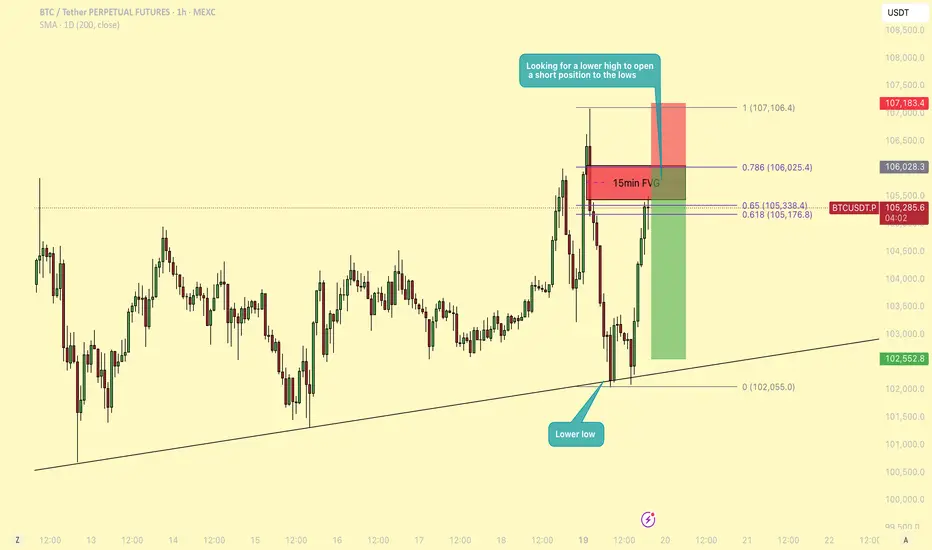
BTC - Will BTC revisit $102k or is a pump imminent?Bitcoin (BTC) has been in a consolidation phase for an extended period, marked by a lack of strong directional momentum and characterized by ranging price action. This type of market environment often leads to both liquidity grabs and choppy movement, and traders need to remain especially vigilant about key levels and structure shifts.
Liquidity grab
Yesterday, BTC managed to sweep the recent highs, grabbing liquidity above a short-term resistance zone before reversing and moving lower. This move appears to have been a classic stop-hunt or liquidity sweep, which was followed by a strong rejection. As price moved down from those highs, it left behind an unfilled gap on the 15-minute chart, what many refer to as a Fair Value Gap (FVG). This gap now acts as a magnet for price and is a key area to watch as we approach it again.
Market structure
On the 1-hour timeframe, BTC has now printed a lower low, suggesting a short-term shift in market structure to the downside. This structural break opens up the possibility for a lower high to form, setting up a classic trend continuation scenario. From a technical standpoint, the expectation would be for BTC to now create a lower high and then push lower, potentially targeting the range lows from yesterday and today. This provides an opportunity for a short setup with a favorable risk-to-reward (RR) ratio, estimated to be around 3:1, if the entry and stop are managed around the key resistance and structural levels.
Fibonaccy that aligns with the FVG
Currently, BTC is sitting at the Golden Pocket, the region between the 0.618 and 0.65 Fibonacci retracement levels. This area often serves as a reaction zone for price, and we are seeing some hesitation here. Interestingly, this Golden Pocket sits just below the aforementioned 15-minute FVG, and price appears to be gravitating toward this inefficiency, potentially looking to fill it before making a more decisive move.
What adds to the confluence at this level is the 0.786 Fibonacci retracement, which aligns almost perfectly with the top boundary of the Fair Value Gap. While many traders look to enter short positions at the 50% mark of the FVG, this added confluence makes the 0.786 + FVG top zone a more compelling entry point. This would allow for a tighter stop just above the gap or structure high, and thus improves the risk-to-reward ratio slightly compared to a more conservative FVG entry.
Conclusion
In summary, the plan would be to wait for BTC to either fill the FVG and reach the 0.786 level or show strong rejection signs there. A rejection from this zone would confirm the lower high thesis and offer a solid short setup aiming for a move back to the range low. With the current setup, market structure, and confluence levels lining up, this trade idea presents a tactical opportunity with clear invalidation and high RR potential.
Gold Urgent Update.Gold Urgent Update
Gold has recently touched its 4-hour bullish Fair Value Gap (FVG) and is now moving upward. Additionally, there is existing liquidity from previous days positioned above the current price level, which further increases the probability of a continued bullish move.
There is a high likelihood that the market could rise towards the price levels of 3250, 3260, and possibly even 3265. These levels should be closely monitored, as they represent potential short-term targets based on the current price action and market structure.
At this stage, it is advised to avoid entering any selling (short) positions unless a clear and confirmed bearish signal is observed. The market sentiment remains decisively bullish, and until any bearish reversal patterns are confirmed, the upward trend should be respected.
Please conduct your own research (DYOR) and practice proper risk management when trading towards the mentioned target levels.
