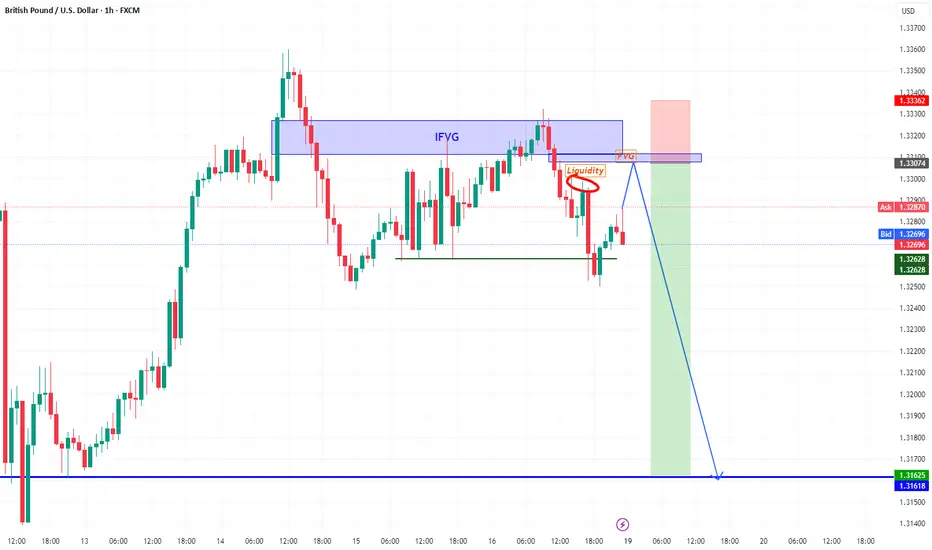
GBPUSD Bearish The main trend is down. The price rebounded from IFVG. We are waiting for a liquidity sweep and rebound from FVG.
Target 1.3162
Fvg
USDCHF bullish There's a clear descending triangle with price testing the upper resistance. A breakout is anticipated.
You can enter from FVG (Stop loss 0.83230)or wait a breakout above the triangle, then retest.
We have two targets:
-The distance from the highest point to the support line which will be at 0.8522
-Second target will be swing deal take it on weekly IFVG which will be at 0.87132

Bitcoin – Sweep the Highs, Next Target $98kMarket Overview
Bitcoin has been trading sideways for more than 8 days now, forming a tight consolidation range with no real breakout in sight. This kind of price action typically signals accumulation or distribution by larger players. While it may seem indecisive on the surface, this phase is often where the market sets its trap. What looks like inaction is actually a setup in progress. Price is compressing, volume is thinning out, and both bulls and bears are being lured in. That’s a perfect recipe for a sudden, aggressive move that wipes out one side entirely.
Liquidity Structure
The structure of this range is very clean, which in trading terms usually means dangerous. On the top side, we have a lot of liquidity, just above $105,800. This level has been tapped multiple times but never convincingly broken, and it now acts as a magnet for liquidity. On the flip side, the downside holds multiple clean lows, all clustered under the $100,000 mark. Both ends of this range are packed with liquidity. Smart money doesn’t trade in fair value, it trades where the most liquidity sits, and in this case, both the top and bottom of the range are loaded.
Inducement and Manipulation
The real purpose of this kind of range is not balance, it’s inducement. The market is inviting traders to take breakout positions on both sides, knowing full well that it’s unlikely to follow through cleanly. I believe we are currently in the inducement phase of the cycle. The equal highs around $105,800 are baiting breakout longs and short stop-losses alike. A move above that level would act as the stop hunt, triggering the final wave of longs before the rug is pulled. Once that liquidity is taken, I expect a sharp reversal that targets the lows of the range and continues further toward the real pool of liquidity sitting between $98,000 and $97,500.
Scenario Outlook
The most probable sequence from here is a fake breakout to the upside, followed by an impulsive selloff. A wick above $105,800 would serve as the signal, and once that inducement is cleared, the move down should be fast and decisive. This drop would take out the range lows and sweep the stops of everyone who tried to buy the breakout. If price does hold above $105,800 and shows continuation with strong volume and follow-through, that would be an invalidation of this short setup and a shift in structure, in which case I would reassess and wait for a pullback before considering any longs.
Price Target and Expectations
The first key event is the sweep above $105,800. That’s where breakout traders will commit, and that’s where I expect the reversal to begin. From there, downside targets include the low of the range and deeper liquidity near $98,000 to $97,500. This area aligns with a big imbalance zone, inefficiencies and the golden pocket fib level.. The expectation is for a quick drop once the trap is sprung, with a potential for a reaction or even a new bullish setup forming near that demand region.
Conclusion
Bitcoin has been compressing for over a week, and that usually ends with expansion. But expansion is not always trend continuation, especially when the structure suggests manipulation. The current setup looks ideal for a stop run above the range before dumping into deeper liquidity. The key is to wait for the sweep and watch how price reacts. The more obvious the breakout, the more likely it is to fail. Liquidity is king in this environment, and right now, the biggest pockets lie below.
___________________________________
Thanks for your support!
If you found this idea helpful or learned something new, drop a like 👍 and leave a comment, I’d love to hear your thoughts! 🚀
Make sure to follow me for more price action insights, free indicators, and trading strategies. Let’s grow and trade smarter together! 📈

I Think I Should Just Trade This SetupI Think I Should Just Trade This Setup
So long story short, I just:
0. Assess whether price has Seeked Liquidity, or Rebalanced Fair Value to get a clue of current price intention.
1. Wait for Overextended Price (Bearish or Bullish), Higher TF = Better
2. Wait for 4HR up to 15min Divergence + Oversold/Overbought, at least 2 TF with same divergence
3. On 15min, plot your FVA (PDA must be respected).
4. Look for your FVG entry once price has left the FVA.
5. Target nPOCs that align with divergence + price action direction (ex. npoc below price + bearish div + premium array respected + bearish orderflow leg)
I've been winning "random" trades like this, no TradingView needed, just MT5, and has saved my funded account from imminent death lol. But here's how, if I looked back on those trades, I entered.
I mean, this makes sense. Combine Price Action(PDA + FVA Respected) with Volume Momentum.
Oh, and just to add. I think nPOCs from previous sessions give a good clue about where price wants to go.
For example, npoc below price + bearish div & overbought + premium array respected + bearish orderflow leg = target nPOC.
I might have to track tradingview entries to see if this actually works.

EURUSD – Rebalancing Before Repricing HigherEURUSD is currently trading within a corrective phase after failing to sustain its bullish momentum from the earlier impulsive rally. The market structure on the 1-hour chart shows a clean breakdown from recent highs, with sellers starting to step in more aggressively. This pullback feels more like a calculated retracement than a complete trend reversal, and the market may be seeking out a deeper discount before any continuation higher. With multiple rejections forming at lower highs and downside pressure increasing, it looks like EURUSD wants to drive lower first before making a run for higher levels.
Consolidation Structure
We’ve been consolidating after the last upward push, forming a short-term range with price grinding sideways but gradually bleeding lower. What stands out is the clear cluster of equal lows forming, acting as obvious sell-side liquidity. Just below that area sits a 1-hour fair value gap that remains unmitigated, offering a strong magnet for price. The FVG sits just beneath the golden pocket zone, which adds more confluence for a potential reaction from that area. This range looks designed to draw in early buyers, only to flush them out before price finds real support.
Bearish Scenario – Setup for a Deeper Retracement
Right now, the structure leans bearish in the short term. The market looks like it wants to run the lows and wick into the 1-hour fair value gap sitting below the golden pocket. This area is an unmitigated imbalance that lines up perfectly with the idea of a final liquidity grab. I’m expecting price to reach down into that gap, around the 1.112 region, before any kind of reversal occurs. The goal of this move would be to clear out stops and rebalance the inefficiency from the previous rally, setting the stage for the next leg higher.
Bullish Scenario – Reversal from Discount
Once price trades into the 1.112 zone and sweeps the current lows, the setup for a bullish reversal becomes much cleaner. That area offers a combination of liquidity, inefficiency, and fib confluence, making it a high-probability level for buyers to step back in. If we get a solid rejection or displacement out of that level, the upside potential opens up quickly. The idea is that after this corrective move and stop hunt, the market reclaims momentum and starts driving toward the next key structure zone.
Price Target and Expectations
If price delivers the expected sweep and mitigation into 1.112, I’ll be looking for confirmation of bullish intent and signs of strength to enter long. The target sits much higher, all the way at the 0.28 fib level, which is around 1.20. That level offers a logical take-profit zone based on fib projection and structure alignment. The potential reward-to-risk on this move is excellent if the entry holds and the displacement confirms. This would essentially be a play on manipulation and continuation, classic liquidity run before expansion.
Conclusion
EURUSD is setting up nicely for a textbook sweep-and-reverse play. The market is currently moving lower, and I’m expecting that move to extend into the 1-hour FVG just below the golden pocket, targeting an entry near 1.112. From there, if price reacts cleanly, the next leg should aim for the 0.28 fib level at 1.20. All the ingredients are there: a clean imbalance, obvious liquidity to take, and a higher-timeframe fib target to anchor the move. Just need to wait for price to do its job and follow the plan.
___________________________________
Thanks for your support!
If you found this idea helpful or learned something new, drop a like 👍 and leave a comment, I’d love to hear your thoughts! 🚀
Make sure to follow me for more price action insights, free indicators, and trading strategies. Let’s grow and trade smarter together! 📈

Short Idea EURUSDShorting EURUSD once liquidity is taken probably tomorrow.
I set a Sell limit order and I will scale in once we have a new bearish 15m FVG formed after reaching the 15m OB.

Bitcoin – Respecting $103k FVG, Approaching ATH.Bitcoin failed to fully fill the large 4h and 1h FVG around the $100,000 zone, front-running the level before bouncing sharply. This type of price behavior suggests strong demand, with buyers stepping in aggressively before the inefficiency could be completely mitigated. The market is now shifting back to a more bullish tone after establishing a short-term bottom near the key higher-timeframe FVG.
Consolidation Structure
The price action has been messy and range-bound over the past few days, stuck between the major 1h/4h demand zone around $102,000 and the $105,000 resistance level. Within that broader range, Bitcoin created a new 1h FVG on the push off the lows, which has already been respected intraday around the $103,000 area. That newly formed FVG now acts as short-term support as price grinds upward again toward the prior resistance.
Bullish/Bearish Scenarios
On the bullish side, if Bitcoin flips the $104,500 to $105,000 resistance area cleanly into support with a convincing displacement and consolidation above it, there’s a good chance it will break out and target higher inefficiencies above $106,000. That would confirm buyers are in full control and using each FVG as a stepping stone higher.
However, if price gets rejected again inside the resistance zone without showing signs of strength or accumulation just below it, we could see another rotation lower back to the $100,000 FVG or potentially even a deeper retest of the broader $97,500 area. A rejection at the highs could align with a sweep of local buy-side liquidity and serve as a trigger for a short-term reversal.
Price Target and Expectations
Upside breakout targets sit around $106,200 and higher, based on the previous price inefficiencies and trend structure. On the downside, if we see rejection, price may revisit $100,000 and possibly test the deeper 4h imbalance zone closer to $97,500 again.
Current Stance
For now, price is trading inside the upper portion of the range and grinding into a known resistance area. There’s no clear confirmation yet of either a breakout or rejection, so the next move depends heavily on how price reacts within the $104,500 to $105,000 zone. Watching for either bullish continuation (with a clean flip and hold above) or a strong rejection setup for a possible fade back into the midrange.
Conclusion
Bitcoin continues to respect FVGs both to the downside and upside. The bounce from the 1h/4h demand confirms higher timeframe interest, and the respect of the new 1h FVG around $103,000 shows short-term strength. The next major decision point is the $105,000 resistance. A clean break and flip could signal continuation, while rejection there may trap longs and send price back toward demand.

BTC Fibo RetracementIn the meantime, here is my BTC plan. Now we are very close to ATH and I would wait for next retracement to enter long, if we are going to 120.
Zone Of Interest combines several reasons to make an entry.
• 0.5 Fibo
• Sell Side Liquidity
• Valid 8H FVG
• And a border of discount zone
It is not at all necessary that the price will fall to these levels, but if it will, I`ll be watching price action there and make my decision.
Have a good trades!

BTC - Will we repeat last year price action?Bitcoin (BTC) has recently been trading within a relatively wide range, fluctuating between the $108,000 and $74,000 levels. Over the past several months, the asset experienced a notable decline from its local high of $108,000 down to a low of around $74,000. However, since reaching that bottom, BTC has been on a recovery trajectory, climbing back up toward the $106,000 region as of May. This rebound has brought renewed optimism to the market, but the key question now arises: is this upward momentum sustainable, or is it merely another temporary relief rally within a larger consolidation phase?
To evaluate the potential sustainability of this move, it is insightful to compare the current price action with that of exactly one year ago. In the same May period last year, BTC was also trading within a defined range, between $73,000 and $56,000. The pattern that unfolded then may offer clues as to what might happen next.
At that time, Bitcoin formed a double top, a classic technical pattern that often signals weakening bullish momentum. This structure developed over two distinct peaks, let's call them Point 1 and Point 2. Following the double top formation, the market began to retrace, initiating a decline that led to the creation of Point 3. This low established a key trendline, marking the beginning of a longer-term structural setup.
After bouncing from Point 3, BTC managed to rally once more, approaching a new all-time high but falling just short. This rally formed what can be referred to as Point 4, and notably, this occurred in May, exactly where we are now on the calendar. However, this attempt to break to new highs ultimately failed. The market lost momentum, and BTC turned downward once again, culminating in another test of the established trendline. This next low, which we can label Point 5, occurred in July and served as the third touchpoint of the trendline, reinforcing its significance.
Fast forward to the present, and it appears that Bitcoin may be following a similar structural path. The current price action suggests that Points 1, 2, and 3 have already been formed in recent months. The bounce that we’re witnessing now could potentially be developing into Point 4, mirroring the rally seen last May. If history were to repeat or even slightly rhyme, we may be approaching a local high, after which the market could face renewed downward pressure.
Such a move would align with a third touch of the longer-term trendline, potentially occurring in the coming months, perhaps around July, just as it did the previous year. Furthermore, this prospective downside move would also serve to close a daily Fair Value Gap (FVG) that has remained largely unfilled, a technical factor that many traders are currently watching.
In summary, while the recent price recovery in Bitcoin is encouraging, a closer examination of past market structure and recurring seasonal patterns suggests caution. The market may be setting up for a local high in May, followed by a potential retracement that would once again validate key support levels and trendlines. Whether this scenario plays out in full remains to be seen, but the parallels with last year’s behavior are worth noting for any trader or investor closely monitoring the charts.
Thanks for your support.
- Make sure to follow me so you don't miss out on the next analysis!
- Drop a like and leave a comment!

Bitcoin - $100k retest before new ATH?Bitcoin has broken out of its 1-hour ascending channel with a sharp bearish displacement, ending the slow grind higher that had been in place since the 9th of May. That channel served as a controlled environment for accumulation and small trend continuation, but the move we just saw confirms that the phase of balance has shifted into a clear retracement. The displacement candle was strong, clean, and aggressive, closing well outside the lower boundary of the channel and taking out multiple internal lows in the process. This wasn’t a weak break, it showed intent.
From a market structure standpoint, this confirms that short-term control has shifted to the downside. That move also left behind a visible Fair Value Gap just above current price, which is likely to act as a draw in the coming sessions. Unless that FVG gets reclaimed impulsively, this looks like the beginning of a deeper retracement.
Consolidation Structure
Prior to the break, BTC was building liquidity inside a clean ascending channel. The highs kept getting swept by small wicks, which hints at repeated inducement and short-term stop hunts. The final push into the top of the channel marked the last bullish attempt, and price immediately reversed after that sweep. The moment it broke structure with a high-volume bearish candle, the entire channel was invalidated and turned into supply.
We now have a clean CISD framework in play, price consolidated inside a channel, created inducement near the highs, triggered a stop hunt into the upper end of the range, and then dropped with strong displacement. That displacement not only broke structure but also left behind an imbalance that has yet to be filled.
Bullish/Bearish Scenarios
Right now, the short-term bias is bearish. The break of structure is confirmed, the Fair Value Gap is still open, and there is a clear inefficiency left behind. I expect price to revisit that gap and then reject to the downside again. That would complete the FVG retest leg and open the door for a move into deeper zones.
The next key area of interest is around the $100,000 mark, slightly below the current trading range. That level holds both technical and psychological weight. It lines up with a previous breakout zone, an unfilled imbalance, and likely a large pool of resting liquidity from retail long stops and institutional bids. If we reach that zone, I’ll be watching for signs of strength to suggest that this pullback was a liquidity grab before the next leg up.
If we do get that tap into $100K and price responds with bullish displacement from there, the bullish narrative would be back in play. That could easily form the base for a new impulse toward all-time highs. However, if $100K fails to hold and price pushes through without a significant reaction, then we’re dealing with a larger correction, and I’d expect continuation toward lower inefficiencies.
Price Target and Expectations
First, I expect a small leg up to fill the Fair Value Gap inside the broken channel structure. That area will act as the first test, and if price shows rejection there, I’m looking for continuation toward the $100,000 to $99,500 region. That zone aligns with a clean 1H imbalance and marks the origin of the last strong bullish expansion.
If BTC taps into that deeper imbalance and confirms a reversal with clear bullish intent, the stage will be set for a potential breakout into new all-time highs. That’s where I would expect stronger hands to step in and take control. The longer price holds above that $99k zone, the higher the odds we break past the previous high.
But if there’s no reaction and price bleeds through $99K, the bullish structure on the higher timeframes would be compromised, and the move could extend toward the mid-$90K range.
Current Stance
Short-term bearish, waiting for price to retest the FVG inside the previous channel. That will be the first key area where I expect a reaction. If the rejection confirms, I’ll be watching for signs of continuation into $100K.
Not interested in chasing price between levels. I’ll either look to short the FVG retest with confirmation or wait for the deeper tap into the $100K zone to look for a long setup. No trades in the middle, only acting at the extremes where the risk-reward makes sense.
Conclusion
This setup fits cleanly into a classic displacement narrative. Bitcoin broke out of structure with a high-volume move, left behind an FVG, and is now likely preparing for a short retrace before continuing lower. The $100K zone is the main area to watch — that’s where the next high-probability trade opportunity is likely to develop. If bulls defend that zone and we get bullish confirmation, the path to new highs is still intact. But if $99K fails, I’ll be sidelined and looking for the next major level.
The structure is clear, the inefficiencies are visible, and the plan is defined. Now it’s just about waiting for price to do its job.
___________________________________
Thanks for your support!
If you found this idea helpful or learned something new, drop a like 👍 and leave a comment, I’d love to hear your thoughts! 🚀
Make sure to follow me for more price action insights, free indicators, and trading strategies. Let’s grow and trade smarter together! 📈

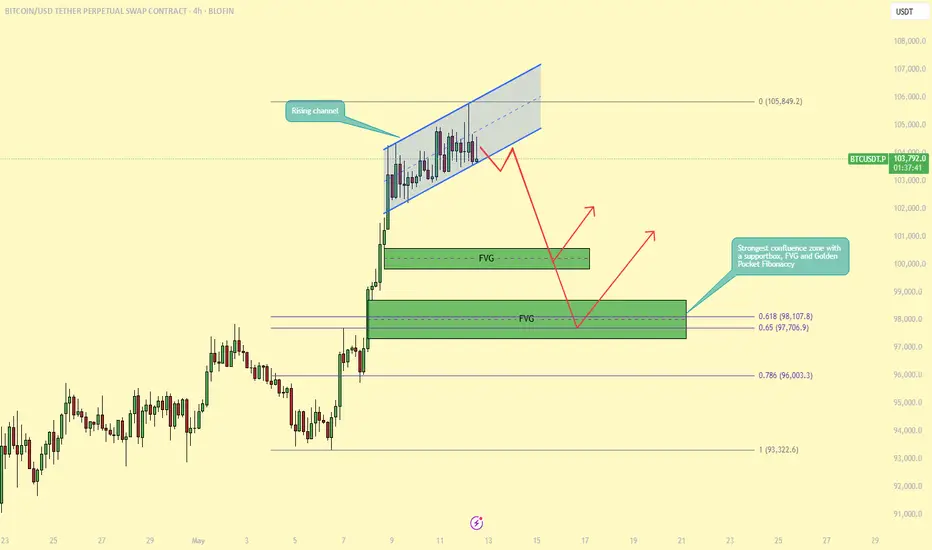
BTC Approaches All-Time High — But Signs of Weakness Emerge!BTC is once again approaching its all-time high (ATH) on the daily timeframe, generating excitement across the market. However, a closer look at the lower timeframes reveals signs of potential exhaustion as BTC encounters strong resistance. This suggests a pullback could occur before any continuation higher.
On the 4-hour and 1-hour charts, BTC is currently trading within a rising channel, which is often considered a bearish continuation pattern, especially when it forms directly below a key resistance level like the ATH. Price action within this structure is starting to lose momentum, and the presence of bearish divergences and decreasing volume further supports the likelihood of a near-term correction.
Where Could We Buy the Dip?
A pullback may offer a strategic entry opportunity for traders looking to ride the next leg up. Notably, two fair value gaps (FVGs) were created during the recent upward move. The first FVG could provide a minor bounce, but the second one is more compelling for a higher-probability long setup.
This second FVG aligns with a well-established support zone and coincides with the Golden Pocket of the Fibonacci retracement (between the 0.618 and 0.65 levels). This confluence of technical factors makes it a strong area of interest for bulls, and a potential springboard for price to retest, and possibly break, the ATH.
In summary, while BTC is showing strength on the higher timeframes, lower timeframe patterns suggest that a healthy correction is likely. Patience and proper level selection will be key. Watching how price reacts around the second FVG and the Golden Pocket zone may present one of the best opportunities for re-entry.
-------------------------------
Thanks for your support.
- Make sure to follow me so you don't miss out on the next analysis!
- Drop a like and leave a comment!
"USDJPY Just Printed a Trap — Smart Money Is In. Are You?"🧠 Smart Money Concepts (SMC) Setup Alert: USDJPY | 15-Min Timeframe
We’re spotting a high-probability bullish continuation setup on USDJPY backed by Smart Money logic. Let’s unpack what’s happening:
🧭 1. Liquidity Grab at the Low
Notice how price created a false breakdown below prior structure — a classic liquidity hunt. Late sellers got trapped before price snapped back aggressively, triggering a Bullish Break of Structure (BOS).
Smart Money needed to grab liquidity before running price higher. Textbook manipulation.
🟩 2. Refined Entry Zone: Discount + Bullish Order Flow
Price has now retraced back to a discount zone, entering the premium-to-discount pullback area. Buyers are expected to defend this level, creating the potential for a bullish continuation.
This entry is cleanly defined by a buy-side imbalance (light green area) which overlaps with a bullish order block and internal trendline support.
📐 3. Risk-to-Reward (R:R) Setup
We’ve got an excellent R:R opportunity here:
🎯 Entry: Near 145.910
❌ Stop Loss: Just above 146.314 (invalidate bullish bias)
✅ Take Profit Zone: 145.367 (with continuation possible beyond)
This gives us roughly a 2.3R setup, highly favorable for swing entries.
🎯 4. Confluence
Trendline support holding
Bullish BOS confirmed
Imbalance filled
Liquidity grabbed
Order block respected
FVG forming structure for propulsion
Smart Money is likely to push price back toward internal liquidity highs — and possibly sweep them for a final exit.
📊 Strategy:
Wait for bullish engulfing or strong rejection wick from this discount zone to confirm entry.
Trail stop as structure develops on lower timeframes. This setup can also be compounded if price forms another internal BOS.
⚠️ Risk Reminder:
Don’t chase. Let price come to you.
Manage risk at all times.
One setup doesn’t define the day — consistency wins.
🧪 Summary:
USDJPY is giving Smart Money vibes — from the liquidity grab, clean BOS, internal order block, to an excellent R:R setup.
This is the kind of trade where you want to be the hunter, not the prey.
💬 Drop a 🔥 if you caught this move.
📩 Tag a trading buddy who needs to learn SMC.
📊 Stay smart. Trade with purpose.

BTCUSD – Multi-TF Bearish SFP & Fib Retrace Before ATH Rebound
Bearish SFP printed on 4H / 8H / 12H / 1D at $103 345 – $104 985 after a parabolic ~$94 k → $104 k run and multiple rejections at $104 k–$106 k resistance.
Trump tariff-cut announcement sparked a sharp spike into resistance that was quickly sold off, confirming heavy supply at $104 k – $106 k.
Baseline plan: drop to 0.786 Fib ~$102 586, then 0.618 Fib ~$100 613, before a push toward the ATH ~$109 588.
Trade Setups
Short – SFP Breakdown
Trigger: 4H close below $103 345
Entry: ≈ $103 300 on retest
SL: $105 500 (above swing high)
TP1: 0.786 Fib ≈ $102 586 RR ≈ 0.7
TP2: 0.618 Fib ≈ $100 613 RR ≈ 2.6
Long – Fib Rebound
Trigger: Bullish reversal at 0.618 Fib / FVG cluster ≈ $100 613
SL: $99 300 (below FVG)
TP1: SFP top / range high ≈ $104 145 RR ≈ 2.7
TP2: ATH ≈ $109 588 RR ≈ 6.8

"BTCUSD Smart Money Setup: Fair Value Gap + Weak Highs🚨 Bitcoin (BTCUSD) Smart Money Play Unfolding!
Let’s break down what’s happening on this 15-minute BTCUSD chart and why we could be gearing up for a powerful bullish reversal:
📍 Liquidity Sweep + Market Structure Shift
Price aggressively pushed into a weak low, grabbing liquidity from late sellers and stop orders. Smart Money behavior detected as price forms a potential Change of Character (ChoCH) at a discount zone.
This shift signals a transition from bearish pressure to potential bullish intent.
📍 Fair Value Gap (FVG) as Re-entry Zone
We’ve marked a clean Fair Value Gap (pink box) just below current price action, aligning with the 78–79% retracement zone. Smart Money loves these inefficiencies — they act as magnets for price to rebalance before strong directional moves.
🟣 This FVG is your 1st key zone for entries. If price respects this, we could see an explosive move toward the buy-side liquidity.
📍 Confluence: Fibonacci + Imbalance
Notice how this FVG perfectly aligns with the Fibonacci Golden Zone (70.50–79.00%). This adds extra confluence that this area could act as a powerful springboard for long positions.
📍 Buy-Side Liquidity & Weak Highs Targeted
Above current price lies a Buy Side Liquidity pool and a marked Weak High, signaling that Smart Money may be targeting these inefficiencies next.
🎯 These are the obvious targets if price reacts from the FVG:
First TP at 104,680
Second TP at 104,887
Optional continuation beyond if price grabs liquidity and breaks structure
📊 Risk-to-Reward (R:R) Play
Entry near FVG with stop just below the Strong Low offers an attractive R:R setup. Targeting the weak high gives a multi-R potential.
🟢 High probability setup if price shows bullish reaction (engulfing, BOS) in the FVG zone.
🧠 Smart Money Logic:
Manipulation ✅
Imbalance/FVG ✅
Liquidity Grab ✅
Structure Shift ✅
Clean Targeting of Buy Side Liquidity ✅
This is a textbook SMC long setup in development.
⚡ Game Plan:
Wait for confirmation in the FVG zone (e.g., bullish engulfing or BOS on lower TF).
Set longs with tight stop below 103,535 (Strong Low).
Secure partials at first TP and trail for extended target.
🚨 Risk Management Reminder:
Stick to your trading plan.
Let price come to you.
Never risk more than you can afford to lose.
✍️ In summary:
BTC is sitting at a beautiful discount level with a clear inefficiency to fill. If Smart Money reacts here, we’re looking at a smooth climb into higher liquidity zones. This could be the cleanest setup of the day — if you know how to play it right.
💬 Comment “BTC READY” if you’re planning to enter this setup!
👥 Tag a crypto buddy who needs to see this!

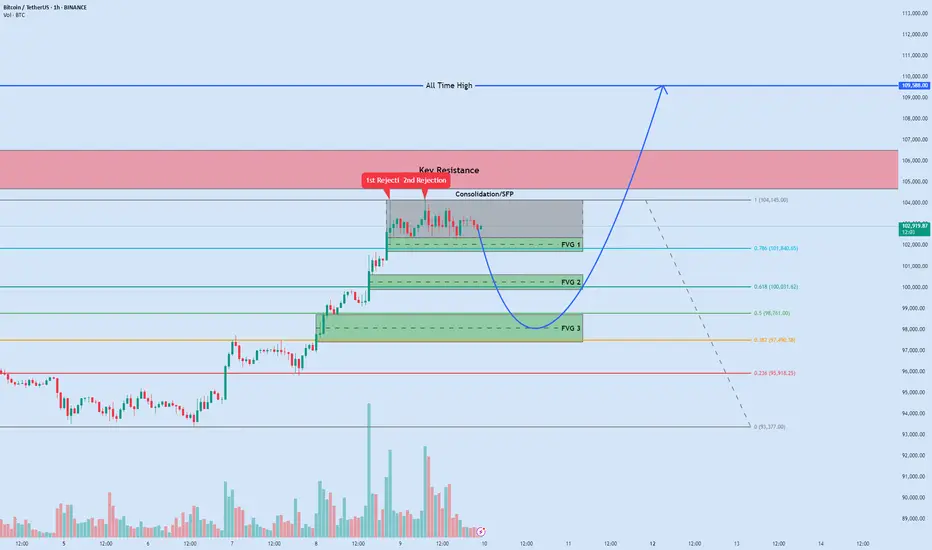
BTC: Potential Dip into FVGs Before New ATHBitcoin has rocketed from ~$94 000 to ~$103 250 in just days and is now consolidating between $102 364–$104 145. A Swing Failure Pattern at the top suggests a corrective pullback into one of three Fair Value Gaps aligned with key Fibonacci retracements, before the next leg up toward a fresh all-time high. This setup uses structure, inefficiency zones, and Fib levels to pinpoint high-probability entries.
📊 Chart Breakdown
1. Current Picture: Consolidation & Warning ⚠️
- Range: $102 364 – $104 145
- Swing Failure Pattern (SFP): Price briefly wicks above $104 145 to grab liquidity, then reverses. This classic liquidity hunt often precedes a deeper retrace as late bulls are stopped out.
2. Fair Value Gaps (FVGs) – Untested Support Zones 🌊
FVGs are rapid imbalance areas where price left gaps in the order book. These zones act like magnets, drawing price back to “fill” inefficiencies.
FVG 1 (Nearest): $101 700 – $102 364
FVG 2 (Mid-Zone): $99 900 – $100 600
FVG 3 (Deepest): $97 400 – $98 700
3. Fibonacci Confluences (from $93 377 → $104 145) 📏
Fibonacci retracement levels often align with FVGs to form confluence support—ideal for swing entries.
0.786 Fib @ $101 840.65: Sits squarely in FVG 1, a high-probability bounce zone.
0.618 Fib @ $100 031.62: Golden Ratio within FVG 2, offering strong support.
0.5 Fib @ $98 761 & 0.382 Fib @ $97 490.38: Cover top and mid-lower FVG 3 for a deep corrective entry.
📈📉 Navigating the Next Moves: Key Trade Scenarios 🧭
Given the current structure, with the SFP indicating a potential short-term top and strong FVG/Fibonacci confluences below, here are two primary scenarios we can watch for:
Scenario 1: The Short-Term Pullback Play (Short Position 📉🐻)
Concept: Capitalizing on the SFP at the consolidation high (~$104,145) to trade the anticipated dip towards the FVG/Fibonacci support clusters.
Aggressive Entry: Look for entries around $103,500 – $103,900 if price retests the upper part of the consolidation after the SFP, showing weakness.
Conservative Entry: A break below the consolidation low (~$102,364) could offer a confirmation entry, potentially on a retest of this broken level as resistance.
Stop-Loss 🛑: Place above the SFP high, e.g., $104,450 – $104,650, to protect against a false breakdown.
Profit Targets (FVG Zones) 🎯
TP1: The top of FVG 1 / 0.786 Fib area (~$102,300 – $101,840). This zone is critical.
TP2: The FVG 2 / 0.618 Fib area (~$100,600 – $100,030) if TP1 is breached with momentum.
Trade Management & Considerations 🤔:
Entry Confirmation: Watch for bearish price action on lower timeframes (e.g., 15m/1H rejection wicks, bearish engulfing) near the SFP high.
Profit Taking: Consider taking partial profits at TP1. The reaction here is crucial.
Reversal/Close Short: If price enters TP1 and shows strong bullish rejection (large wicks, engulfing bull candles, volume spike), close the short and prepare to flip to the long scenario.
Holding for TP2: If price slices through TP1 with sustained bearish pressure, trail your stop above TP1 once it’s clearly broken.
Invalidation: If price reclaims and holds above $104,650, the short thesis is invalidated.
Scenario 2: The FVG Rebound & Rally (Long Position 📈🐂)
Concept: Entering on the expectation that one of the FVG/Fibonacci confluence zones will hold as support, leading to a rebound and continuation of the larger uptrend.
Potential Entry Zones 📍:
Zone A (Primary): FVG 1 / 0.786 Fib area ($101,700 – $102,364, sweet spot ~$101,840).
Zone B (Secondary): FVG 2 / 0.618 Fib area ($99,900 – $100,600, sweet spot ~$100,030).
Stop-Loss 🛑:
If entering in Zone A: Place below FVG 1, e.g., $101,350 – $101,150.
If entering in Zone B: Place below FVG 2, e.g., $99,600 – $99,400.
Profit Targets 🎯:
TP1: Back to the consolidation high / SFP area (~$104,145).
TP2: The key resistance zone ($104,675 – $106,500).
TP3 (Ultimate): The All-Time High ($109,588).
Trade Management & Considerations 🤔:
Entry Confirmation: Do not blindly enter. Wait for price to enter your chosen FVG zone AND then show clear bullish confirmation on lower timeframes (e.g., 1H/4H bullish engulfing, hammer, RSI divergence).
Zone Prioritization: Zone A is the first test. If it fails and breaks down, Zone B becomes the next area of interest.
Profit Taking & Scaling Out: Take partial profits at TP1 and again at TP2 to secure gains.
Risk Reduction: After TP1 is hit, move your stop-loss to breakeven or slightly in profit.
Invalidation: A decisive break below $99,400 invalidates the bounce thesis and suggests a deeper correction.
🎯 Execution Notes
- Patience & Confirmation: Avoid “blind” entries. Seek volume confirmation and clear reversal candle patterns on 1H/4H charts.
- Risk Management: Define stops before entry and size positions to risk no more than 1–2% per trade.
- Additional Signals: Watch for bullish RSI/RSI-MFI divergences or a turn in on-balance volume at support zones.
Disclaimer: This is for educational/informational purposes only and not financial advice. Crypto trading carries high risk—always DYOR and consult a qualified advisor.
What’s your take? Which FVG/Fib level will hold? Share your insights below!
EURUSD – Bearish Rejection and Targeting the 4H Imbalance ZoneEURUSD has shifted into a clear bearish tone following multiple rejections from a well-established resistance level. Over the past several weeks, price has struggled to break above that zone, showing consistent signs of selling pressure each time it attempted a push higher. The most notable move came when price briefly spiked above the resistance in what now appears to be a fakeout. That move did not hold, and it’s very likely that it served as a classic liquidity grab engineered to sweep buy stops resting above the range highs before reversing direction.
This kind of behavior is typical in a distribution phase, especially when seen at a high-timeframe resistance zone. The fake breakout essentially confirms that the upside liquidity has been taken, and that smart money is shifting direction. Since that event, price has been making lower highs and lower lows, reinforcing the current bearish structure.
Consolidation Structure
Before the fakeout, EURUSD had been consolidating just under resistance, building up a tight range. This kind of structure tends to lure in breakout traders, and the eventual spike above the range likely cleaned out a lot of stop orders. What followed was an aggressive reversal back into the prior range, which is a strong sign that the breakout was not genuine.
Since then, price pushed down and attempted a retracement, but that retracement got rejected precisely within a fair value gap. This is significant. It tells us that even during a pullback, the market is respecting inefficiencies and continues to deliver bearish reactions rather than signs of strength. That rejection further confirms that bears remain in control and that the earlier break was nothing more than a trap.
Bearish Scenario
With resistance holding and the fair value gap rejection now confirmed, I expect EURUSD to continue its descent and seek out deeper levels of interest. The most obvious draw on liquidity now sits below the current price, the large four-hour imbalance zone. This imbalance was left behind during the impulsive rally that preceded the fakeout, and it has yet to be filled.
Inside that imbalance, there’s also a golden pocket level lining up almost perfectly. That confluence between the imbalance zone and the 0.618–0.65 region adds weight to the idea that this area will act as a magnet for price. Markets seek efficiency, and this entire zone represents a void that price is likely to come back and rebalance.
The move into that zone would also allow the market to engineer sell-side liquidity along the way, particularly under the recent higher lows. Once those are swept, and if price begins to react inside the golden pocket, we may then begin to look for early signs of accumulation or even a bullish displacement, but until then, the short bias remains firmly in play.
Price Target and Expectations
The first key expectation is a clean sweep through the current local lows and a drive into the heart of the 4-hour imbalance. This is where I’ll be watching most closely for a potential change in behavior. Ideally, I want to see price push deep into the imbalance and tap the golden pocket before doing anything significant on the long side.
If price shows a strong reaction there, such as a bullish engulfing or a clear market structure shift that would signal the potential for a reversal. Until then, any bounce is likely to be short-lived and corrective in nature. The structure is still bearish, and the fair value gap rejection reinforces that.
Current Stance
Right now, I remain bearish. I’m not interested in fighting this momentum by jumping into premature longs. As long as price remains under the level it got rejected from, and continues to print lower highs, I’ll maintain a sell-the-rip mindset. If price delivers a deeper pullback from here, it may offer a short-term intra-day bounce, but the core expectation is still a move lower into the imbalance zone.
The area that interests me the most is the combination of the 4-hour imbalance and golden pocket, that’s the zone where I’ll shift from reactive to proactive and start looking for possible long setups. But I won’t consider longs unless price gets there and shows clear intent to reverse.
Conclusion
The market has already swept buy-side liquidity with the fakeout above resistance, and the rejection from the fair value gap confirms that sellers are still in control. Price is now being drawn toward the inefficiency below, and all signs point toward a continued bearish move until that imbalance is filled.
Until price reaches that zone and delivers a reaction worth trading, I’m staying patient and waiting for the setup to complete. Chasing entries in the middle of the range here doesn’t offer the best risk-reward. The focus now is on watching how price interacts with the 4-hour imbalance and the golden pocket, that’s where I’ll reassess the narrative and consider shifting bias if conditions warrant it.
___________________________________
Thanks for your support!
If you found this idea helpful or learned something new, drop a like 👍 and leave a comment, I’d love to hear your thoughts! 🚀
Make sure to follow me for more price action insights, free indicators, and trading strategies. Let’s grow and trade smarter together! 📈

Ethereum waking up?One of the most disappointing projects in the crypto space in recent years has to be ETH, losing ground on BTC since September '22. Finally ETH looks to have woken up outpacing BTC this week and broken out from the daily downtrend channel and currently at the underside of the DAILY 200 EMA.
BTC.D has printed a SFP and dropped 2% from 65.4% to 63%, could we be seeing a rollover and rotation into altcoins?
How I see it the moving average should cap off this move for now and a retrace towards the breakout area & previous lower high. That would then be the first higher high and higher low of this calendar year, a very bullish change in structure.
A more aggressive bullish scenario in the short term would be a reclaim of the 1D 200 EMA, leaving the inefficiency zone at the breakout level unfilled.
Either way the next HTF target is $2,800 for ETH which would bring price to the range midpoint and a key supply zone with many resting Stop losses.

Bitcoin – Price Hits $100K, Will It Hold or Dive Into Demand?Bitcoin has officially reached the long-anticipated $100,000 mark, sweeping the psychological round number and clearing out a major pool of liquidity sitting just above it. This move came off the back of a sharp and impulsive leg, likely fueled by both spot demand and late-stage FOMO-driven breakout longs. At the same time, short liquidations added fuel to the upside, pushing price rapidly through thin areas on the volume profile. This type of vertical movement typically doesn’t last long without some form of corrective structure, and now that the $100K level has been tagged and liquidity taken, we can reasonably expect a period of cooling off, either through time-based consolidation or a more price-based retracement.
Consolidation Structure
The move up left behind two significant fair value gaps (FVGs) on the 4H chart. The first sits just beneath current price and represents the immediate imbalance created by the impulsive breakout candle. This is the shallowest inefficiency and would be the first area to watch for a potential short-term reaction. The second FVG lies deeper and overlaps perfectly with the 0.618 to 0.65 Fibonacci retracement zone, the golden pocket. This deeper zone is structurally more important, not only because it aligns with the golden pocket ratio but also due to its proximity to the high-volume node clearly visible on the Volume Profile (VRVP). Below this zone, there’s a strong base of support built from the previous consolidation area, making it a prime candidate for a bounce if tested.
Bullish/Bearish Scenarios
Scenario 1: In the bullish continuation case, Bitcoin retraces slightly to fill the shallow FVG just beneath $99K. A clean reaction there, especially if backed by strong volume and low timeframe bullish structure, could lead to a resumption of the trend with a fresh leg upward. This scenario assumes that the current breakout is being respected by the market and that participants are eager to front-run deeper entries. If this plays out, we’d expect a relatively quick reclaim of $100K, potentially building a new higher-low formation before continuing into uncharted territory above $102K.
Scenario 2: The second and more complex scenario involves a deeper retracement toward the lower FVG and golden pocket, between roughly $96.2K and $95.2K. This would constitute a cleaner reset of the recent move and allow the market to shake out weak longs who entered during the euphoric breakout. It also opens the door for a possible inducement setup, drawing in early sellers only to reverse at a key confluence zone. The golden pocket, combined with the high-volume node just below, makes this a high-probability demand zone. If we see bullish SFPs, displacement candles, or lower timeframe market structure shifts from there, it would be a strong long entry zone for a reattempt at the highs.
Price Target and Expectations
If Scenario 1 plays out, we can expect price to reclaim the $100K level fairly quickly, with upside potential toward $102K to $103K in the near term. The risk here is limited, given the shallowness of the retracement, but continuation would likely be more gradual and grindy due to the lack of a proper reset. If Scenario 2 plays out, the bounce from the golden pocket could produce a much healthier structure for further upside, and in that case, targets beyond $104K become more viable. The lower retracement would offer a better R/R and allow the market to rebuild momentum organically.
Current Stance
Right now, we remain bullish on the higher timeframes, but recognize the need for a local correction. We’re not interested in chasing the breakout blindly, the move has already cleared a major liquidity level and needs to rebalance before any sustainable continuation. We’re watching both FVGs closely. If the first one fills and holds, we’ll look for signs of strength and continuation. But if price breaks deeper, we’ll shift our focus to the golden pocket and bottom FVG as the more attractive long entry. Below that, the VRVP shows thick support, so our bias remains bullish unless we get a confirmed breakdown beneath that base.
Conclusion
Bitcoin has done its job in tagging $100K and clearing the obvious liquidity pool above. What comes next is all about how the market digests that move. Either we get a shallow retracement into the first imbalance and continue higher from there, or we go deeper into the golden pocket and establish a more meaningful base. Both scenarios still lean bullish, the key is patience and waiting for the right structure to develop. There’s no need to force entries here. Let price come to your levels, wait for confirmation, and take the trade when the setup aligns.
___________________________________
Thanks for your support!
If you found this idea helpful or learned something new, drop a like 👍 and leave a comment, I’d love to hear your thoughts! 🚀
Make sure to follow me for more price action insights, free indicators, and trading strategies. Let’s grow and trade smarter together! 📈

Mastering Fair Value Gaps (FVG) - How to use them in trading?In this guide, I’ll explain the concept of the Fair Value Gap (FVG), how it forms, and how you can use it to identify high-probability trading opportunities. You'll learn how to spot FVGs on a chart, understand their significance in price action, and apply a simple strategy to trade them effectively.
What will be explained:
- What is a FVG?
- How can a FVG occur?
- What is a bullish FVG?
- What is a bearish FVG?
- How to trade a FVG?
-------------------------------
What is a FVG?
A FVG is a technical concept used by traders to identify inefficiencies in price movement on a chart. The idea behind a fair value gap is that during periods of strong momentum, price can move so quickly that it leaves behind a "gap" where not all buy and sell orders were able to be executed efficiently. This gap creates an imbalance in the market, which price may later revisit in an attempt to rebalance supply and demand.
A fair value gap is typically observed within a sequence of three candles (or bars). The first candle marks the beginning of a strong move. The second candle shows a significant directional push, either bullish or bearish, often with a long body indicating strong momentum. The third candle continues in the direction of the move, opening and closing beyond the range of the first candle. The fair value gap itself is defined by the price range between the high of the first candle and the low of the third candle (in the case of a bullish move), or between the low of the first candle and the high of the third (in a bearish move). This range represents the area of imbalance or inefficiency.
-------------------------------
How can a FVG occur?
There are several factors that can trigger a fair value gap
- Economic news and announcements
- Earnings reports
- Market sentiment
- Supply and demand imbalances
-------------------------------
What is a bullish FVG?
A bullish FVG is a specific type of price imbalance that occurs during a strong upward move in the market. It represents a zone where the price moved so aggressively to the upside that it didn’t spend time trading through a particular range, essentially skipping over it.
This gap usually forms over the course of three candles. First, a bullish candle marks the beginning of upward momentum. The second candle is also bullish and typically has a large body, indicating strong buying pressure. The third candle opens higher and continues moving upward, confirming the strength of the move. The bullish fair value gap is the price range between the high of the first candle and the low of the third candle. This area is considered an imbalance zone because the market moved too quickly for all buyers and sellers to interact at those prices.
-------------------------------
What is a bearish FVG?
A bearish FVG is a price imbalance that forms during a strong downward move in the market. It occurs when price drops so rapidly that it leaves behind a section on the chart where little to no trading activity happened.
This gap is identified using a three-candle formation. The first candle typically closes bearish or neutral, marking the start of the move. The second candle is strongly bearish, with a long body indicating aggressive selling pressure. The third candle opens lower and continues the move down. The bearish fair value gap is the price range between the low of the first candle and the high of the third candle. That range is considered the imbalance zone, where price skipped over potential trade interactions.
-------------------------------
How to trade a FVG?
To trade a FVG effectively, wait for price to retrace back into the gap after it has formed. The ideal entry point is around the 50% fill of the FVG, as this often represents a balanced level where price is likely to react.
During the retracement, it’s helpful to see if the FVG zone aligns with other key technical areas such as support or resistance levels, Fibonacci retracement levels, or dynamic indicators like moving averages. These additional confluences can strengthen the validity of the zone and increase the probability of a successful trade.
Enter the trade at the 50% level of the FVG, and place your stop loss just below the most recent swing low (for a bullish setup) or swing high (for a bearish one). From there, manage the trade according to your risk-to-reward preferences—whether that’s 1:1, 1:2, or a higher ratio depending on your strategy and market conditions.
-------------------------------
Thanks for your support.
- Make sure to follow me so you don't miss out on the next analysis!
- Drop a like and leave a comment!

Possible Next Move AUD JPYLooking at the Daily & 1HR Chart. Bearish trend over all. Likely to take out the Daily FVG to head down to the next significant price zone of 86.981. This area also shows a 1HR liquidity zone.

EU Long IdeaWe are looking at the final stage of accumulation and waiting for FED rate to trigger it. All short sellers have been absorbed and longs are clearly taking place now.

Bitcoin - Bulls vs Bears: 88k or 100k?Bitcoin has broken through the 4H imbalance zone that also acted as an old resistance area. The break came through a clear displacement candle, which showed strong intent from the market. That same move left behind a new gap just under the previous resistance. Although price already retested that area once, it didn’t fully fill the gap, so we could see one more retest to complete the 50% line before the market chooses direction.
Consolidation Structure
The range before the breakout was clean, with multiple rejections from the resistance zone. That zone was front-run several times, then finally broken with conviction. Now, price is hovering just under that broken level, and the new gap created by the displacement candle is still fresh and technically unfilled.
Below current price, there’s a large inefficiency sitting between 88.2k and 90k. This zone stands out because it’s not only a clean 4H imbalance, but it also aligns with the golden pocket retracement from the last major leg up. That type of confluence usually attracts liquidity, especially if price gets rejected from the gap above and starts moving lower.
Bullish/Bearish Scenarios
The bullish scenario would play out if price manages to reclaim the gap zone, pushes back above the resistance cleanly, and treats the gap as support. That would be a classic structure flip, where the previous resistance becomes a new base, and the gap gets inverted into a continuation zone. If we see that, the next upside targets would sit around the 96k to 97k area, where more liquidity is likely resting.
On the other hand, if price moves into the gap and gets rejected again, that confirms sellers are still active at that level. In that case, I’d expect the market to push down and start filling the inefficiencies below. The 88.2k to 90k area becomes the primary draw. It’s packed with confluence from the 4H imbalance and the golden pocket, and it also lines up with previous demand zones. If price reaches into that area, it could trigger a strong reaction and potentially form the next higher low.
Price Target and Expectations
If we see rejection from the current gap, the target shifts to the 88.2k to 90k zone. That’s where I’ll be watching for bullish signs, since it’s the type of level where buyers often step in. A clean reaction there could be the start of a new leg higher. But if the market doesn’t get that low, and instead pushes up through the resistance, then the bullish breakout scenario is active, and we’d be aiming higher toward the 96k range or even the 100k.
Current Stance
Right now, I’m in reactive mode. The trade will depend on what happens at the gap zone. If we get another rejection from it, I’ll look for a move into the golden pocket below. If we reclaim the gap and break resistance, I’ll be looking to enter on confirmation of the flip. No trade from the middle, only once price gives clear direction from either key level.
Conclusion
This is a clean two-scenario setup. Either price fills the remaining gap and flips resistance, triggering the bullish continuation, or we reject from that area again and drop into the 88.2k to 90k range for a deeper liquidity grab. Both are valid, and both offer high-probability trades once price confirms the path.
___________________________________
Thanks for your support!
If you found this idea helpful or learned something new, drop a like 👍 and leave a comment, I’d love to hear your thoughts! 🚀
Make sure to follow me for more price action insights, free indicators, and trading strategies. Let’s grow and trade smarter together! 📈

Possible Next GBP JPY MoveLooking at the Daily, 1HR and 15M charts, looking to take out the 1HR FVG. Then head down toward the 15M FVG. To then continue a downward move, taking out recent lows to the Daily FVG.
