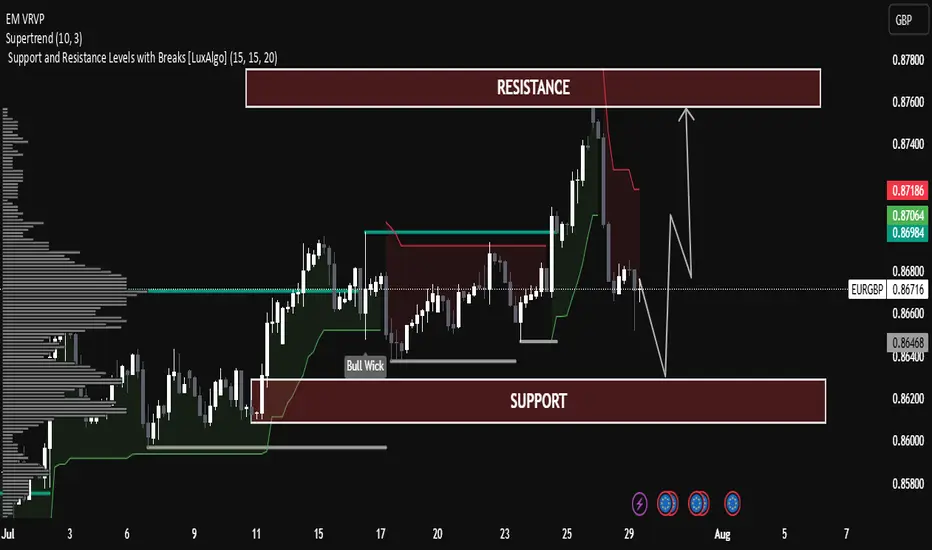
EUR/GBP Technical Analysis – Range-Bound Structure EUR/GBP Technical Analysis – Range-Bound Structure with Potential Rebound
The pair is currently trading within a well-defined horizontal channel between:
Support Zone: 0.86400 – 0.86200
Resistance Zone: 0.87800 – 0.87600
Price is currently near the mid-level (0.86756), showing consolidation after a rejection from resistance.
Supertrend Indicator:
The Supertrend (10,3) is currently bearish (red line above the price), indicating short-term downward pressure.
Price recently broke below the Supertrend line near the highs, suggesting a correction is underway.
Volume Profile (Left Side):
Significant volume has been transacted around the current market range (Point of Control).
This indicates strong interest and fair value, often leading to sideways movement before the next breakout.
Bull Wick Highlight (Mid-July):
Indicates buying pressure from lower levels, acting as historical demand near 0.86400.
🔄 Price Projection & Scenario Planning:
✅ Scenario A: Bullish Rejection from Support
If price retests the support zone (0.86400 – 0.86200) and forms a bullish rejection (e.g., pin bar or engulfing), a bounce is likely.
Target: Resistance zone 0.87600 – 0.87800
Confirmation: Bullish candle + break of 0.86900 resistance.
❌ Scenario B: Bearish Breakout Below Support
A break and close below 0.86200 may trigger a deeper correction.
Next possible downside target: 0.85800
Volume drop and strong red candles would support this.
🔧 Technical Summary:
Indicator Status
Structure Sideways / Range-bound
Supertrend Bearish (Short-term)
Support Zone 0.86200 – 0.86400
Resistance Zone 0.87600 – 0.87800
Bias Neutral-to-Bullish (above support)
🧠 Educational Note:
This chart is a great example of range trading—where traders look to buy near support and sell near resistance, especially when there is no strong trend. Patience and confirmation signals (like wick rejections or volume spikes) are key in such setups.
Fxmarket
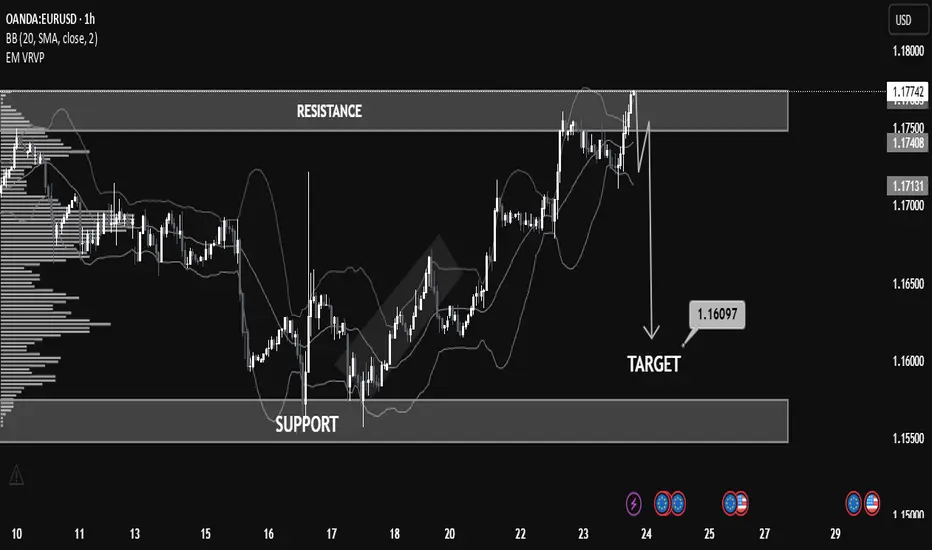
Educational EUR/USD Chart Breakdown – Price Action at Key LevelsEducational EUR/USD Chart Breakdown – Price Action at Key Levels
This EUR/USD (1-hour) chart provides a great example of how support and resistance zones, combined with price action and indicators like Bollinger Bands, can help anticipate market moves.
🔹 Resistance Zone Tested:
The pair recently approached the 1.17500–1.17800 resistance zone. This level had previously acted as a supply zone, and price once again showed rejection here, indicating selling pressure.
🔹 Bollinger Band Overextension:
Notice how the price extended beyond the upper Bollinger Band—this often signals that the market is overbought in the short term, leading to a potential reversal or correction.
🔹 Bearish Reaction & Target:
After rejection from resistance, the chart outlines a bearish move with a target at 1.16097. This level lies just above the next strong support zone (1.15500–1.16100), offering a realistic area for price to stabilize if the downtrend continues.
🔹 What to Learn:
Support & Resistance: Prices often react at key zones; previous resistance can turn into support and vice versa.
Confluence Tools: Use indicators like Bollinger Bands with price structure to increase confidence.
Target Planning: Identify likely reaction zones for risk management and profit-taking.
📚 Summary
This setup is a clean example of trading within a range and using technical confluence to plan entries and exits. If price breaks below 1.17130 with strong momentum, the probability increases for the market to reach the 1.16097 target.
Is This the Calm Before the Storm on AUD/USD?The AUD/USD pair is currently consolidating within a sideways range, indicating indecision in the market. Price is fluctuating between key horizontal support near 0.6150 and resistance around 0.6450.
A rising trendline is providing strong dynamic support, keeping the pair from breaking lower, while a descending resistance line continues to limit upside momentum. As long as the pair remains within this range, no clear trend is confirmed.
A breakout above resistance could signal a bullish shift, while a breakdown below the trendline may open the door for further downside.
If you find our analysis helpful, don’t forget to like and follow us.
THANK YOU
DYOR, NFA

NZDUSD Daily Outlook: Slight Bullish Bias Amid Today !!NZDUSD Daily Outlook: Slight Bullish Bias Amid Current Market Conditions (31/10/2024)
Introduction
As we delve into today’s trading session, the NZDUSD pair shows signs of a slightly bullish bias due to a combination of fundamental drivers and current market conditions. This article provides a comprehensive analysis of the NZDUSD's outlook on October 31, 2024, shedding light on the key factors impacting the New Zealand Dollar (NZD) and the US Dollar (USD) in today’s trading environment. With the right blend of technical and fundamental insights, we aim to offer valuable insights for traders considering NZDUSD positions.
Key Fundamental Drivers Impacting NZDUSD Today
1. China's Economic Growth and Its Influence on NZD
- The New Zealand Dollar, a commodity-linked currency, closely correlates with China's economic health due to New Zealand's export reliance. Recent reports suggest a moderate recovery in China's industrial and manufacturing data, which bodes well for NZD. Increased demand for New Zealand exports, especially dairy, bolsters the Kiwi's outlook, creating an overall positive sentiment for NZDUSD.
2. Federal Reserve’s Dovish Stance
- A significant driver for NZDUSD is the Federal Reserve’s dovish stance, with expectations for a pause on future rate hikes. This has resulted in a softer USD as investors anticipate fewer rate hikes going forward. A dovish Fed policy tends to weaken the USD, increasing the attractiveness of the NZD and slightly tilting NZDUSD towards bullishness.
3. New Zealand's Stable Economic Indicators
- New Zealand’s recent economic data reveals consistent GDP growth, low unemployment rates, and a robust labor market. This stability has created an optimistic environment for the New Zealand Dollar. Additionally, the Reserve Bank of New Zealand (RBNZ) has maintained a steady rate outlook, supporting the Kiwi by keeping investors interested in NZD assets due to positive yields.
4. US Treasury Yield Fluctuations and Its Impact on USD
- The ongoing fluctuations in US Treasury yields have contributed to the USD's recent mixed performance. A decline in yields typically makes the USD less attractive, as lower yields reduce the appeal for foreign investors. As a result, NZDUSD may benefit from a weaker USD, supporting a bullish bias in today’s trading.
5. Market Sentiment and Risk Appetite
- Recent geopolitical tensions and global market fluctuations have impacted the broader market sentiment. The Kiwi typically gains when there is a higher risk appetite among investors. As volatility stabilizes, we may see increased demand for higher-yielding currencies, which could strengthen NZDUSD’s position, albeit moderately.
Technical Analysis of NZDUSD (31/10/2024)
Looking at today’s technical setup for NZDUSD, the pair trades above its 50-day moving average, a potential bullish indicator. The Relative Strength Index (RSI) currently sits near the 60 mark, indicating a neutral to slightly bullish sentiment. Support levels at 0.5850 and resistance near 0.5920 will be critical zones to monitor.
Key Support: 0.5850
Key Resistance: 0.5920
Conclusion: NZDUSD Outlook for 31/10/2024
With today’s economic data and current sentiment, the NZDUSD pair leans towards a slightly bullish outlook. Strong economic fundamentals from New Zealand, coupled with a softer US Dollar from a dovish Federal Reserve stance, are influencing the pair's potential upward movement. However, traders should stay vigilant to potential changes in Treasury yields and any abrupt shifts in global risk sentiment.
By focusing on today’s fundamental and technical drivers, NZDUSD traders can better gauge the market’s slight bullish bias.
SEO Keywords:
#NZDUSDAnalysis
#NewZealandDollar
#USDForecast
#ForexTrading
#FXMarket
#BullishBias
#CurrencyTrading
#ForexFundamentals
#NZDUSDOutlook

GBP/USD Trade Setup 1 Hour TimeframeOn the 1 hour timeframe, GBP/USD has formed a descending channel, followed by a strong breakout to the upside and a retest.
This pattern has formed at a daily support level. To enter a buy position, we need to observe bullish candlestick patterns for confirmation.

USD/ZARThe South African dollar is one of the most attractive currencies traded in Forex.
According to the news of consumer inflation in the United States, the selling position is likely.
(This is just a personal opinion)
#USDZAR

Learn What is FOREX Market. Trading Volumes & Market Participant
Forex - foreign exchange market, is a location where international currencies are bought and sold by economic participants at various exchange rates.
Forex market is the biggest market in the world, reaching on average 6 trillion dollars trading volumes daily.
Forex market is a vital element for a global economy because it provides capital exchanges between the countries.
The main market participants of forex market are central banks, commercial banks, commercial companies, hedge funds and investors.
🕰In order to grasp how big is that market, take a look what is happening on that just in 60 seconds:
📎Total transactions value reaches 3.52 billion US dollars.
📎 1.15 billion dollars of spot transactions.
📎 1.65 billion dollar of exchange swaps.
📎 Total transactions value involving USD reaches 3 billion US dollars.
📎 Total transactions value involving EURO reaches 1.1 billion US dollars.
📎 Just one single EUR/USD pair accumulates 812 million US dollars transactions value.
It is hard to imagine how such big amounts are rolling with such a frequency and how insignificant are the orders of individual traders.

Will the NZD/USD still be able hold above the 0.60 lvl?The Federal Reserve Chairman Powell reinvoked the power of the interest rate hikes to continue the battle in bringing inflation down. This news push the USD near the 106 lvl and hit the NZD/USD, pulling price below the 0.61 lvl. This was a hit to my position, but I ok with the floating loss currently. In order to reduce my risk, I added a stop at 0.60 because my thought is, if price pushes below the 0.60 lvl and holds by the end of the week, then I don't think I wrong on my R/A on this pair; I am just early. What I am going to do if I do get stopped out, I would wait a few days, see if price is still pushing lower, and then start building my position again. My objective is to have a max position before price pushes above the 0.65 lvl, so getting into a position below the 0.60 lvl, I think is an opportunity. There is also the thought of waiting until the USD NFP and CPI are released and the FED Rate Hike, as this could push the NZD/USD even further down.
I do need to work on my conviction and hope lvl. My hope lvl is around 55% and my conviction lvl is less then 50%. Since that is the case, I am not going to add anymore positions unless I am able to get my conviction lvl to 60%. I am still thinking in the near to longer term, price on the NZD/USD will push higher, but these two - three weeks are going to cause a lot of volatility.
I have another previous published thought on the NZD utilizing the Monthly chart. I wanted to add the NZD/USD update on the daily chart also, in order to see the daily moves in the market and see if my plan pans out.
Again, this is what I am thinking of doing and I am ok with taking the risk. Conduct your own analysis and take on the risk that feels comfortable to you.
Y'all have some good trading out there.

Who Moves the Forex Market | Forex Market Players
Forex is the largest market in the world, with the tremendous daily trading volumes and millions of market participants.
In this educational article, we will discuss who moves that market and who are its 6 the most significant players.
1. Governments
Governments tend to set economic goals and influence the markets with their political decision. They define the course of their nations, issuing policies and imposing regulations.
2. Central banks
Central banks implement the decisions of the governments, applying multiple instruments:
Central banks control the emission of the money, shifting the supply and demand.
They control interest rates and define the credit policies.
Central banks control the international trade and sustain the exchange rates of the national currencies by interventions and handling the foreign currencies and gold reserves.
3. Commercial banks
Commercial banks handle the international transactions.
Over 70% of total Forex Market transactions directly refers to the actives of commercial banks.
Commercial banks are also involved in speculation activities, benefiting from market fluctuations by relying on various strategies.
4. Corporations
Corporation is the business that operates in multiple countries.
With the constant capital flow between its branches and counterparts, corporations are permanently involved in a currency exchange.
Also, corporations usually hedge currency risks, storing their liquidity in particular currencies.
5. Investment funds
By investment funds, we imply the international or domestic professional money management companies. Dealing with hundreds of millions of investments, they quite often are operating on Forex market, buying foreign assets, speculating and hedging.
6. Retail traders
The main goal of retails traders and speculators is to make short terms profits from their transactions on the market.
Typically, the activities of traders constitute a relatively small portion of total trading volumes.
Knowing which forces move the forex market, you can better understand how it works. The spot prices that you see on the charts reflect the sentiment of all the above-mentioned participants.
❤️Please, support my work with like, thank you!❤️

AUDNZD TradeThis is a trade i took on the AUDNZD pair this week. Glad to to see it play out as planned.

GBPAUD TradeGood week so far here's a trade i took this week on the GBPAUD pair. How's your trading week going?

NZDCHF THESISPrice has potential to trade to the up-side after a break out of resistance…. Price is testing support (previous resistance) let’s see how this plays out.

USDCAD THESISHope everyone is having a great trading week! this is our view on the USDCAD pair, price has potential to trade lower after reversing of resistance zone and now testing our structure level. What's your view on this pair?

AUDJPY THESISMarket broke structure and now retested it, we are currently waiting for a break out and candle to close below our line to go short.

EURNZD ThesisPrice failed to make new high and broke the trendline to confirm a potential down movement. i'm currently waiting for price to retest structure before looking to short this pair. What's your thought on this pair?

USDCAd ThesisThis is how i'm currently looking at the usdcad pair. Market broke trendline after failing to brake resistance and make new high. I'm now waiting for a bearish set up as confirmation to go short.

EUR/USD -1/12/2022-• Euro is trading in a bullish trend
• Further signs of trend reversal are showing up everyday
• First, the pair is trading above the 200 SMA for the second consecutive day
• Bulls managed to break and trade above the descending trend line since March 2022
• Price confined inside an ascending triangle, a bullish formation
• A break above the triangle targets 1.08 (March low) as per the projection method

Good days are ahead for the Loonie tradersUSDCAD is really a worldwide political-news related pair!
OIL is not so predictable these days. there are unpredictable conflicts around the world. But the pair is going to move in a clear channel after following undecidable hours!
REMEMBER! This analysis is valid until any BIG news related to oil market.
I think the bearish setup is more probable here but I make myself ready for the bullish one too!


EUR/USD -25/11/2022-• Trading above ascending trend line
• Symmetrical triangle on hourly chart, a continuation pattern
• A symmetrical triangle forms after a strong move, indicating a pause before the continuation of that prior trend
• Next target for bulls is 1.0480
• Bullish bias intact as long as the Euro is trading above the black ascending trend line

EUR/USD -24/11/2022-• Upward channels on daily chart
• First channel was broken, upper trend line was re-tested and is acting now as a support
• Pair now targets the upper resistance line of the second channel at around 1.05
• First resistance at 1.0480
• Second resistance at 1.0790
• Bullish stance as long as support at 1.0350 is held

EURGBP ThesisThis is how we think the EURGBP pair could possibly play out. What's your thought on this pair this week?

USDCAD ThesisCurrently waiting for the candle to close below to take a sell after price retested the resistance zone. What's your thought on this pair?
